

Degradation pathway and microbial mechanism of high-concentration thiocyanate in gold mine tailings wastewater
- PMID: 35518587
- PMCID: PMC9055349
- DOI: 10.1039/d0ra03330h
Degradation pathway and microbial mechanism of high-concentration thiocyanate in gold mine tailings wastewater
Abstract
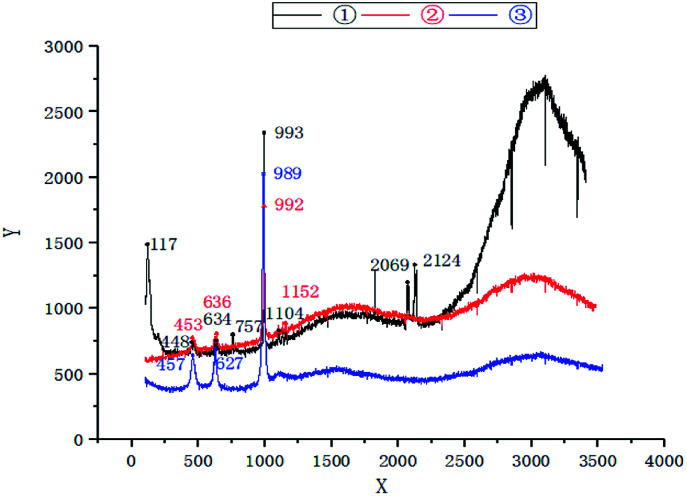
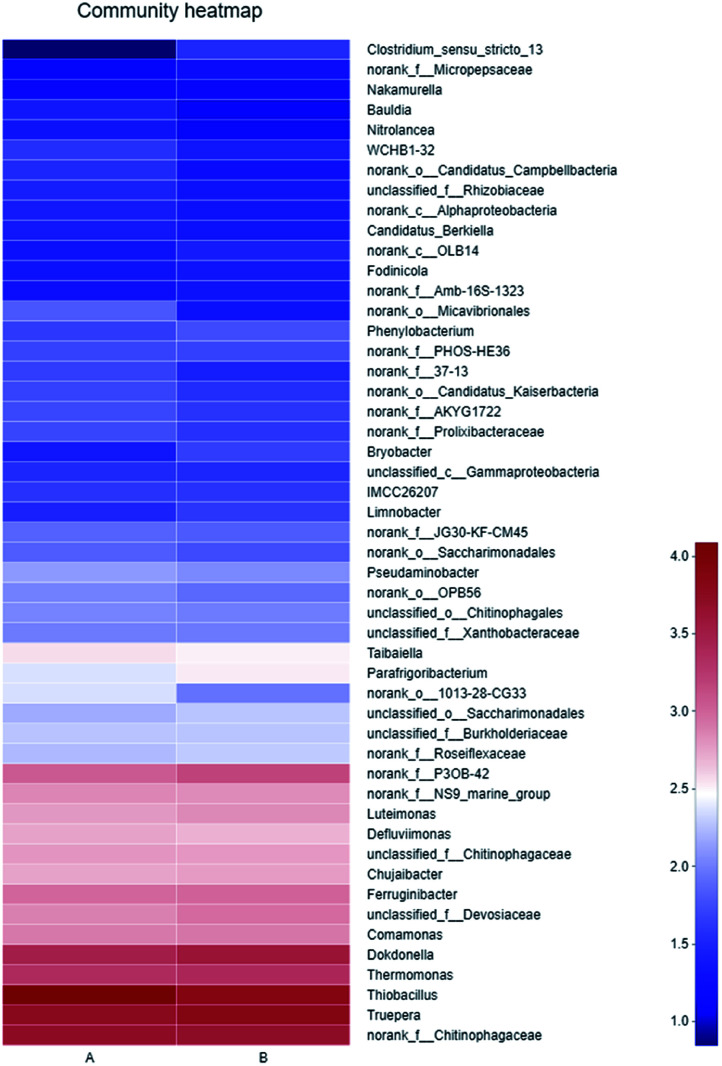
As one of the inorganic pollutants with the highest concentration in the waste water of gold tailings using biohydrometallurgy, thiocyanate (SCN-) was effectively degraded in this research adopting a two-stage activated sludge biological treatment, and the corresponding degradation pathway and microbial community characteristics in this process were also studied. The results showed that SCN- at 1818.00 mg L-1 in the influent decreased to 0.68 mg L-1 after flowing through the two-stage activated sludge units. Raman spectroscopy was used to study the changes of relevant functional groups, finding that SCN- was degraded in the COS pathway. Based on 16S rRNA high-throughput sequencing technology, the microbial diversity in this system was analyzed, and the results indicated that Thiobacillus played a major role in degrading SCN-, of which the abundance in these two activated sludge units was 32.05% and 20.37%, respectively. The results further revealed the biological removal mechanism of SCN- in gold mine tailings wastewater.
This journal is © The Royal Society of Chemistry.
Conflict of interest statement
The authors declare that there are no conflicts to declare.
Figures


Similar articles
-
[Biodiversity of Thiocyanate-degrading Bacteria in Activated Sludge from Coking Wastewater].Huan Jing Ke Xue. 2016 Jul 8;37(7):2689-2695. doi: 10.13227/j.hjkx.2016.07.036. Huan Jing Ke Xue. 2016. PMID: 29964480 Chinese.
-
Genome-resolved metagenomics of a bioremediation system for degradation of thiocyanate in mine water containing suspended solid tailings.Microbiologyopen. 2017 Jun;6(3):e00446. doi: 10.1002/mbo3.446. Epub 2017 Feb 19. Microbiologyopen. 2017. PMID: 28215046 Free PMC article.
-
In Situ Stimulation of Thiocyanate Biodegradation through Phosphate Amendment in Gold Mine Tailings Water.Environ Sci Technol. 2017 Nov 21;51(22):13353-13362. doi: 10.1021/acs.est.7b04152. Epub 2017 Nov 8. Environ Sci Technol. 2017. PMID: 29064247
-
Upflow anaerobic sludge blanket reactor--a review.Indian J Environ Health. 2001 Apr;43(2):1-82. Indian J Environ Health. 2001. PMID: 12397675 Review.
-
A critical review of the effects of gold cyanide-bearing tailings solutions on wildlife.Environ Int. 2007 Oct;33(7):974-84. doi: 10.1016/j.envint.2007.04.007. Epub 2007 May 30. Environ Int. 2007. PMID: 17540445 Review.
Cited by
-
Metagenomics-assembled genomes reveal microbial metabolic adaptation to athalassohaline environment, the case Lake Barkol, China.Front Microbiol. 2025 Jun 4;16:1550346. doi: 10.3389/fmicb.2025.1550346. eCollection 2025. Front Microbiol. 2025. PMID: 40535002 Free PMC article.
References
LinkOut - more resources
Full Text Sources
Research Materials