

Comprehensive Analysis of RAPGEF2 for Predicting Prognosis and Immunotherapy Response in Patients with Hepatocellular Carcinoma
- PMID: 35518785
- PMCID: PMC9064514
- DOI: 10.1155/2022/6560154
Comprehensive Analysis of RAPGEF2 for Predicting Prognosis and Immunotherapy Response in Patients with Hepatocellular Carcinoma
Abstract
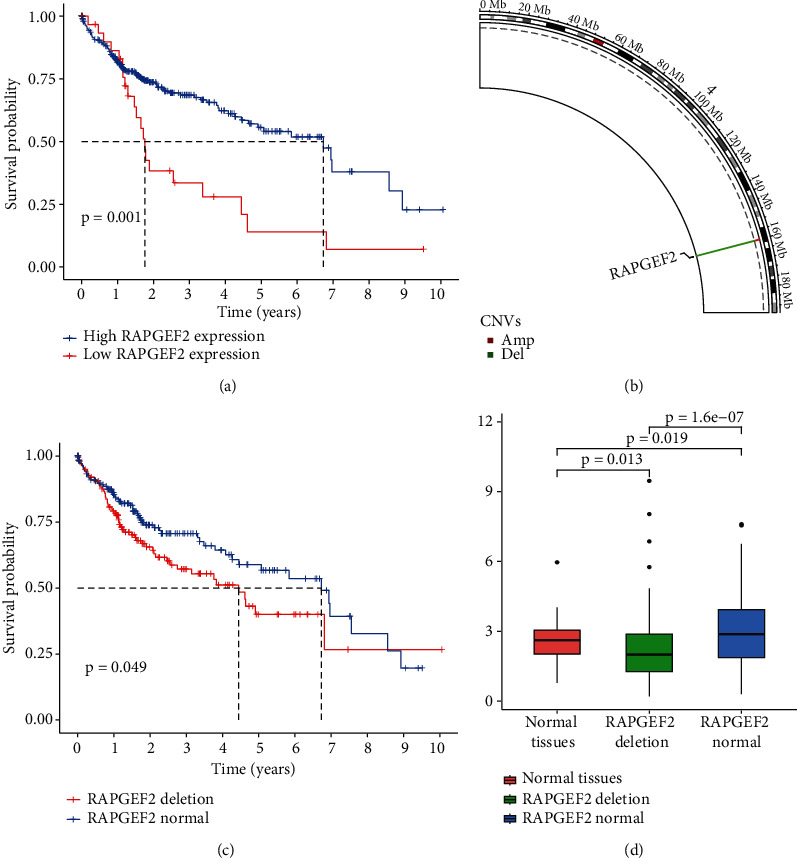
Background: Hepatocellular carcinoma (HCC) is the sixth most common tumor worldwide. Additionally, deletion of RAPGEF2 plays a critical role in CNV and related to tumor immune microenvironment, whereas the prognostic potential of RAPGEF2 in HCC patient needs to be explored.
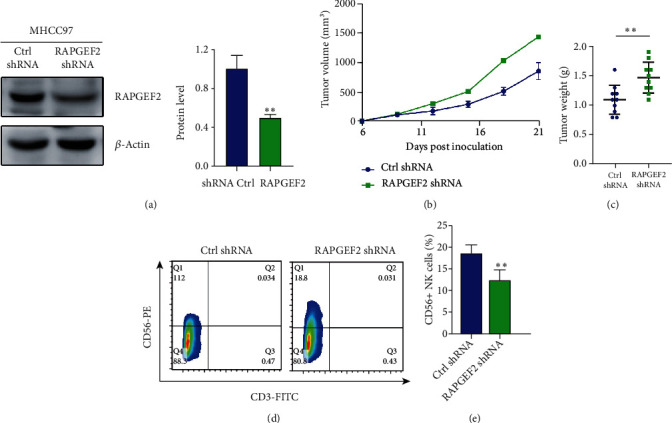
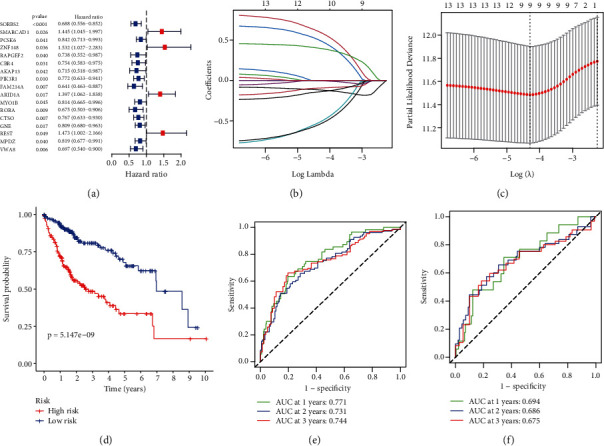
Methods: We looked for prognostic potential genes in HCC using a variety of R programs. Then, using the LASSO Cox regression, we thoroughly evaluated and integrated the RAPGEF2-related genes from TCGA database. Meanwhile, utilizing TCGA and ICGA databases, the link between RAPGEF2 and immunotherapy response in HCC was studied. In vivo, the effect of RAPGEF2 on tumor development and the capacity of natural killer (NK) cells to recruit were confirmed. To ascertain the connection between RAPGEF2-related genes and the prognosis of HCC, a prognostic model was created and validated.
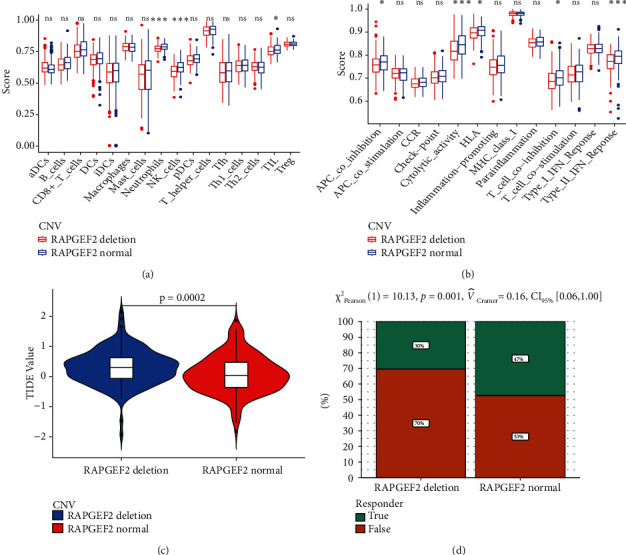
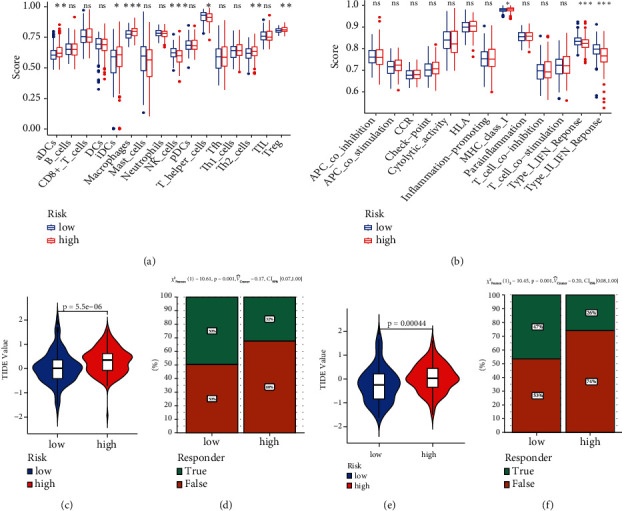
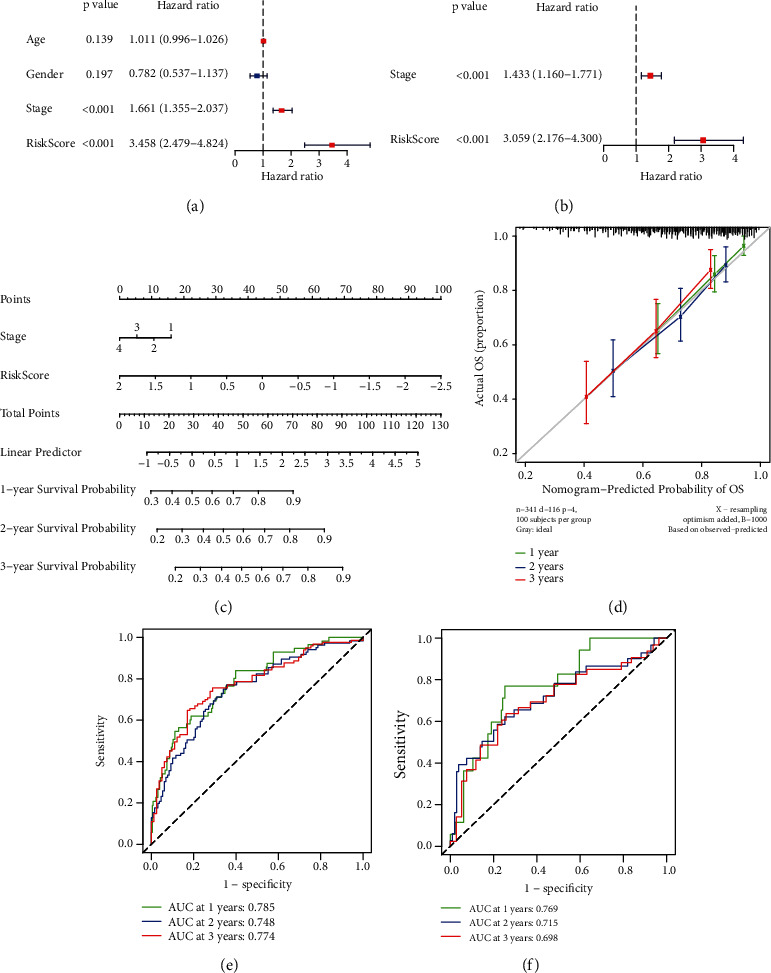
Result: We demonstrated RAPGEF2 has a differential expression, and patients with deletion of RAPGEF2 gene get shorter survival in HCC. Additionally, the tissues without RAPGEF2 have a weaker ability to recruit the NK cells and response to immunotherapy. After that, we scoured the database for eight RAPGEF2-related genes linked with a better prognosis in HCC patients. Additionally, silencing RAPGEF2 accelerated tumor development in the HCC mouse model and decreased CD56+ NK cell recruitment in HCC tissues. TCGA database was used to classify patients into low- and high-risk categories based on the expression of related genes. Patients in the low-risk group had a significantly greater overall survival than those in the high-risk group (P < 0.001). Meanwhile, the low-risk group demonstrated connections with the NK cell and immunotherapy response. Finally, the prognostic nomogram showed a high sensitivity and specificity for predicting the survival of HCC patients at 1, 2, and 3 years.
Conclusion: The prognostic model based on RAPGEF2 and RAPGEF2-related genes showed an excellent predictive performance in terms of prognosis and immunotherapy response in HCC, therefore establishing a unique prognostic model for clinical assessment of HCC patients.
Copyright © 2022 Qing Wu et al.
Conflict of interest statement
The authors state that no commercial or financial interest that might be considered as a possible conflict of interest existed during the conduct of the research.
Figures
Similar articles
-
AHCYL1 Is a Novel Biomarker for Predicting Prognosis and Immunotherapy Response in Colorectal Cancer.J Oncol. 2022 May 7;2022:5054324. doi: 10.1155/2022/5054324. eCollection 2022. J Oncol. 2022. PMID: 35578598 Free PMC article.
-
Identification of chromatin organization-related gene signature for hepatocellular carcinoma prognosis and predicting immunotherapy response.Int Immunopharmacol. 2022 Aug;109:108866. doi: 10.1016/j.intimp.2022.108866. Epub 2022 Jun 9. Int Immunopharmacol. 2022. PMID: 35691273
-
A New Risk Score Based on Eight Hepatocellular Carcinoma- Immune Gene Expression Can Predict the Prognosis of the Patients.Front Oncol. 2021 Nov 19;11:766072. doi: 10.3389/fonc.2021.766072. eCollection 2021. Front Oncol. 2021. PMID: 34868990 Free PMC article.
-
Combined analysis of bulk and single-cell RNA sequencing reveals novel natural killer cell-related prognostic biomarkers for predicting immunotherapeutic response in hepatocellular carcinoma.Front Immunol. 2023 Mar 28;14:1142126. doi: 10.3389/fimmu.2023.1142126. eCollection 2023. Front Immunol. 2023. PMID: 37056756 Free PMC article.
-
Normal tissue adjacent to tumor expression profile analysis developed and validated a prognostic model based on Hippo-related genes in hepatocellular carcinoma.Cancer Med. 2021 May;10(9):3139-3152. doi: 10.1002/cam4.3890. Epub 2021 Apr 4. Cancer Med. 2021. PMID: 33818013 Free PMC article.
Cited by
-
High Co-Expression of PDCD1/TIGIT/CD47/KIR3DL2 in Bone Marrow Is Associated with Poor Prognosis for Patients with Myelodysplastic Syndrome.J Oncol. 2023 Feb 8;2023:1972127. doi: 10.1155/2023/1972127. eCollection 2023. J Oncol. 2023. PMID: 36816361 Free PMC article.
-
A novel angiogenesis-related scoring model predicts prognosis risk and treatment responsiveness in diffuse large B-cell lymphoma.Clin Exp Med. 2023 Nov;23(7):3781-3797. doi: 10.1007/s10238-023-01127-9. Epub 2023 Jul 4. Clin Exp Med. 2023. PMID: 37402040
References
LinkOut - more resources
Full Text Sources
Research Materials
