. 2022 Apr 20:13:874915.
doi: 10.3389/fendo.2022.874915. eCollection 2022.

Single-Cell RNA Sequencing of Human Corpus Cavernosum Reveals Cellular Heterogeneity Landscapes in Erectile Dysfunction

Affiliations

Single-Cell RNA Sequencing of Human Corpus Cavernosum Reveals Cellular Heterogeneity Landscapes in Erectile Dysfunction

Dong Fang et al. Front Endocrinol (Lausanne). .

Abstract

Purpose: To assess the diverse cell populations of human corpus cavernosum in patients with severe erectile dysfunction (ED) at the single-cell level.

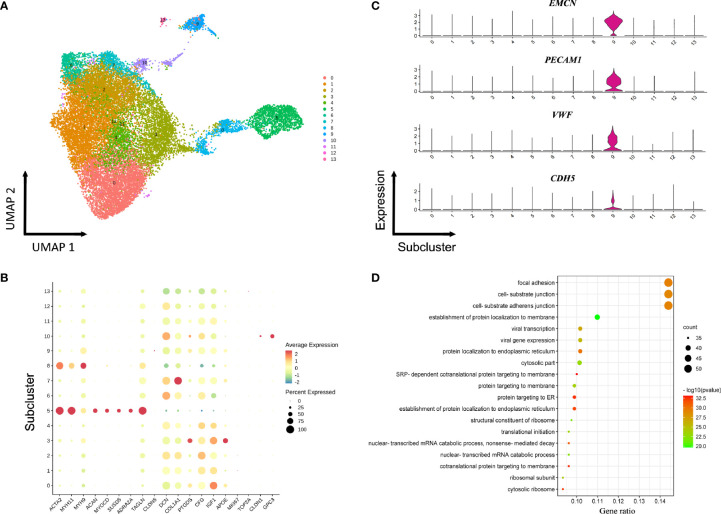
Methods: Penile tissues collected from three patients were subjected to single-cell RNA sequencing using the BD Rhapsody™ platform. Common bioinformatics tools were used to analyze cellular heterogeneity and gene expression profiles from generated raw data, including the packages Seurat, Monocle, and CellPhoneDB.

Results: Disease-related heterogeneity of cell types was determined in the cavernous tissue such as endothelial cells (ECs), smooth muscle cells, fibroblasts, and immune cells. Reclustering analysis of ECs identified an arteriole ECs subcluster and another one with gene signatures of fibroblasts. The proportion of fibroblasts was higher than the other cell populations and had the most significant cellular heterogeneity, in which a distinct subcluster co-expressed endothelial markers. The transition trajectory of differentiation from smooth muscle cells into fibroblasts was depicted using the pseudotime analysis, suggesting that the expansion of corpus cavernosum is possibly compromised as a result of fibrosis. Cell-cell communications among ECs, smooth muscle cells, fibroblasts, and macrophages were robust, which indicated that inflammation may also have a crucial role in the development of ED.

Conclusions: Our study has demonstrated a comprehensive single-cell atlas of cellular components in human corpus cavernosum of ED, providing in-depth insights into the pathogenesis. Future research is warranted to explore disease-specific alterations for individualized treatment of ED.

Keywords: RNA-seq; endothelial cells; erectile dysfunction; fibroblasts; single-cell analysis; smooth muscle cells.


Conflict of interest statement

The authors declare that the research was conducted in the absence of any commercial or financial relationships that could be construed as a potential conflict of interest.

Figures

Figure 1
Figure 1
Overview of the single-cell landscape for corpus cavernosum in erectile dysfunction. (A) Schematic graph describing the workflow of the experiment. Human corpus cavernosum samples from three patients with erectile dysfunction were collected for single-cell RNA-seq. (B) A UMAP view and clustering analysis of combined single-cell transcriptome data from human corpus cavernosum (n = 37892). Clusters are distinguished by different colors with the general identity of each cell cluster shown on the right. (C) The cellular composition distribution for each patient sample. (D) Feature plots of expression distribution for selected genes. Expression levels for each cell are color-coded and overlaid onto the UMAP plot. Cell types were mainly classified as endothelial cells (green), smooth muscle cells (orange), and fibroblasts (pink). UMAP, uniform manifold approximation and projection.
Figure 2
Figure 2
Endothelial subpopulations display specific functional transcriptomic signatures. (A) 13101 endothelial cells (clusters 0, 2, 13) were highlighted and colored in the UMAP plot of all clusters. (B) Functional enrichment analysis with GO terms was performed with the significantly up-regulated genes in three endothelial subpopulations. (C) Endothelial cells were extracted and reclustered into 7 subclusters plotted in a UMAP map. (D) Heatmap depicting differentially expressed genes among endothelial subclusters. (E) Expressions of SEMA3G, GJA5, TSPAN2, DCN, LUM, and IGF1 in each subcluster.
Figure 3
Figure 3
Reclustering of fibroblasts and smooth muscle cells. (A) UMAP plot of combined fibroblasts and smooth muscle cells identified via non-hierarchical cluster analysis. (B) Expression of selected cell-type-specific genes in subclusters. Dot size corresponds to the percentage of cells in a subcluster expressing the gene, and the color is proportional to the gene expression frequency (red represents high expression frequency). (C) Violin plots of gene expression demonstrating specifically high expression of EMCN, VWF, PECAM1, and CDH5 in sC9 fibroblasts. (D) GO analysis of the transcriptomic signature in the sC9 fibroblasts subpopulation.
Figure 4
Figure 4
Putative differentiation trajectories from smooth muscle cells to fibroblasts. (A) Pseudotime analysis on fibroblasts and smooth muscle cells, arranging them into two major trajectories. (B) All cells in subclusters on the pseudotime are color-coded to match the colors in Figure 3A . (C) Heatmap showing differentially expressed genes among the identified 6 gene clusters. (D) Color-coded pseudotime feature plots for selected genes of smooth muscle cells (ACTA2, MYH11, TAGLN) and fibroblasts (DCN, LUM, COL1A2).
Figure 5
Figure 5
Potential ligand-receptor interactions analyses in different subpopulations. (A) The chord diagram shows the quantity of communication among distinct cell types, which are proportional to edge width. (B) Heatmap of the number of predicted interactions between cell groups. (C) Bubble chart shows the potential ligand-receptor pairs between SMCs and fibroblasts as well as ECs and fibroblasts.
Figure 6
Figure 6
Cell cycle analysis. (A) UMAP plot of all clusters at three stages (G1, S, G2M), which are color-coded to match the colors in Figure 1B . (B) Distribution of cell counts at three stages (G1, S, G2M) in the tissue samples. (C) Bar chart shows the cell counts in each cluster at three stages (G1, S, G2M).

Similar articles

Cited by

References

    1. Salonia A, Bettocchi C, Boeri L, Capogrosso P, Carvalho J, Cilesiz NC, et al. . European Association of Urology Guidelines on Sexual and Reproductive Health—2021 Update: Male Sexual Dysfunction. Eur Urol (2021) 80:333–57. doi: 10.1016/j.eururo.2021.06.007 - DOI - PubMed
    1. Kessler A, Sollie S, Challacombe B, Briggs K, Van Hemelrijck M. The Global Prevalence of Erectile Dysfunction: A Review. BJU Int (2019) 124:587–99. doi: 10.1111/bju.14813 - DOI - PubMed
    1. Yafi FA, Jenkins L, Albersen M, Corona G, Isidori AM, Goldfarb S, et al. . Erectile Dysfunction. Nat Rev Dis Primers (2016) 2:16003. doi: 10.1038/nrdp.2016.3 - DOI - PMC - PubMed
    1. Corona G, Lee DM, Forti G, O’Connor DB, Maggi M, O’Neill TW, et al. . Age-Related Changes in General and Sexual Health in Middle-Aged and Older Men: Results From the European Male Ageing Study (EMAS). J Sex Med (2010) 7:1362–80. doi: 10.1111/j.1743-6109.2009.01601.x - DOI - PubMed
    1. Terentes-Printzios D, Ioakeimidis N, Rokkas K, Vlachopoulos C. Interactions Between Erectile Dysfunction, Cardiovascular Disease and Cardiovascular Drugs. Nat Rev Cardiol (2022) 19:59–74. doi: 10.1038/s41569-021-00593-6 - DOI - PubMed

Publication types