. 2022 Mar 23;13(4):2431-2449.
doi: 10.1364/BOE.448139. eCollection 2022 Apr 1.

Cherenkov light emission in molecular radiation therapy of the thyroid and its application to dosimetry

Affiliations

Cherenkov light emission in molecular radiation therapy of the thyroid and its application to dosimetry

Jigar Dubal et al. Biomed Opt Express. .

Abstract

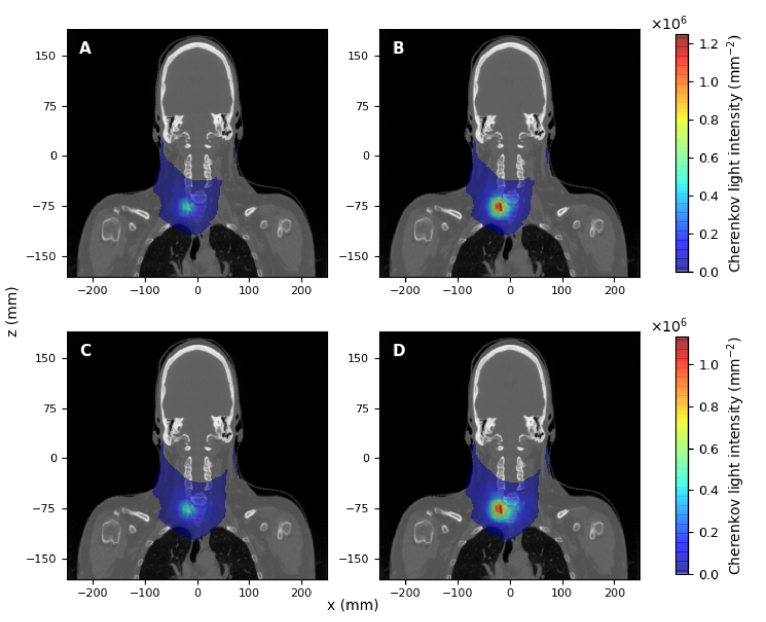
Numerical experiments based on Monte Carlo simulations and clinical CT data are performed to investigate the spatial and spectral characteristics of Cherenkov light emission and the relationship between Cherenkov light intensity and deposited dose in molecular radiotherapy of hyperthyroidism and papillary thyroid carcinoma. It is found that Cherenkov light is emitted mostly in the treatment volume, the spatial distribution of Cherenkov light at the surface of the patient presents high-value regions at locations that depend on the symmetry and location of the treatment volume, and the surface light in the near-infrared spectral region originates from the treatment site. The effect of inter-patient variability in the tissue optical parameters and radioisotope uptake on the linear relationship between the dose absorbed by the treatment volume and Cherenkov light intensity at the surface of the patient is investigated, and measurements of surface light intensity for which this effect is minimal are identified. The use of Cherenkov light measurements at the patient surface for molecular radiation therapy dosimetry is also addressed.


Conflict of interest statement

The authors declare no conflicts of interest.

Figures

Fig. 1.
Fig. 1.
Optical properties of biological tissue used in this study: A) absorption coefficient μa ; B) scattering coefficient μs ; C) refractive index n ; and D) anisotropy factor g , where the graphs for thyroid, tumour and adipose tissue overlap at g=0.9 .
Fig. 2.
Fig. 2.
The activity (as a percentage of the administered activity) as a function of time for the treatment of hyperthyroidism (dotted) and PTC (dashed).
Fig. 3.
Fig. 3.
The spatial distribution, of all beta particles produced from radioactive decay of I131 (A,B), absorbed dose (C,D), and spectrally-integrated emitted Cherenkov light intensity (E,F), for the treatment of hyperthyroidism, for administered activities of 400 MBq (left column) and 700 MBq (right column). A dotted contour of the treatment volume is also presented in A and B. All results are displayed in the trans-axial plane z=50.6 mm of the CT data used.
Fig. 4.
Fig. 4.
The same as for Fig. 3 but for the treatment of PTC with all the radioisotope uptake distributed within the tumour, and administered activities of 700 MBq (A,C,E) and 1.1 GBq (B,D,F), in the trans-axial plane z=74.4 mm. A dotted contour of the tumour is presented in A and B.
Fig. 5.
Fig. 5.
The same as for Fig. 4 but for 75% of the radioisotope uptake retained by the tumour and 25% by the thyroid. Dotted contours of the tumour and the thyroid are also presented in A and B.
Fig. 6.
Fig. 6.
The mean deposited dose in the thyroid and tumour in the treatment of hyperthyroidism (A) and PTC (with 100% of the radioisotope uptake distributed in the tumour) (B), respectively, as a function of the total Cherenkov light intensity in the treatment volume. The three sets of data correspond to three different values of the refraction index n of the thyroid and tumour, respectively.
Fig. 7.
Fig. 7.
Spectrally-integrated Cherenkov light intensity emerging from the patient surface for the treatment of hyperthyroidism, for administered activities of A) 400 MBq and B) 700 MBq.
Fig. 8.
Fig. 8.
Spectrally-integrated Cherenkov light intensity emerging from the patient surface for the treatment of PTC, for administered activities of (A,C) 500 MBq and (B,D) 1.1 GBq. (A,B) correspond to 100% of the radioisotope uptake distributed in the tumour, and (C,D) to 75% of the radioisotope uptake distributed in the tumour and 25% in the thyroid.
Fig. 9.
Fig. 9.
The normalized spectrum of Cherenkov light within the treatment volume and for light emerging from the hot spot and the entire surface, for (A) treatment of hyperthyroidism for an administered activity of 500 MBq, and (B) for PTC treatment for an administered activity of 700 MBq. In B, the spectra corresponding to different tumour uptakes overlap.
Fig. 10.
Fig. 10.
Hyperthyroidism treatment. The normalised spatial distribution of the emitted Cherenkov photons (for all activities) contributing to the total surface intensity, for the wavelength intervals (A) 500600 nm, (B) 600900 nm and (C) 9001200 nm. The figures are in the trans-axial plane z=50.6 mm, and the number of photons in each figure was normalised to the maximum value in the 600900 nm range. A dotted contour of the treatment volume is also presented.
Fig. 11.
Fig. 11.
PTC treatment. The normalised spatial distribution of the emitted Cherenkov photons (for all activities) contributing to the total surface intensity, for the wavelength intervals (A,D) 500600 nm, (B,E) 600900 nm, and (C,F) 9001200 nm. A,B,C correspond to the entire radioisotope uptake distributed in the tumour, and (D,E,F) to 75% of the radioisotope uptake in the tumour and 25% in the thyroid. The figures are in the trans-axial plane z=74.4 mm, and the values in each figure have been normalised to the maximum value in the 600900 nm range for each treatment. Dotted contours for tumour (A-C) and for tumour and thyroid (D-E) are also shown.
Fig. 12.
Fig. 12.
The mean dose deposited in the treatment volume as a function of the spatially and spectrally-integrated Cherenkov light surface intensity, for measurements on the entire surface (A, C) and at the hot spot (B,D), for the treatment of hyperthyroidism (A,B) and PTC (C,D) where 100% , 90% and 75% of the radioisotope uptake is distributed within the tumour and the rest in the thyroid. The three sets of data for each case correspond to the baseline set of optical parameters and to optical parameters exhibiting an increase and decrease with respect to the baseline values (as presented in Table 1).

Similar articles

Cited by

References

    1. Zhang R., Gladstone D. J., Jarvis L. A., Strawbridge R. R., Hoopes P. J., Friedman O. D., Glaser A. K., Pogue B. W., “Real-time in vivo cherenkoscopy imaging during external beam radiation therapy,” J. Biomed. Opt. 18, 110504 (2013).10.1117/1.JBO.18.11.110504 - DOI - PMC - PubMed
    1. Zhang R., Glaser A., Esipova T. V., Kanick S. C., Davis S. C., Vinogradov S., Gladstone D., Pogue B. W., “Čerenkov radiation emission and excited luminescence (crel) sensitivity during external beam radiation therapy: Monte carlo and tissue oxygenation phantom studies,” Biomed. Opt. Express 3(10), 2381–2394 (2012).10.1364/BOE.3.002381 - DOI - PMC - PubMed
    1. McGowan D., Guy M., “Time to demand dosimetry for molecular radiotherapy?” Br. J. Radiol. 88(1047), 20140720 (2015).10.1259/bjr.20140720 - DOI - PMC - PubMed
    1. Čerenkov P., “Visible radiation produced by electrons moving in a medium with velocities exceeding that of light,” Phys. Rev. 52(4), 378 (1937).10.1103/PhysRev.52.378 - DOI
    1. Fenwick A., Wevrett J., Ferreira K., Denis-Bacelar A., Robinson A. P., “Quantitative imaging, dosimetry and metrology; where do national metrology institutes fit in?” Appl. Radiat. Isot. 134, 74–78 (2018).10.1016/j.apradiso.2017.11.014 - DOI - PubMed

LinkOut - more resources