Light-adapted flicker optoretinograms captured with a spatio-temporal optical coherence-tomography (STOC-T) system
- PMID: 35519256
- PMCID: PMC9045926
- DOI: 10.1364/BOE.444567
Light-adapted flicker optoretinograms captured with a spatio-temporal optical coherence-tomography (STOC-T) system
Abstract
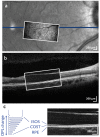
For many years electroretinography (ERG) has been used for obtaining information about the retinal physiological function. More recently, a new technique called optoretinography (ORG) has been developed. In one form of this technique, the physiological response of retinal photoreceptors to visible light, resulting in a nanometric photoreceptor optical path length change, is measured by phase-sensitive optical coherence tomography (OCT). To date, a limited number of studies with phase-based ORG measured the retinal response to a flickering light stimulation. In this work, we use a spatio-temporal optical coherence tomography (STOC-T) system to capture optoretinograms with a flickering stimulus over a 1.7 × 0.85 mm2 area of a light-adapted retina located between the fovea and the optic nerve. We show that we can detect statistically-significant differences in the photoreceptor optical path length (OPL) modulation amplitudes in response to different flicker frequencies and with better signal to noise ratios (SNRs) than for a dark-adapted eye. We also demonstrate the ability to spatially map such response to a patterned stimulus with light stripes flickering at different frequencies, highlighting the prospect of characterizing the spatially-resolved temporal-frequency response of the retina with ORG.
© 2022 Optica Publishing Group under the terms of the Optica Open Access Publishing Agreement.
Conflict of interest statement
The authors declare no conflicts of interest.
Figures


Similar articles
-
Chirped flicker optoretinography for in vivo characterization of human photoreceptors' frequency response to light.Opt Lett. 2024 May 1;49(9):2461-2464. doi: 10.1364/OL.514637. Opt Lett. 2024. PMID: 38691744
-
Extraction of phase-based optoretinograms (ORG) from serial B-scans acquired over tens of seconds by mouse retinal raster scanning OCT system.Biomed Opt Express. 2021 Nov 30;12(12):7849-7871. doi: 10.1364/BOE.439900. eCollection 2021 Dec 1. Biomed Opt Express. 2021. PMID: 35003871 Free PMC article.
-
Changes in Retinal Structure and Function in Mice Exposed to Flickering Blue Light: Electroretinographic and Optical Coherence Tomographic Analyses.Exp Neurobiol. 2024 Jun 30;33(3):152-164. doi: 10.5607/en24011. Exp Neurobiol. 2024. PMID: 38993082 Free PMC article.
-
Functional Optical Coherence Tomography for Intrinsic Signal Optoretinography: Recent Developments and Deployment Challenges.Front Med (Lausanne). 2022 Apr 4;9:864824. doi: 10.3389/fmed.2022.864824. eCollection 2022. Front Med (Lausanne). 2022. PMID: 35445037 Free PMC article. Review.
-
[A challenge to primary open-angle glaucoma including normal-pressure. Clinical problems and their scientific solution].Nippon Ganka Gakkai Zasshi. 2012 Mar;116(3):233-67; discussion 268. Nippon Ganka Gakkai Zasshi. 2012. PMID: 22568103 Review. Japanese.
Cited by
-
Light-adapted flicker-optoretinography based on raster-scan optical coherence tomography towards clinical translation.Biomed Opt Express. 2024 Sep 26;15(10):6036-6051. doi: 10.1364/BOE.538481. eCollection 2024 Oct 1. Biomed Opt Express. 2024. PMID: 39421778 Free PMC article.
-
Phase-Sensitive Measurements of Depth-Dependent Signal Transduction in the Inner Plexiform Layer.Front Med (Lausanne). 2022 Jun 1;9:885187. doi: 10.3389/fmed.2022.885187. eCollection 2022. Front Med (Lausanne). 2022. PMID: 35721092 Free PMC article.
-
Evaluating the performance of OCT in assessing static and potential dynamic properties of the retinal ganglion cells and nerve fiber bundles in the living mouse eye.Biomed Opt Express. 2023 Nov 28;14(12):6422-6441. doi: 10.1364/BOE.504637. eCollection 2023 Dec 1. Biomed Opt Express. 2023. PMID: 38420317 Free PMC article.
-
Longitudinal Changes in Optoretinography Provide an Early and Sensitive Biomarker of Outer Retinal Disease.Am J Ophthalmol. 2025 Sep;277:375-386. doi: 10.1016/j.ajo.2025.05.032. Epub 2025 May 28. Am J Ophthalmol. 2025. PMID: 40447249
-
Fast and slow light-induced changes in murine outer retina optical coherence tomography: complementary high spatial resolution functional biomarkers.PNAS Nexus. 2022 Oct 14;1(4):pgac208. doi: 10.1093/pnasnexus/pgac208. eCollection 2022 Sep. PNAS Nexus. 2022. PMID: 36338188 Free PMC article.
References
-
- Gouras P., “Symposium on Electrophysiology: Electroretinography: Some Basic Principles,” Invest. Ophthalmol. Visual Sci. 9, 557–569 (1970). - PubMed
LinkOut - more resources
Full Text Sources
Other Literature Sources
