. 2022 Mar 22;13(4):2346-2363.
doi: 10.1364/BOE.448286. eCollection 2022 Apr 1.

Blue-LIRIC in the rabbit cornea: efficacy, tissue effects, and repetition rate scaling

Affiliations

Blue-LIRIC in the rabbit cornea: efficacy, tissue effects, and repetition rate scaling

Ruiting Huang et al. Biomed Opt Express. .

Abstract

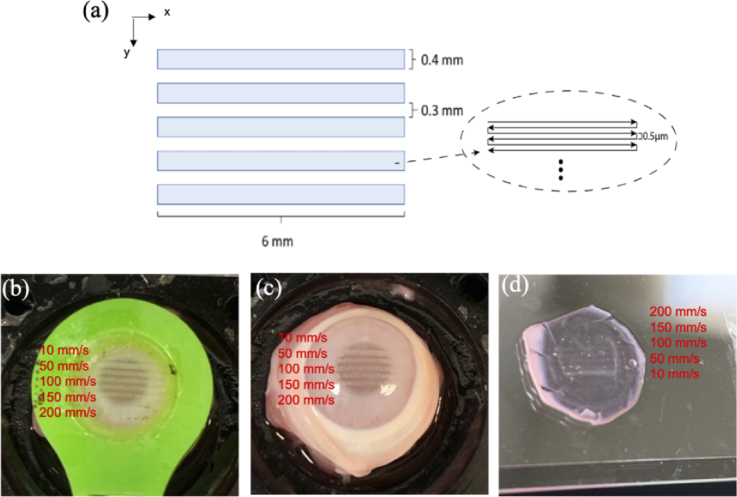
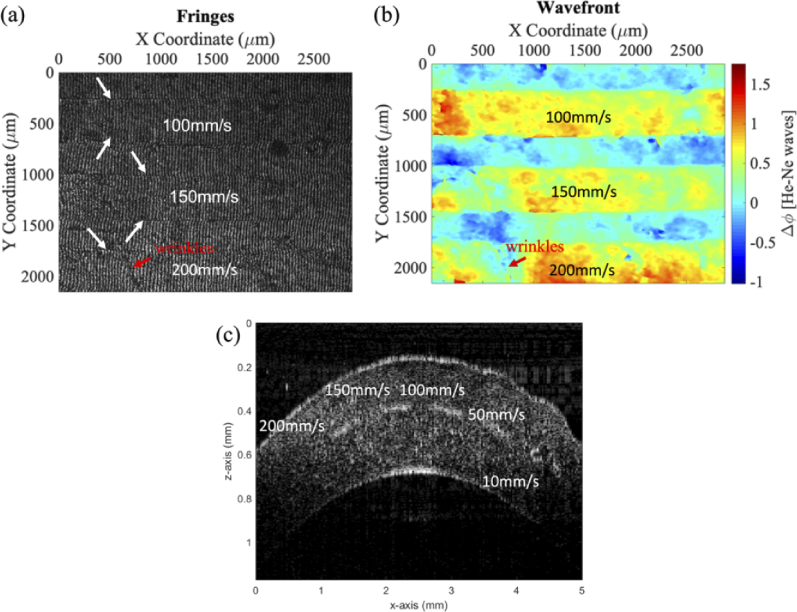
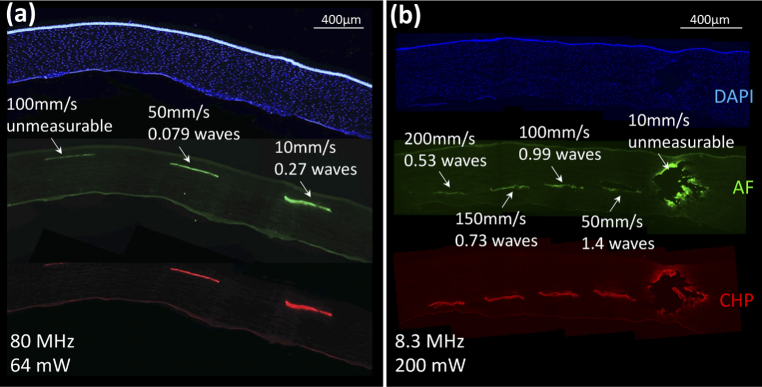
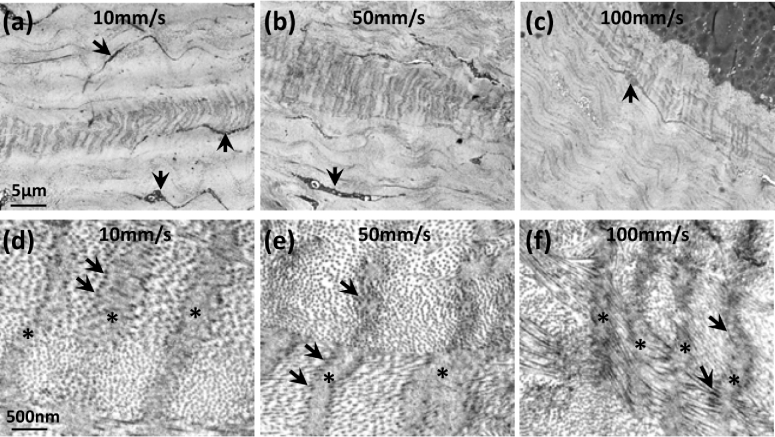
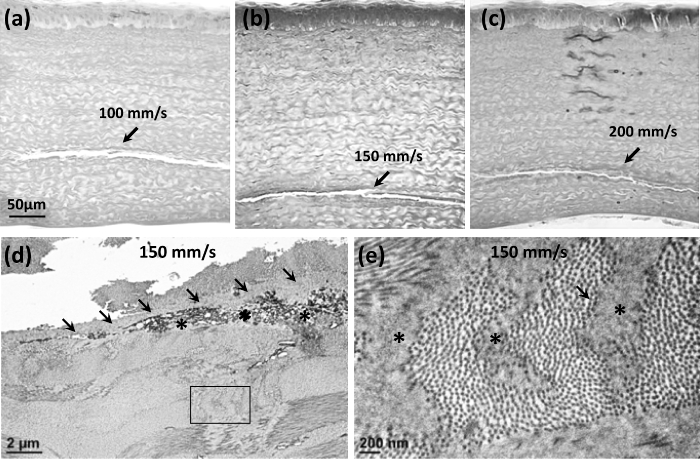
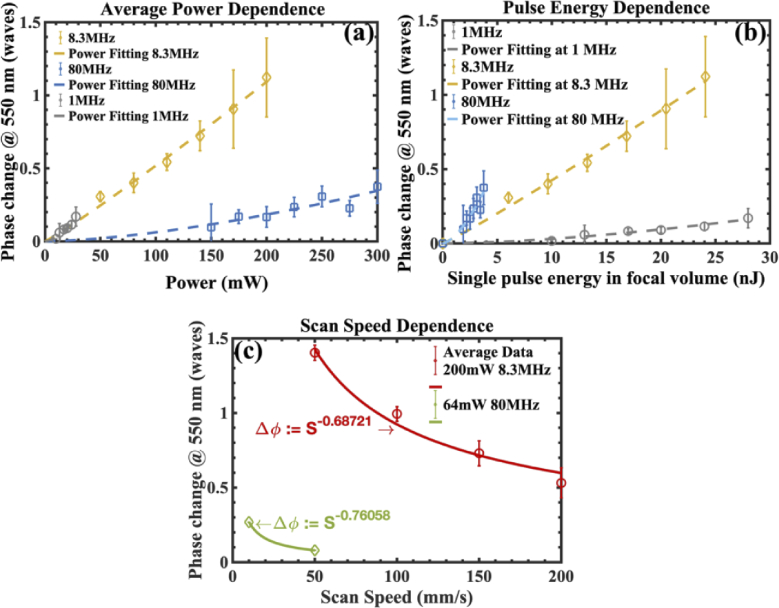
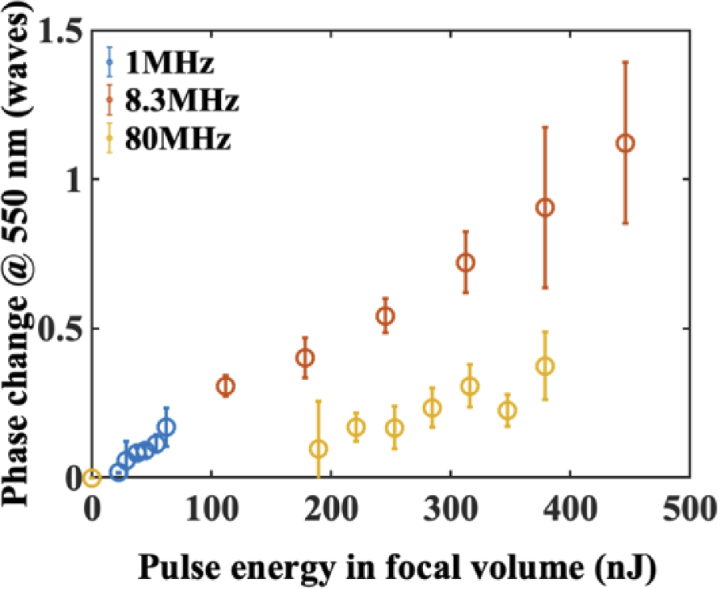
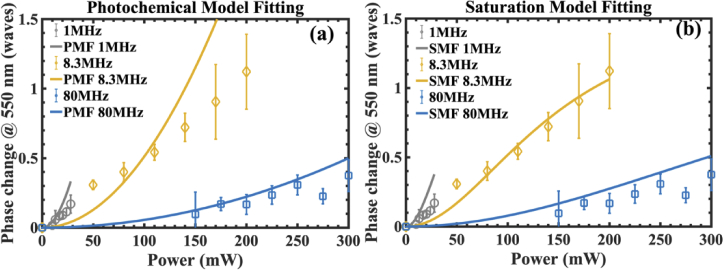
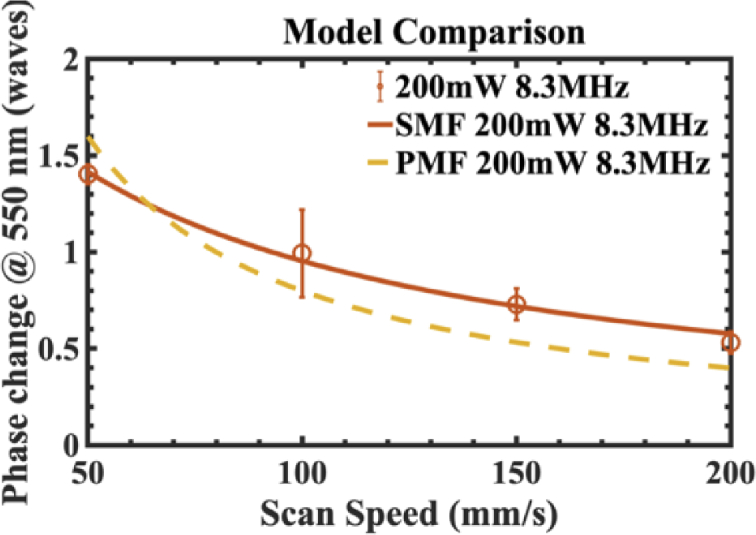
Laser-induced refractive index change (LIRIC) is being developed as a non-invasive way to alter optical properties of transparent, ophthalmic materials including corneas ex vivo and in vivo. This study examined the optical and biological effects of blue-LIRIC (wavelengths 400-405 nm) of ex-vivo rabbit corneas. Following LIRIC treatment at low and high repetition rates (8.3 MHz and 80 MHz, respectively), we interferometrically measured optical phase change, obtained transmission electron microscopy (TEM) micrographs, and stained histological sections with collagen hybridizing peptides (CHP) to assess the structural and organizational changes caused by LIRIC at different repetition rates. Finally, we performed power and scan speed scaling experiments at three different repetition rates (1 MHz, 8.3 MHz, and 80 MHz) to study their impact on LIRIC efficacy. Histologic co-localization of CHP and LIRIC-generated green autofluorescence signals suggested that collagen denaturation had occurred in the laser-irradiated region. TEM imaging showed different ultrastructural modifications for low and high repetition rate writing, with discrete homogenization of collagen fibrils at 80 MHz, as opposed to contiguous homogenization at 8.3 MHz. Overall, this study confirmed that LIRIC efficacy can be dramatically increased, while still avoiding tissue ablation, by lowering the repetition rate from 80 MHz to 8.3 MHz. Modeling suggests that this is due to a higher, single-pulse, energy density deposition at given laser powers during 8.3 MHz LIRIC.


Conflict of interest statement

WHK has founder’s equity in Clerio Vision, and he is Chief Science Officer, but has no fiduciary or management responsibility. KRH has founder’s equity in Clerio Vision Inc., but no fiduciary responsibility. LZ is an employee of, and has equity in Clerio Vision Inc.

Figures

Fig. 1.
Fig. 1.
(a) Schematic of LIRIC-induced phase bars. Each rectangular region was written with a fixed set of parameters. Phase bars were 0.4 × 6 mm with a 0.3 mm inter-bar spacing. Each phase bar consists of 800 grating lines with a line spacing of 0.5 µm, created by raster scanning the laser focal spot through the corneal tissue. (b-d) Photos of a rabbit eye globe with five LIRIC phase bars, created at scan speeds of 10 mm/s, 50 mm/s, 100 mm/s, 150 mm/s and 200 mm/s. Phase bars can be seen immediately after writing and with the applanator on top of the eye globe (b); immediately after writing and without the applanator (c); radial cut excised corneal tissue imaged two hours after immersing the written globe in Optisol-GS and refrigeration (d).
Fig. 2.
Fig. 2.
(a) Interferogram, (b) wavefront image correspond to three phase bars created at 100 mm/s, 150 mm/s and 200 mm/s. White arrows mark the edges of phase bars and non-uniformity of the wavefront is caused by imperfect tissue quality (e.g., wrinkles), (c) OCT image of a written rabbit eye globe with five phase bars created at 10 mm/s, 50 mm/s, 100 mm/s, 150 mm/s and 200 mm/s (from right to left) Note severe damage in the 10 mm/s bar.
Fig. 3.
Fig. 3.
(a) Micrographs of rabbit corneal sections (epithelium is top-most in all cases) illustrating the histological impact of Blue-LIRIC at 80 MHz and 64 mW. Blue fluorescence in the top image indicates DAPI-positive cells; green autofluorescence in the middle image denotes laser-treated areas under 488 nm illumination; red fluorescence identifies CHP-positive signals in the bottom image, which are well co-localized with the green autofluorescence signals. Single LIRIC layers were created at 3 different scan speeds from 10 mm/s to 100 mm/s, generating levels of induced phase change indicated above each bar. Note that at 100 mm/s and 80 MHz, the phase change was too low to be measured. (b) Images of rabbit corneal sections (similar orientation and staining to (a)) illustrating the histological impact of Blue-LIRIC at 8.3 MHz and 200 mW. Single LIRIC layers were created at scan speeds ranging from 10 mm/s to 200 mm/s, generating levels of induced phase change indicated above each bar. Note that at 10 mm/s, gross tissue damage occurred, and the phase change could not be measured. Unlike the 80 MHz data, there was no clear visual correlation of AF or CHP signal strength to induced phase change.
Fig. 4.
Fig. 4.
(a) TEM micrograph of Blue-LIRIC pattern inscribed at 10 mm/s, 80 MHz and 64 mW inside the corneal stroma. Repeating areas of photo-modification can be seen as darkened tracks running roughly parallel to collagen lamellae. (b) TEM micrograph of LIRIC pattern written at 50 mm/s, 80 MHz and 64 mW. (c) TEM micrograph of LIRIC pattern written at 100 mm/s, 80 MHz and 64 mW, but which ended up close to the epithelium (dark cells at the top right of the picture). Magnification is identical for (a)-(c). Intra-stromal cells – likely keratocytes – are arrowed. (d)-(f) Higher magnification views of the LIRIC tracks in (a)-(c), illustrating their ultrastructure. At all speeds, this involved darkening of collagen fibrils around the edges (arrowed) of a vertically elongated area where the collagen fibril structure was lost, and the ECM material became relatively homogenous (*).
Fig. 5.
Fig. 5.
(a)-(c) TEM micrograph of Blue-LIRIC pattern inscribed at 100 mm/s, 150 mm/s and 200 mm/s, 8.3 MHz, and 200 mW inside the corneal stroma. Clear fractures of the stromal structure can be seen in the middle of each LIRIC zone, running parallel to the collagen lamellae and the corneal surface. (d) Magnified view of part of the fracture through the LIRIC zone in the 150 mm/s pattern in (b) illustrating the continuous zone of homogenized ECM (arrowed) on the edges of the fracture, broken down cellular material likely from a dying keratocyte (*) and the occasional tracks seen above or -in this case- below the fracture (rectangular box whose contents are further magnified in (e)). (e) Example of tracks seen periodically above or below the 8.3 MHz LIRIC patterns, which exhibited typical structure consisting of darkening of collagen fibrils around the edges (arrowed) of a vertically elongated area where the collagen fibril structure was lost and the collagenous material became relatively homogenous (*).
Fig. 6.
Fig. 6.
(a) Induced phase change as a function of average power at a fixed scan speed of 200 mm/s. Quantitative experimental data were obtained at 3 repetition rates and were fitted to a power function. The exponents of the power functions are 1.63 at 1 MHz, 1.08 at 8.3 MHz and 1.57 at 80 MHz, respectively, denoting the order of multiphoton absorption process. (b) Induced phase change as a function of single pulse energy. (c) Induced phase change as a function of scan speed at a fixed power of 200 mW at 8.3 MHz and at a fixed power of 64 mW at 80 MHz. The exponents of the fitted power functions denote an inverse sub-linear relationship between the scan speed and the induced phase change.
Fig. 7.
Fig. 7.
Induced phase change as a function of the deposited pulse energy in the focal volume obtained at three repetition rates, 1 MHz, 8.3 MHz and 80 MHz.
Fig. 8.
Fig. 8.
(a) Quantitative experimental data were fitted by the photochemical model fitting (PMF). Deviation between the experimental data and the model is noticeable at large signal regimes. (b) The modified photochemical model with a saturation factor, represented as a saturation model fitting (SMF), is applied to fit data, and yields a good agreement.
Fig. 9.
Fig. 9.
Both the photochemical model fitting (PMF) and the saturation model fitting (SMF) were used to fit the experimental data at 8.3 MHz. The saturation model yields a higher coefficient of determination R2, manifesting itself as a more reliable way to describe the scaling behavior of the induced phase change inside corneal tissues.

Similar articles

Cited by

References

    1. Chen L. Y., Manche E. E., “Comparison of femtosecond and excimer laser platforms available for corneal refractive surgery,” Curr. Opin. Ophthalmol. 27(4), 316–322 (2016).10.1097/ICU.0000000000000268 - DOI - PubMed
    1. Bashir Z. S., Ali M. H., Anwar A., Ayub M. H., Butt N. H., “Femto-LASIK: the recent innovation in laser assisted refractive surgery,” J. Pak. Med. Assoc. 67, 609 (2017). - PubMed
    1. Chung S. H., Mazur E., “Surgical applications of femtosecond lasers,” J. Biophotonics 2(10), 557–572 (2009).10.1002/jbio.200910053 - DOI - PubMed
    1. Krueger R., Trokel S., Schubert H., “Interaction of ultraviolet laser light with the cornea,” Invest. Ophthalmol. Vis. Sci. 26, 1455–1464 (1985). - PubMed
    1. Ambrósio Jr R., Tervo T., Wilson S. E., “LASIK-associated dry eye and neurotrophic epitheliopathy: pathophysiology and strategies for prevention and treatment,” J. Refract. Surg. 24(4), 396–407 (2008).10.3928/1081597X-20080401-14 - DOI - PubMed

LinkOut - more resources