. 2022 Mar 16;13(4):2144-2155.
doi: 10.1364/BOE.453270. eCollection 2022 Apr 1.

UV surface disinfection in a wearable drug delivery device

Affiliations

UV surface disinfection in a wearable drug delivery device

Adam Zrehen et al. Biomed Opt Express. .

Abstract

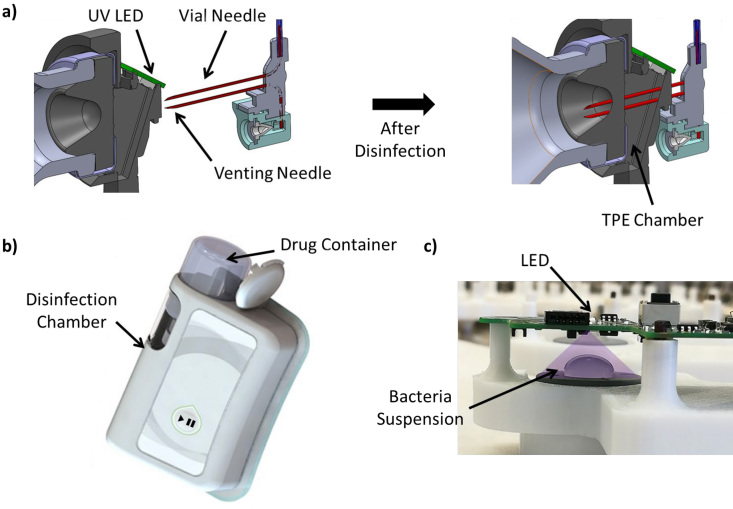
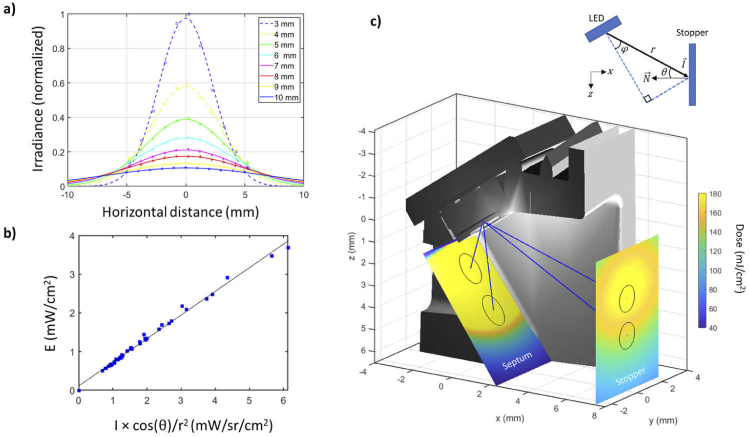
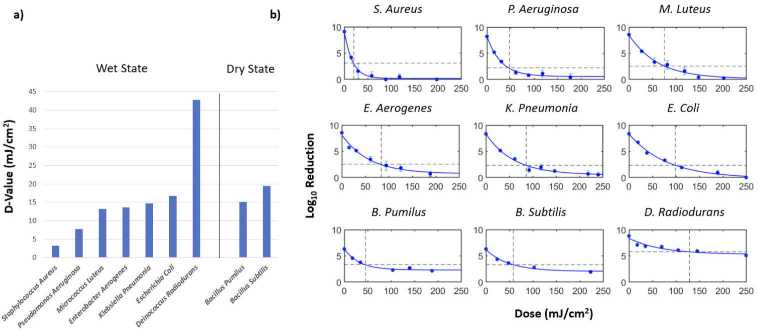
The advent of recombinant DNA technology fundamentally altered the drug discovery landscape, replacing traditional small-molecule drugs with protein and peptide-based biologics. Being susceptible to degradation via the oral route, biologics require comparatively invasive injections, most commonly by intravenous infusion (IV). Significant academic and industrial efforts are underway to replace IV transport with subcutaneous delivery by wearable infusion devices. To further complement the ease-of-use and safety of disposable infusion devices, surface disinfection of the drug container can be automated. For ease of use, the desired injector is a combination device, where the drug is inside the injector as a single solution combination device. The main obstacle of the desired solution is the inability to sterilize both injector and drug in the same chamber or using the same method (Gamma for the drug and ETO for the injector). This leads to the assembly of both drug container and injector after sterilization, resulting in at least one transition area that is not sterilized. To automate the delivery of the drug to the patient, a disinfection step before the drug delivery through the injector is required on the none-sterilized interface. As an innovative solution, the autoinjector presented here is designed with a single ultraviolet light-emitting diode (UV LED) for surface disinfection of the drug container and injector interface. In order to validate microbial disinfection similar to ethanol swabbing on the injector, a bacterial 3 or 6 log reduction needed to be demonstrated. However, the small disinfection chamber surfaces within the device are incapable of holding an initial bacterial load for demonstrating the 3 or 6 log reduction, complicating the validation method, and presenting a dilemma as to how to achieve the log reduction while producing real chamber conditions. The suggested solution in this paper is to establish a correlation model between the UV irradiance distribution within the disinfection chamber and a larger external test setup, which can hold the required bacterial load and represents a worse-case test scenario. Bacterial log reduction was subsequently performed on nine different microorganisms of low to high UV-tolerance. The procedure defined herein can be adopted for other surface or chamber disinfection studies in which the inoculation space is limited.


Conflict of interest statement

The authors have no conflicts of interest to disclose.

Figures

Fig. 1.
Fig. 1.
Wearable infusion device and validation setup. a) computer aided design (CAD) model of the disinfection chamber before and after disinfection, showing the interface between the device and the stopper of the drug container. The vial and venting needles are shown in their positions prior to and after insertion into the drug container via the thermoplastic elastomer (TPE) chamber, which occurs after UV surface disinfection. b) Illustration of the infusion device with the glass drug container partially inserted. The disinfection chamber is situated at the interface of the drug container and pump, hidden behind the outer plastic molding. c) Disinfection validation setup showing the position of the LED, mounted to a printed circuit board (PCB) and test substrate. An illustration of the UV light was superimposed on the captured image.
Fig. 2.
Fig. 2.
UVC LED specifications. a) Relative intensity curve as a function of wavelength, with a peak wavelength of 275 nm, and half width of 11 nm. b) Relative intensity curve as a function of viewing angle. Intensity is reduced by 50% for a half viewing angle ( φ1/2 ) of  62.5 . c) Supplementary electro-optic data. LED efficiency, also described as “wall plug efficiency” (WPE) can be calculated according to the relation of   ηe=Φe(λ)P [28]. The total flux Φe(λ)[mW] at a given wavelength is provided by the manufacturer and equals to 2mW . The electrical P[mW] equals VI hence ηe=1.67% .
Fig. 3.
Fig. 3.
UV irradiance model. a) Raw data measurements of UV irradiance from a single LED positioned 3 to 10 mm normally from the UV sensor and varied from −5 to 5 mm orthogonally along one axis for a total of 11 points at each distance. The data was fitted to Gaussian functions. b) Relationship between measured irradiance and relevant geometric parameters: the distance, r , from the source, and the angle of the incident light with the surface, θ . The plotted points are derived from the Gaussian fittings in the range of 4 to 10 mm. The line of best fit was assessed for N = 48 samples. c) Irradiance distribution on the septum and stopper walls, solved in MATLAB. The CAD model was superimposed on the irradiance model for visualization. The needle insertion sites are indicated by the circles. The coordinate system is shown above the plot.
Fig. 4.
Fig. 4.
Log reduction results. a) Comparison of D-values (dose per log reduction) for all tested microorganisms on the stopper surface. The vegetative species were tested in the wet state, while the spores were tested in the dry state. b) Selected log-reduction graphs showing log reduction versus dose. Each raw data point is an average of three measurements, and the error bar represents one standard deviation. The data was fitted to single exponential functions. The horizontal dashed line represents the required reduction level (either 3 or 6 log), and the required dose at that level is indicated by the intersection with the vertical dashed line. The axis is zoomed in from 0 to 250 mJ/cm2, and in some cases, there are unseen datapoints (following the exponential trend) outside of this window.

Similar articles

References

    1. Kinch M. S., “An overview of FDA-approved biologics medicines,” Drug Discovery Today 20(4), 393–398 (2015).10.1016/j.drudis.2014.09.003 - DOI - PubMed
    1. Anselmo A. C., Gokarn Y., Mitragotri S., “Non-invasive delivery strategies for biologics,” Nat. Rev. Drug Discovery 18(1), 19–40 (2019).10.1038/nrd.2018.183 - DOI - PubMed
    1. Shendure J., Ji H., “Next-generation DNA sequencing,” Nat. Biotechnol. 26(10), 1135–1145 (2008).10.1038/nbt1486 - DOI - PubMed
    1. Alfaro J. A., Bohländer P., Dai M., Filius M., Howard C. J., van Kooten X. F., Ohayon S., Pomorski A., Schmid S., Aksimentiev A., Anslyn E. v., Bedran G., Cao C., Chinappi M., Coyaud E., Dekker C., Dittmar G., Drachman N., Eelkema R., Goodlett D., Hentz S., Kalathiya U., Kelleher N. L., Kelly R. T., Kelman Z., Kim S. H., Kuster B., Rodriguez-Larrea D., Lindsay S., Maglia G., Marcotte E. M., Marino J. P., Masselon C., Mayer M., Samaras P., Sarthak K., Sepiashvili L., Stein D., Wanunu M., Wilhelm M., Yin P., Meller A., Joo C., “The emerging landscape of single-molecule protein sequencing technologies,” Nat. Methods 18(6), 604–617 (2021).10.1038/s41592-021-01143-1 - DOI - PMC - PubMed
    1. Zrehen A., Ohayon S., Huttner D., Meller A., “On-chip protein separation with single-molecule resolution,” Sci. Rep. 10(1), 15313 (2020).10.1038/s41598-020-72463-z - DOI - PMC - PubMed

LinkOut - more resources