

Systematically quantitative proteomics and metabolite profiles offer insight into fruit ripening behavior in Fragaria × ananassa
- PMID: 35519301
- PMCID: PMC9064045
- DOI: 10.1039/c9ra00549h
Systematically quantitative proteomics and metabolite profiles offer insight into fruit ripening behavior in Fragaria × ananassa
Abstract
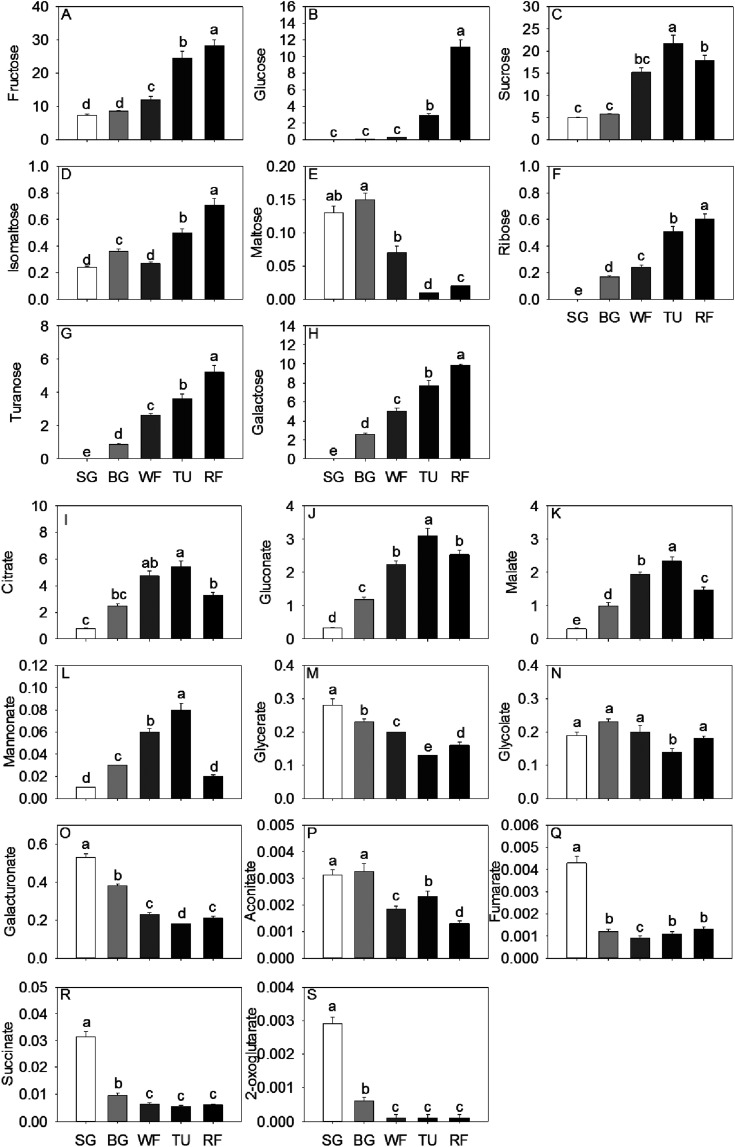
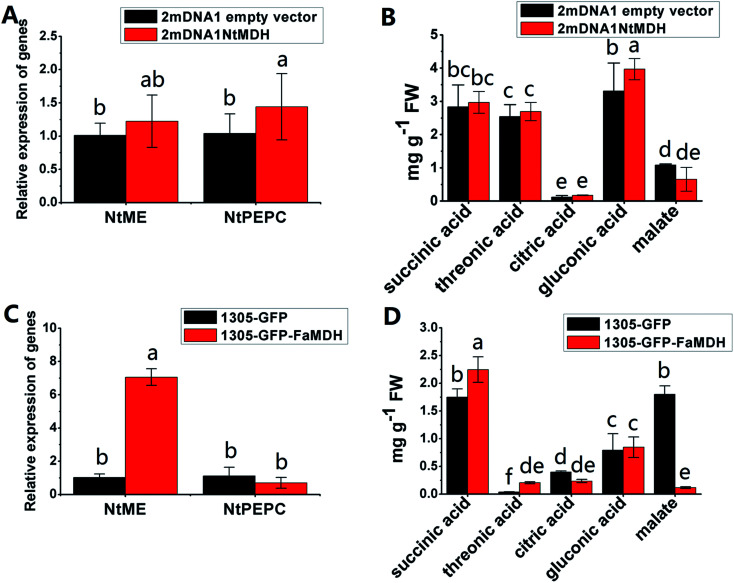
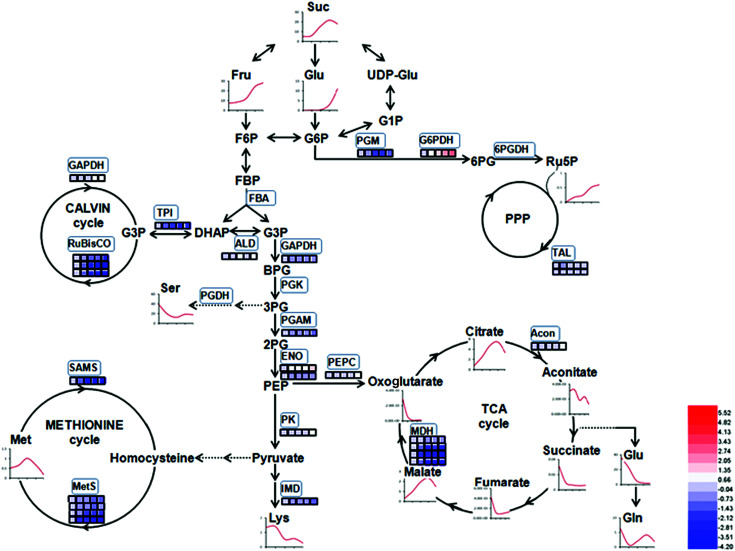
Profound metabolic and proteomic changes involved in the primary and the secondary metabolism are required for the ripeness of fleshy fruit such as strawberries (Fragaria × ananassa). Here we present the quantitative proteomic profiling in parallel with metabolic and transcriptional profiling at five developmental stages of strawberry fruit ripening, and correlations between changes in representative metabolites and the abundance of related proteins were analyzed. Hierarchical clustering analysis of the quantitative proteomic profiling identified 143 proteins in strawberry fruit across five developmental stages. Meanwhile, both protein abundance and gene expression spanned a wide range of roles, such as the primary and the secondary metabolism, defense system, and response to stress stimuli. The decreased abundance of proteins contributed to the carbohydrate metabolism and the up-regulated expression of secondary biosynthetic proteins was found to be positively correlated with the accumulation of primary and secondary metabolites during strawberry development. Moreover, with the same annotations and high homology, the gene function of key genes involved in primary and secondary metabolism (FaTPI, FaPAL, FaMDH and FaME) was confirmed in Nicotiana via the transient expression assay, which provides further evidence for the role of those genes in metabolism of strawberry fruit. The results of the present study may serve as an important resource for the functional analysis of the proteome and offer new perspectives on regulation of fruit quality.
This journal is © The Royal Society of Chemistry.
Conflict of interest statement
There are no conflicts to declare.
Figures


Similar articles
-
Quantitative changes in proteins responsible for flavonoid and anthocyanin biosynthesis in strawberry fruit at different ripening stages: A targeted quantitative proteomic investigation employing multiple reaction monitoring.J Proteomics. 2015 Jun 3;122:1-10. doi: 10.1016/j.jprot.2015.03.017. Epub 2015 Mar 26. J Proteomics. 2015. PMID: 25818726
-
Label-free quantitative proteomics to investigate strawberry fruit proteome changes under controlled atmosphere and low temperature storage.J Proteomics. 2015 Apr 29;120:44-57. doi: 10.1016/j.jprot.2015.02.016. Epub 2015 Mar 7. J Proteomics. 2015. PMID: 25753123
-
Metabolic profiling of strawberry (Fragaria x ananassa Duch.) during fruit development and maturation.J Exp Bot. 2011 Jan;62(3):1103-18. doi: 10.1093/jxb/erq343. Epub 2010 Nov 1. J Exp Bot. 2011. PMID: 21041374
-
Characterization of expansin genes and their transcriptional regulation by histone modifications in strawberry.Planta. 2021 Jul 3;254(2):21. doi: 10.1007/s00425-021-03665-6. Planta. 2021. PMID: 34216276 Review.
-
Secondary Metabolites and Their Role in Strawberry Defense.Plants (Basel). 2023 Sep 12;12(18):3240. doi: 10.3390/plants12183240. Plants (Basel). 2023. PMID: 37765404 Free PMC article. Review.
Cited by
-
Why Consumers Prefer Green Friariello Pepper: Changes in the Protein and Metabolite Profiles Along the Ripening.Front Plant Sci. 2021 Apr 30;12:668562. doi: 10.3389/fpls.2021.668562. eCollection 2021. Front Plant Sci. 2021. PMID: 33995464 Free PMC article.
-
Proteomics and metabolomics analysis reveal potential mechanism of extended-spectrum β-lactamase production in Escherichia coli.RSC Adv. 2020 Jul 17;10(45):26862-26873. doi: 10.1039/d0ra04250a. eCollection 2020 Jul 15. RSC Adv. 2020. PMID: 35515772 Free PMC article.
-
Proteomic mechanism of sugar and organic acid metabolism during Korla fragrant pear (Pyrus sinkiangensis Yü) fruit development.Sci Rep. 2025 Jul 24;15(1):26935. doi: 10.1038/s41598-025-03117-1. Sci Rep. 2025. PMID: 40707577 Free PMC article.
-
Regulation of fruit quality formation in strawberry: from omics to biotechnology.PeerJ. 2025 May 30;13:e19497. doi: 10.7717/peerj.19497. eCollection 2025. PeerJ. 2025. PMID: 40458554 Free PMC article. Review.
-
Transcriptomic Complexity in Strawberry Fruit Development and Maturation Revealed by Nanopore Sequencing.Front Plant Sci. 2022 Jul 13;13:872054. doi: 10.3389/fpls.2022.872054. eCollection 2022. Front Plant Sci. 2022. PMID: 35909727 Free PMC article.
References
-
- Shulaev V. Sargent D. J. Crowhurst R. N. Mockler T. C. Folkerts O. Delcher A. L. Jaiswal P. Mockaitis K. Liston A. Mane S. P. Burns P. Davis T. M. Slovin J. P. Bassil N. Hellens R. P. Evans C. Harkins T. Kodira C. Desany B. Crasta O. R. Jensen R. V. Allan A. C. Michael T. P. Setubal J. C. Celton J.-M. Rees D. J. G. Williams K. P. Holt S. H. Rojas J. J. R. Chatterjee M. Liu B. Silva H. Meisel L. Adato A. Filichkin S. A. Troggio M. Viola R. Ashman T.-L. Wang H. Dharmawardhana P. Elser J. Raja R. Priest H. D. Bryant Jr D. W. Fox S. E. Givan S. A. Wilhelm L. J. Naithani S. Christoffels A. Salama D. Y. Carter J. Girona E. L. Zdepski A. Wang W. Kerstetter R. A. Schwab W. Korban S. S. Davik J. Monfort A. Denoyes-Rothan B. Arus P. Mittler R. Flinn B. Aharoni A. Bennetzen J. L. Salzberg S. L. Dickerman A. W. Velasco R. Borodovsky M. Veilleux R. E. Folta K. M. Nat. Genet. 2010;43:109. doi: 10.1038/ng.740. - DOI - PMC - PubMed
-
- Hirakawa H. Shirasawa K. Kosugi S. Tashiro K. Nakayama S. Yamada M. Kohara M. Watanabe A. Kishida Y. Fujishiro T. Tsuruoka H. Minami C. Sasamoto S. Kato M. Nanri K. Komaki A. Yanagi T. Guoxin Q. Maeda F. Ishikawa M. Kuhara S. Sato S. Tabata S. Isobe S. N. DNA Res. 2014;21:169–181. doi: 10.1093/dnares/dst049. - DOI - PMC - PubMed
LinkOut - more resources
Full Text Sources