

Prebiotic effects of alfalfa (Medicago sativa) fiber on cecal bacterial composition, short-chain fatty acids, and diarrhea incidence in weaning piglets
- PMID: 35519545
- PMCID: PMC9063875
- DOI: 10.1039/c9ra01251f
Prebiotic effects of alfalfa (Medicago sativa) fiber on cecal bacterial composition, short-chain fatty acids, and diarrhea incidence in weaning piglets
Abstract
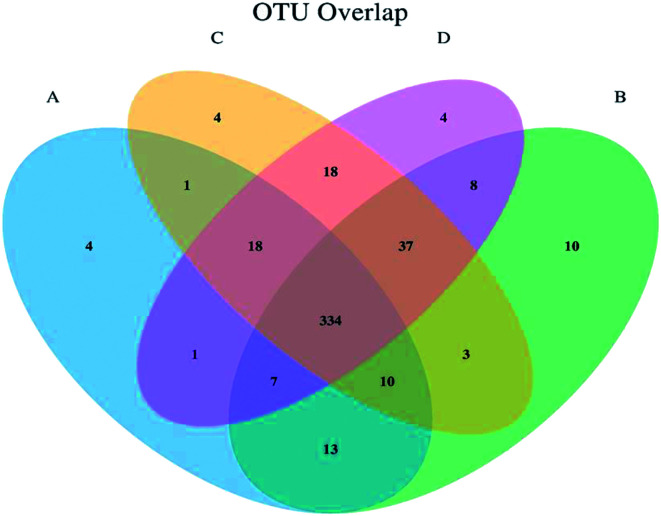
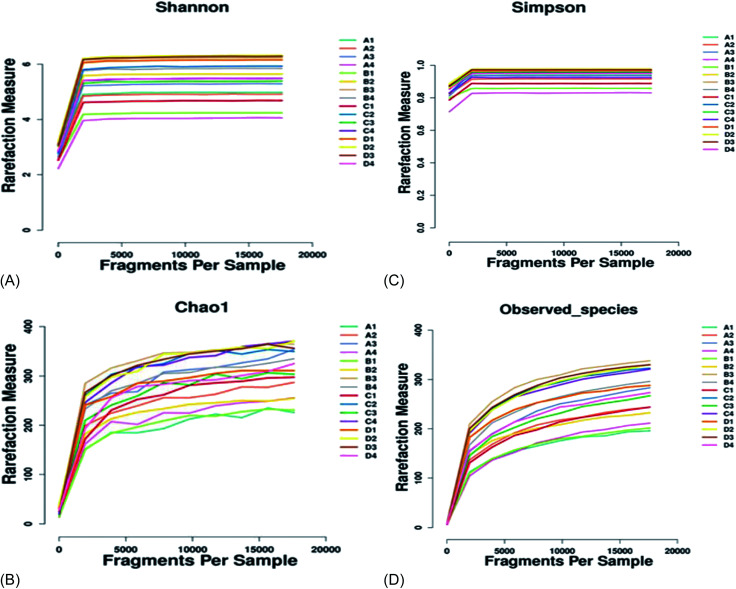
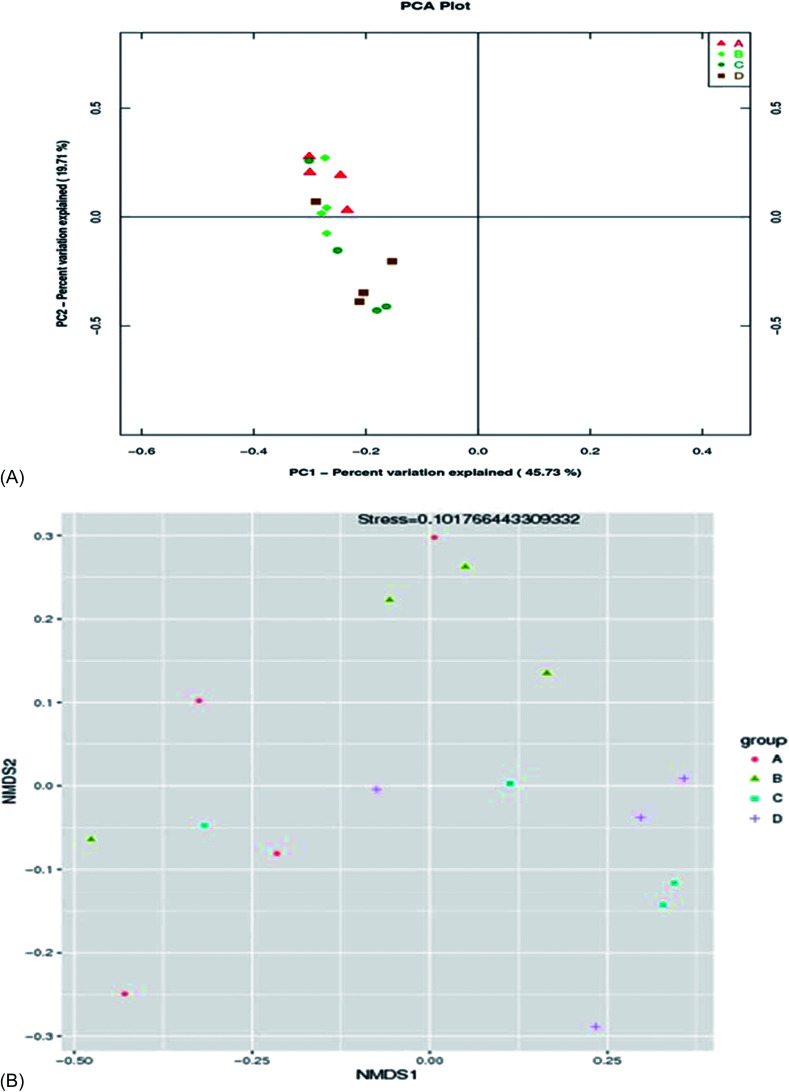
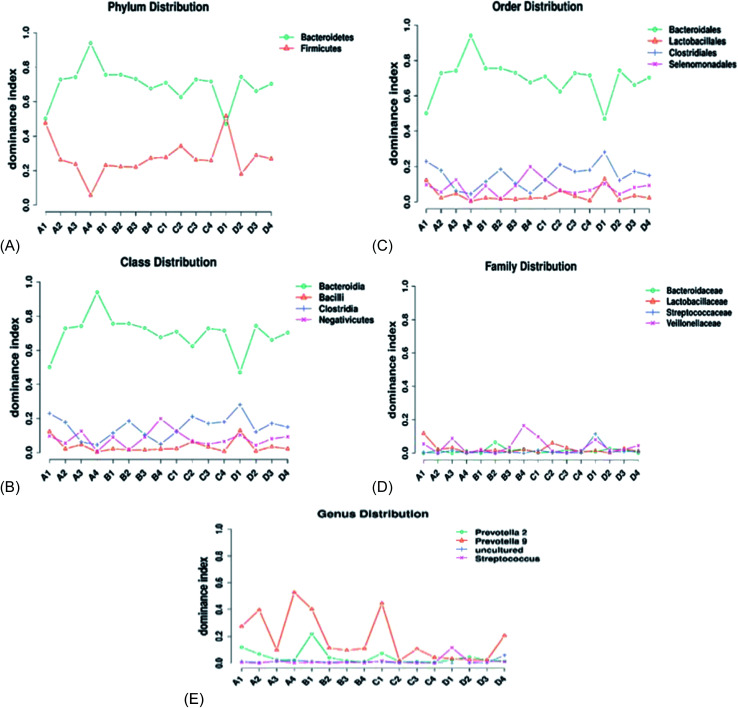
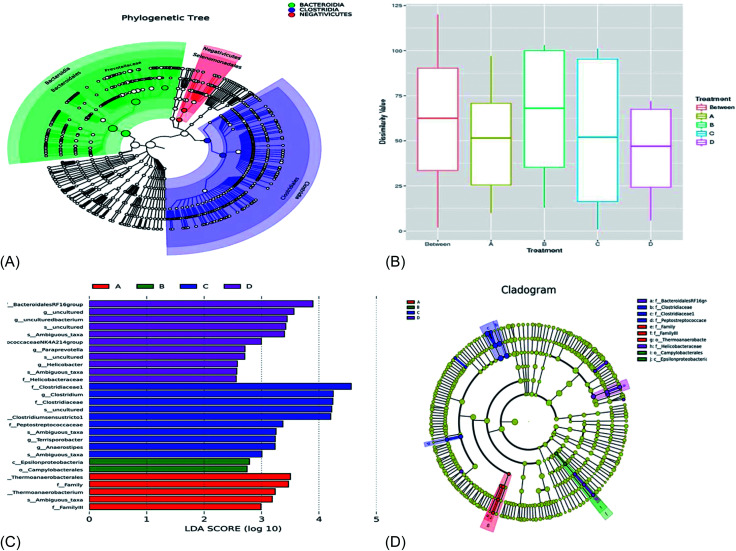
Dietary alfalfa fiber (AF) is conceived to modulate gut microbial richness and diversity to improve the health and growth of weaning piglets. The objective of this study was to evaluate the prebiotic effects of AF on diarrhea incidence, the production of short-chain fatty acids (SCFAs), and microbiota composition in weaning piglets. This study utilized 100 crossbred piglets (Duroc × Landrace × Yorkshire) with a body weight of 8.42 ± 1.88 kg randomly assigned to the following treatments: 0.00% AF meal (A), 6.00% of AF meal (B), 12.00% AF meal (C), and 18.00% AF meal (D). The cecum samples were used to determine microbial community composition and diversity through high-throughput 16S rDNA sequencing. The results of this study show that the lowest average daily gain (ADG) was observed in treatment D, and the highest ADG was recorded in treatment C. However there was no significant difference between the treatment groups and the control. The average daily feed intake (ADFI) was significantly higher in treatment C compared to the other treatments. The feed conversion ratio was high in the control group compared to the AF treated groups. The highest diarrhea incidence was observed in treatment A and the lowest diarrhea incidence was observed in treatment C and D. The highest acetate and propionate levels were observed in treatment B, but there was no significant difference between the treatment groups and the control. The supplementation of AF significantly increased the butyrate level in treatment D compared with treatments A and B but was not significantly different from treatment C. The Observed_species richness and Simpson diversity values of the cecum bacterial composition in the AF fed piglets were higher than the control. In addition, the Chao 1 richness and Shannon diversity increased with an increase in AF supplementation, reaching a plateau at treatment B and C, then decreasing at treatment D. The Bacteroidetes, Firmicutes, Tenericutes, Proteobacteria, Cyanobacteria, Spirochaetae, Actinobacteria, Fibrobacteres, Saccharibacteria, Synergistetes, Chlamydiae, Elusimicrobia, Deferribacteres, Fusobacteria, and others were relatively abundant in all treatments. The Bacteroidetes and Firmicutes were the dominant phyla, accounting for 98% of all reads. AF treatment decreased the Bacteroidetes phylum and increased the Firmicutes phylum compared with treatment A. Therefore, the dietary inclusion of AF may decrease diarrhea incidence, increase cecal bacterial composition and richness, and consequently improve the growth performance of weaning piglets.
This journal is © The Royal Society of Chemistry.
Conflict of interest statement
The authors declare no conflicts of interest.
Figures
Similar articles
-
Dietary fermented soybean meal replacement alleviates diarrhea in weaned piglets challenged with enterotoxigenic Escherichia coli K88 by modulating inflammatory cytokine levels and cecal microbiota composition.BMC Vet Res. 2020 Jul 14;16(1):245. doi: 10.1186/s12917-020-02466-5. BMC Vet Res. 2020. PMID: 32664940 Free PMC article.
-
Effects of Astragalus membranaceus fiber on growth performance, nutrient digestibility, microbial composition, VFA production, gut pH, and immunity of weaned pigs.Microbiologyopen. 2019 May;8(5):e00712. doi: 10.1002/mbo3.712. Epub 2018 Aug 16. Microbiologyopen. 2019. PMID: 30117299 Free PMC article.
-
Effects of pulverized oyster mushroom (Pleurotus ostreatus) on diarrhea incidence, growth performance, immunity, and microbial composition in piglets.J Sci Food Agric. 2019 May;99(7):3616-3627. doi: 10.1002/jsfa.9582. Epub 2019 Mar 4. J Sci Food Agric. 2019. PMID: 30628086 Free PMC article.
-
Response of Gut Microbiota to Dietary Fiber and Metabolic Interaction With SCFAs in Piglets.Front Microbiol. 2018 Sep 28;9:2344. doi: 10.3389/fmicb.2018.02344. eCollection 2018. Front Microbiol. 2018. PMID: 30323803 Free PMC article.
-
Dietary Berberine and Ellagic Acid Supplementation Improve Growth Performance and Intestinal Damage by Regulating the Structural Function of Gut Microbiota and SCFAs in Weaned Piglets.Microorganisms. 2023 May 10;11(5):1254. doi: 10.3390/microorganisms11051254. Microorganisms. 2023. PMID: 37317228 Free PMC article.
Cited by
-
Stimbiotic Supplementation Alleviates Poor Performance and Gut Integrity in Weaned Piglets Induced by Challenge with E. coli.Animals (Basel). 2022 Jul 13;12(14):1799. doi: 10.3390/ani12141799. Animals (Basel). 2022. PMID: 35883346 Free PMC article.
-
Dietary Fiber Ameliorates Lipopolysaccharide-Induced Intestinal Barrier Function Damage in Piglets by Modulation of Intestinal Microbiome.mSystems. 2021 Apr 6;6(2):e01374-20. doi: 10.1128/mSystems.01374-20. mSystems. 2021. PMID: 33824201 Free PMC article.
-
Dietary Fiber-Derived Butyrate Alleviates Piglet Weaning Stress by Modulating the TLR4/MyD88/NF-κB Pathway.Nutrients. 2024 May 30;16(11):1714. doi: 10.3390/nu16111714. Nutrients. 2024. PMID: 38892647 Free PMC article.
-
"King of the forage"-Alfalfa supplementation improves growth, reproductive performance, health condition and meat quality of pigs.Front Vet Sci. 2022 Nov 2;9:1025942. doi: 10.3389/fvets.2022.1025942. eCollection 2022. Front Vet Sci. 2022. PMID: 36406067 Free PMC article. Review.
-
Structural Characteristics of Insoluble Dietary Fiber from Okara with Different Particle Sizes and Their Prebiotic Effects in Rats Fed High-Fat Diet.Foods. 2022 Apr 29;11(9):1298. doi: 10.3390/foods11091298. Foods. 2022. PMID: 35564020 Free PMC article.
References
-
- Adams S. Che D. Qin G. Rui H. Sello C. T. Hailong J. Interactions of Dietary Fibre with Nutritional Components on Gut Microbial Composition, Function and Health in Monogastrics. Curr. Protein Pept. Sci. 2018a;19:1011–1023. - PubMed
LinkOut - more resources
Full Text Sources