. 2022 Apr 29:15:1331-1345.
doi: 10.2147/DMSO.S353717. eCollection 2022.

Glucagon-Like Peptide 1 Receptor Agonist Improves Renal Tubular Damage in Mice with Diabetic Kidney Disease

Affiliations

Glucagon-Like Peptide 1 Receptor Agonist Improves Renal Tubular Damage in Mice with Diabetic Kidney Disease

Ran Li et al. Diabetes Metab Syndr Obes. .

Abstract

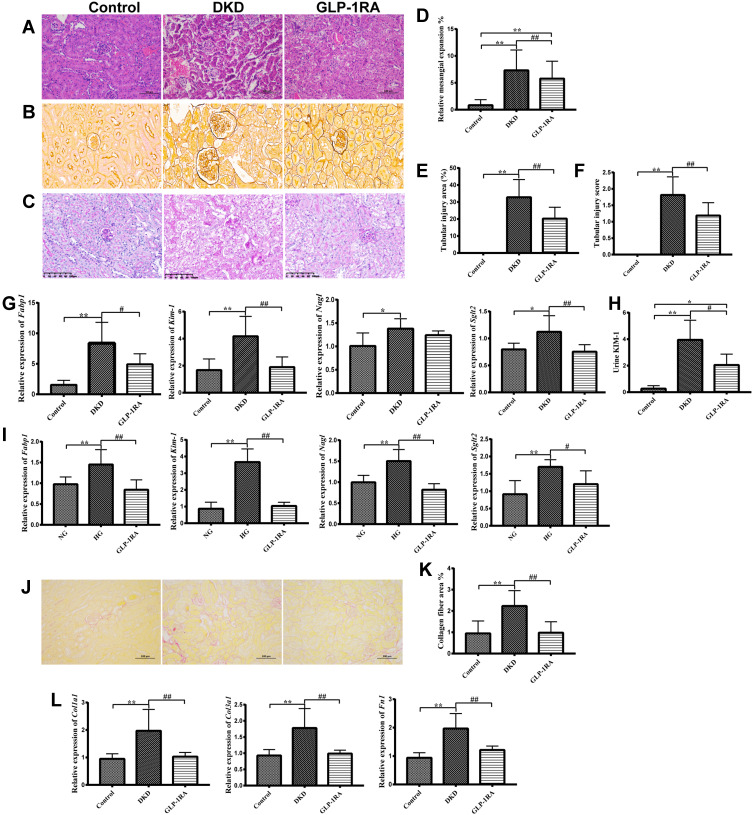
Purpose: This study aims to investigate the renal protective effect of glucagon-like peptide 1 receptor agonist (GLP-1RA) on improving renal tubular damage in diabetic kidney disease (DKD) and to explore the potential mechanism of GLP-1RA on renal tubular protection.

Methods: Long-acting GLP-1RA was used to treat DKD mice for 12 weeks. The label-free quantitative proteomic analysis of renal proteins was conducted to explore the differentially expressed proteins (DEPs) in the renal tissues of the control, DKD and GLP-1RA groups. The DEPs and markers of renal tubular injury were verified by qPCR in vivo and in vitro. The expression of glucagon-likepeptide-1 receptor (GLP-1R) in renal tubules was determined by immunofluorescence staining.

Results: GLP-1RA treatment significantly improved the tubular damages in kidney tissues of DKD mice and mTEC cells stimulated by high glucose (HG). Proteomics analysis revealed that 30 proteins in kidney tissue were differentially expressed among three groups. Seminal vesicle secretory protein 6 (SVS6) was the most differentially expressed protein in kidney tissues among three groups of mice. The expression changes of Svs6 mRNA in vitro and in vivo detected by qPCR were consistent with the results of proteomic analysis. Furthermore, reduction of Svs6 expression by SVS6 siRNA could attenuate HG-stimulated tubular injury in mTEC cells. Immunofluorescence staining also found that GLP-1R was widely expressed in renal tubules in vitro and in vivo.

Conclusion: GLP-1RA significantly improved renal tubular damage in DKD mice. SVS6 may be a potential therapeutic target for GLP-1RA in the treatment of DKD.

Keywords: diabetic kidney disease; glucagon-like peptide-1 receptor agonist; renal tubular injury; seminal vesicle secretory protein 6.


Conflict of interest statement

The authors declare that they have no conflicts of interest for this work.

Figures

Figure 1
Figure 1
GLP-1RA reduces body weight, lowers blood glucose, and improves kidney function. (A) Schematic presentation of the experimental design and protocol. (B) The gross appearance of the kidney among three groups. (C) Body weight, kidney weight and blood glucose of mice among three groups (n = 10). (D) Comparison of body weight and blood glucose of mice among three groups in different periods (n = 10). (E) Scr and BUN of mice among three groups (n = 10). Data are expressed as mean ± SD, *P<0.05, **P<0.01 vs control group; #P<0.05, ##P<0.01 vs DKD group.
Figure 2
Figure 2
GLP-1RA improves renal tubular injury in DKD mice. (A–C) H&E staining (A), PASM staining (B) and PAS staining (C) of kidney sections among three groups (×200) (n=6). (D–F) Relative quantification of the mesangial expansion (D), renal tubular injury area (%) (E) and renal tubular injury score (F) in the kidney among three groups. (G) The mRNA expression of Fabp1, Kim-1, Ngal and Sglt2 in kidney tissues among three groups (n=10). (H) Urine KIM-1 levels among three groups (n=10). (I) The mRNA expression of Fabp1, Kim-1, Ngal and Sglt2 in mTEC cells among three groups (n=10). (J) Sirius Red staining of kidney sections among three groups (×200) (n=3). (K) Collagen fiber area (%) among three groups (n=6). (L) The mRNA expression of Col1a1, Col3a1 and Fn1 in kidney tissues among three groups (n=10). Data are expressed as mean ± SD, *P<0.05, **P<0.01 vs control group; #P<0.05, ##P<0.01 vs DKD group.
Figure 3
Figure 3
Identification of significant differentially expressed proteins (DEPs) in kidney of mice among three groups by LFQ-based proteomic analysis. (A) Venn diagram for overlapping proteins of the kidney among three groups (n=3). (B) Heatmap for the comparison of the DEPs among three groups (n=3). Red represents significantly up-regulated proteins, blue represents significantly down-regulated proteins, and gray represents no protein quantitative information. (C) The protein expression levels of SVS6, CPT2, APOA1, CSTT1, MUP20, and NAMPT in the kidney of mice among three groups were measured by proteomics analysis (n=3). Data are expressed as mean ± SD, *P<0.05, **P<0.01 vs control group; #P<0.05, ##P<0.01 vs DKD group.
Figure 4
Figure 4
Validation of DEPs by qPCR in vivo and in vitro. (A) The mRNA expression of Svs6, Cpt2, Apoa1, Cstt1, Mup20, and Nampt in the kidney of mice among three groups was measured by qPCR (n = 10). (B) The mRNA expression of Svs6, Cpt2, Apoa1, Cstt1, Mup20, and Nampt in mTEC cells among three groups was measured by qPCR (n = 10). (C) The mRNA expression of Svs6 in mTEC cells after transfection with si-SVS6 by qPCR (n=10). (D) The mRNA expression of Kim-1, Ngal and Sglt2 in mTEC cells among NG group, HG group, GLP-1RA group and HG+si-SVS6 group (n=10). Data are expressed as mean ± SD, *P<0.05, **P<0.01 vs control group; #P<0.05, ##P<0.01 vs DKD group or HG group.
Figure 5
Figure 5
GLP-1R is widely expressed in renal tubules of mice and mTEC cells. (A) Immunofluorescence staining of GLP-1R (green) was performed on the kidney sections of mice in the three groups (n = 3) (400×). (B) Immunofluorescence staining of GLP-1R (green) was performed on the mTEC cells (n = 3) (200×). (C) Immunofluorescence staining of GLP-1R (green) was performed on the ovary sections of mice as a negative control (n = 3) (400×).

References

    1. Ali Khan I. Do second generation sequencing techniques identify documented genetic markers for neonatal diabetes mellitus? Heliyon. 2021;7(9):e07903. doi:10.1016/j.heliyon.2021.e07903 - DOI - PMC - PubMed
    1. Shaheen FA, Al-Khader AA. Epidemiology and causes of end stage renal disease (ESRD). Saudi J Kidney Dis Transpl. 2005;16(3):277–281. - PubMed
    1. Zhang XX, Kong J, Yun K. Prevalence of diabetic nephropathy among patients with type 2 diabetes mellitus in china: a meta-analysis of observational studies. J Diabetes Res. 2020;2020:2315607. doi:10.1155/2020/2315607 - DOI - PMC - PubMed
    1. Han J, Pang X, Shi X, Zhang Y, Peng Z, Xing Y. Ginkgo biloba extract EGB761 ameliorates the extracellular matrix accumulation and mesenchymal transformation of renal tubules in diabetic kidney disease by inhibiting endoplasmic reticulum stress. Biomed Res Int. 2021;2021:6657206. doi:10.1155/2021/6657206 - DOI - PMC - PubMed
    1. Haneda M, Utsunomiya K, Koya D, et al. A new classification of diabetic nephropathy 2014: a report from joint committee on diabetic nephropathy. J Diabetes Investig. 2015;6(2):242–246. doi:10.1111/jdi.12319 - DOI - PMC - PubMed

LinkOut - more resources