

Gut microbiota-mediated tributyltin-induced metabolic disorder in rats
- PMID: 35519721
- PMCID: PMC9058259
- DOI: 10.1039/d0ra07502g
Gut microbiota-mediated tributyltin-induced metabolic disorder in rats
Abstract
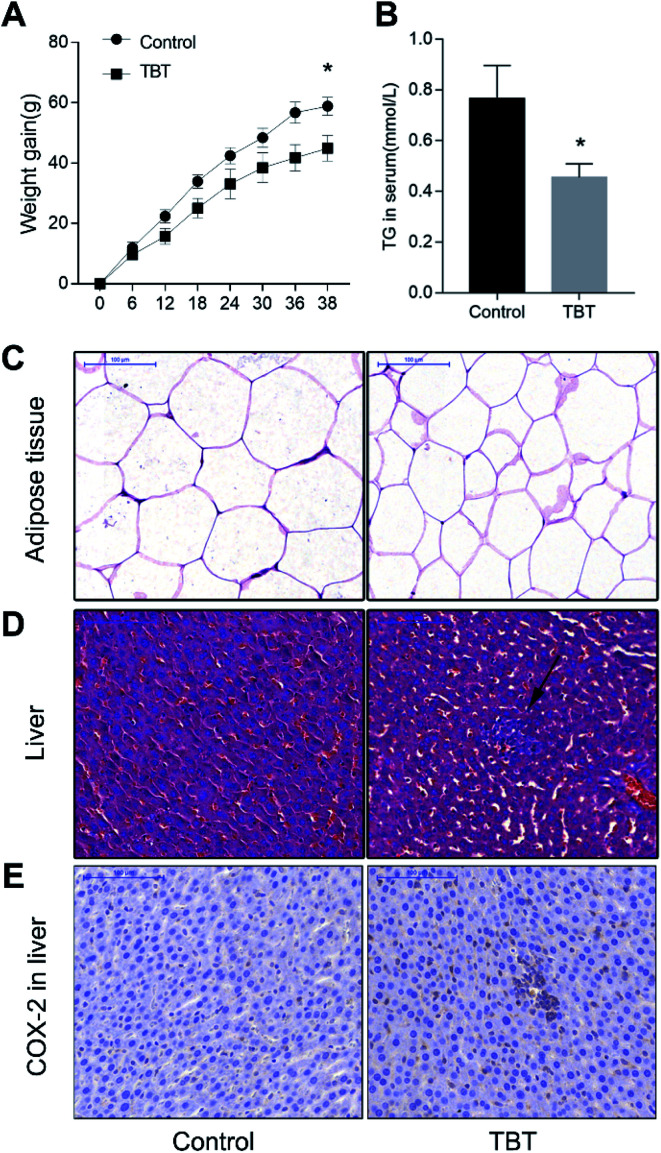
Tributyltin (TBT), an environmental pollutant widely used in antifouling coatings, can cause multiple-organ toxicity and gut microbiome dysbiosis in organisms, and can even cause changes in the host metabolomic profiles. However, little is known about the underlying effects and links of TBT-induced metabolic changes and gut microbiome dysbiosis. In this study, rats were exposed to TBT at a dose of 100 μg kg-1 body weight (BW) for 38 days, followed by multi-omics analysis, including microbiome, metabolomics, and metallomics. Results showed that TBT exposure reduced rat weight gain and decreased the serum triglyceride (TG) level. Metabolic analysis revealed that TBT fluctuated linoleic acid metabolism and glycerophospholipid metabolism in the liver; the tricarboxylic acid cycle (TCA cycle), nicotinate and nicotinamide metabolism, and arachidonic acid metabolism in serum; glycine, serine, and threonine metabolism, the one carbon pool by folate, nicotinate, and nicotinamide metabolism; and tryptophan metabolism in feces. Furthermore, TBT treatment dictated liver inflammation due to enhancing COX-2 expression by activating protein kinase R-like ER kinase (PERK) and C/EBP homologous protein (CHOP) to induce endoplasmic reticulum (ER) stress instead of stimulating arachidonic acid metabolism. Meanwhile, alteration of the intestinal flora [Acetivibrio]_ethanolgignens_group, Acetatifactor, Eisenbergiella, Lachnospiraceae_UCG-010, Enterococcus, Anaerovorax, and Bilophila under TBT exposure were found to be involved in further mediating liver inflammation, causing lipid metabolism abnormalities, such as TG, linoleic acid, and glycerophospholipids, and interfering with the energy supply process. Among these, [Acetivibrio]_ethanolgignens_group, Enterococcus, and Bilophila could be considered as potential biomarkers for TBT exposure based on receiver operator characteristic (ROC) curve analysis.
This journal is © The Royal Society of Chemistry.
Conflict of interest statement
The authors declare that there are no conflicts of interest.
Figures


Similar articles
-
Effects of microplastics (MPs) and tributyltin (TBT) alone and in combination on bile acids and gut microbiota crosstalk in mice.Ecotoxicol Environ Saf. 2021 Sep 1;220:112345. doi: 10.1016/j.ecoenv.2021.112345. Epub 2021 May 18. Ecotoxicol Environ Saf. 2021. PMID: 34020283
-
Exposure to tributyltin induces endoplasmic reticulum stress and the unfolded protein response in zebrafish.Aquat Toxicol. 2013 Oct 15;142-143:221-9. doi: 10.1016/j.aquatox.2013.08.017. Epub 2013 Sep 4. Aquat Toxicol. 2013. PMID: 24055755
-
Gut microbiome alterations induced by tributyltin exposure are associated with increased body weight, impaired glucose and insulin homeostasis and endocrine disruption in mice.Environ Pollut. 2020 Nov;266(Pt 3):115276. doi: 10.1016/j.envpol.2020.115276. Epub 2020 Aug 15. Environ Pollut. 2020. PMID: 32835916
-
Tributyltin and Vascular Dysfunction: The Role of Oxidative Stress.Front Endocrinol (Lausanne). 2018 Jul 12;9:354. doi: 10.3389/fendo.2018.00354. eCollection 2018. Front Endocrinol (Lausanne). 2018. PMID: 30050498 Free PMC article. Review.
-
Gut microbiota and host metabolism in liver cirrhosis.World J Gastroenterol. 2015 Nov 7;21(41):11597-608. doi: 10.3748/wjg.v21.i41.11597. World J Gastroenterol. 2015. PMID: 26556989 Free PMC article. Review.
Cited by
-
The impact of dioctyl phthalate exposure on multiple organ systems and gut microbiota in mice.Heliyon. 2023 Nov 20;9(12):e22677. doi: 10.1016/j.heliyon.2023.e22677. eCollection 2023 Dec. Heliyon. 2023. PMID: 38107267 Free PMC article.
-
A novel Bacillus aerolatus CX253 attenuates inflammation induced by Streptococcus pneumoniae in childhood and pregnant rats by regulating gut microbiome.Cell Mol Life Sci. 2024 Jul 29;81(1):319. doi: 10.1007/s00018-024-05232-0. Cell Mol Life Sci. 2024. PMID: 39078497 Free PMC article.
-
Alteration of Gut Microbes in Benign Prostatic Hyperplasia Model and Finasteride Treatment Model.Int J Mol Sci. 2023 Mar 21;24(6):5904. doi: 10.3390/ijms24065904. Int J Mol Sci. 2023. PMID: 36982979 Free PMC article.
-
Sanguisorba officinalis L. Ameliorates Hepatic Steatosis and Fibrosis by Modulating Oxidative Stress, Fatty Acid Oxidation, and Gut Microbiota in CDAHFD-Induced Mice.Nutrients. 2023 Aug 29;15(17):3779. doi: 10.3390/nu15173779. Nutrients. 2023. PMID: 37686810 Free PMC article.
-
Differences in meat quality between Angus cattle and Xinjiang brown cattle in association with gut microbiota and its lipid metabolism.Front Microbiol. 2022 Dec 6;13:988984. doi: 10.3389/fmicb.2022.988984. eCollection 2022. Front Microbiol. 2022. PMID: 36560955 Free PMC article.
References
LinkOut - more resources
Full Text Sources
Research Materials
Miscellaneous