. 2020 Jul 15;10(44):26566-26578.
doi: 10.1039/d0ra04339g. eCollection 2020 Jul 9.

One-pot HTST synthesis of responsive fluorescent ZnO@apo-enzyme composite microgels for intracellular glucometry

Affiliations

One-pot HTST synthesis of responsive fluorescent ZnO@apo-enzyme composite microgels for intracellular glucometry

Ruyue Lan et al. RSC Adv. .

Abstract

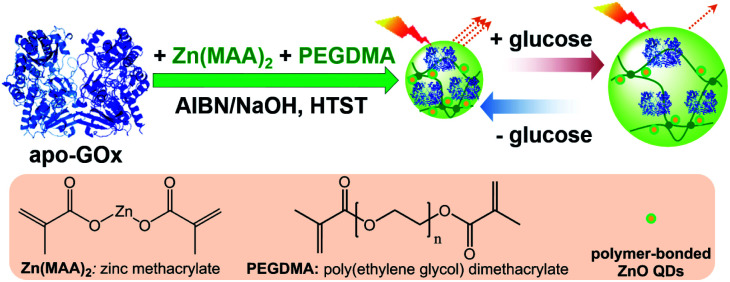
Responsive fluorescent microgels, that can selectively, reversibly, and rapidly convert the fluctuation in intracellular glucose level into fluorescence signal, have the potential use for intracellular glucometry to promote the understanding of physiology. Herein, we report one-pot synthesis of such a responsive fluorescent composite microgels, which is made of a representative apo-enzyme, apo-glucose oxidase (apo-GOx), interpenetrated in a composite gel network that is comprised of ZnO quantum dots covalently bonded onto crosslinked poly(ethylene glycol) dimethacrylate. The key of this one-pot synthesis is applying a high-temperature short-time heating (HTST) method, so that the naturally dynamic profile of apo-GOx can be maintained and harnessed on the composite microgels to allow the highly selective response to glucose over a glucose concentration range of 0-20 mM. While the composite microgels can undergo volume phase transitions and convert both an increase and a decrease in glucose concentration into fluorescence signal shortly (<1 s), the changes in average hydrodynamic diameter and fluorescence of the composite microgels can be fully reversible even after twenty cycles of adding/removing glucose, indicating a reversible and rapid time response to the glucose concentration variations. With the composite microgels as biosensors, the fluorescence of the composite microgels embedded in the model cancer cells B16F10 can be modulated in response to intracellular glucose level variations, which are derived from a change in glucose concentration in the culture medium by an external supply, or that can be triggered by biochemical reactions (with the β-galactosidase catalysed hydrolysis of lactose as a model reaction for achieving increased glucose levels, and the GOx catalysed oxidation of glucose for achieving decreased glucose levels).


Conflict of interest statement

There are no conflicts to declare.

Figures

Scheme 1
Scheme 1. Illustration for the synthesis of the ZnO@apo-enzyme composite microgels.
Fig. 1
Fig. 1. (a) Kinetic curves of formation of the composite microgels, measured from DLS intensity (■) and size distribution (○) studies. Solid line: 1st-order kinetic fit on time-domain DLS intensity. The sampling was done by using a step-motor-driven loop that connected the reactor with the DLS testing cell. (b) DLS size distributions of ZnO@apo-enzyme composite microgels before (■) and after 3 days' dialysis (●) and 3 months' storage at room temperature (▲). DLS measurements were made at 37.0 °C.
Fig. 2
Fig. 2. Typical TEM images of ZnO@apo-enzyme composite microgels.
Fig. 3
Fig. 3. Typical (a) UV-vis and (b) IR spectra of ZnO@apo-enzyme composite microgels. The results for GOx and apo-GOx are also shown for comparison.
Fig. 4
Fig. 4. Typical (a) DLS intensity autocorrelation functions (C(τ)) and (b) size distribution for ZnO@apo-enzyme composite microgels dispersed in the solutions with glucose concentrations [Glu] = 0.0 (■, □), 5.0 (●, ○), and 20.0 mM (▲, △). Closed and open symbols denote the size distribution before and after twenty cycles of adding/removing glucose, respectively. (c) Swelling and recovery cycles upon the repeated addition (20.0 mM) and dialysis removal of glucose (0.0 mM) in the dispersion medium of the microgels. (d) Glucose-dependent 〈Dh〉 values during the adding (■) and the removing (○) glucose cycles, respectively. All measurements were made in 5.0 mM PBS of pH = 7.4 at 37.0 °C.
Fig. 5
Fig. 5. (a) Saccharide-dependent 〈Dh〉 values of ZnO@apo-enzyme composite microgels dispersed in PBS with fructose (■), mannose (●), or galactose (▲). (b–d) Glucose-dependent 〈Dh〉 values of the composite microgels in PBS in the presence of (b) 20.0 mM, (c) 10.0 mM, and (d) 5.0 mM of fructose (■), mannose (●), or galactose (▲). Glucose-dependent 〈Dh〉 values in the absence of the non-glucose monosaccharides (□) are given for comparison. All measurements were made in 5.0 mM PBS of pH = 7.4 at 37.0 °C.
Fig. 6
Fig. 6. (a) Isothermal adsorption curves for dextran (Mr ∼ 6000) (■), dextran (Mr ∼ 40 000) (●), dextran (Mr ∼ 100 000) (▲), RNase B (▼) and HSA (♦) adsorbed on the ZnO@apo-enzyme composite microgels. (b) Glucose-dependent 〈Dh〉 values of the composite microgels in the presence of absorbed dextran (Mr ∼ 6000) (■), dextran (Mr ∼ 40 000) (●), dextran (Mr ∼ 100 000) (▲), RNase B (▼) and HSA (♦). The results in the absence of those non-glucose constituents (□) are given for comparison. All measurements were made in 5.0 mM PBS of pH = 7.4 at 37.0 °C.
Fig. 7
Fig. 7. [Glu]-dependent (a) PL spectra, (b) intensity I at 546 nm, and (c) the emission maximum position λ of ZnO@apo-enzyme composite microgels. (d) I and λ values upon adding/removing 20.0 mM glucose. All measurements were made in 5.0 mM PBS of pH = 7.4 at 37.0 °C, and excited at 405 nm.
Fig. 8
Fig. 8. (a) Kinetics of ZnO@apo-enzyme composite microgels at increasing (from 0.0 to 20.0 mM; ■) and decreasing (from 20.0 to approach 0.0 mM; ●) glucose concentration. Solid lines: theoretical fits with a single-exponential function. (b) The effect of the concentration of the composite microgels on the characteristic response time τsensing correspondingly. All measurements were made in 5.0 mM PBS of pH = 7.4 at 37.0 °C.
Fig. 9
Fig. 9. (a) Scanning confocal fluorescence (left), transmission (centre), and overlaid images (right) of B16F10 cells incubated with ZnO@apo-enzyme composite microgels (10.0 μg mL−1). (b) Response curves in terms of changes in the PL intensity Icell of the composite microgels at increasing (from 0.0 to 20.0 mM in the culture medium) and decreasing (to approach 0.0 mM in the culture medium) glucose concentration, with WZB117 (□) or no WZB117 (○) being added at 30 min. The data was acquired at an interval of 20 s. (c) [Glu]-dependent PL intensity Icell (at 546 nm; ■) and emission maximum position λ (●). The total PL properties of a single cell (n = 5, mean ± s.d.) was adopted as the glucose-dependent parameter by the composite microgels embedded in the cells at 37.0 °C, and excited at 405 nm.
Fig. 10
Fig. 10. (a) A comparison of glucose level in cells [Glu]cell with that in culture medium [Glu]ex, where the [Glu]cell was measured with ZnO@apo-enzyme composite microgels by using the change in emission maximum position. (b) Calibrated response curve for the PL intensity change, where Icell is the PL intensity measured with the composite microgels embedded in cells.
Scheme 2
Scheme 2. The model external biochemical reactions for inducing increasing or decreasing glucose levels.
Fig. 11
Fig. 11. (a and c) Time-domain PL intensity Icell of ZnO@apo-enzyme composite microgels embedded in cells (■; n = 5, mean ± s.d.) and the corresponding intracellular glucose level [Glu]cell (○), upon the addition of (a) lactose and β-galactosidase, or (c) glucose and GOx, to the culture medium. (b and d) Time-dependent conversion showing the reaction kinetics of (b) β-galactosidase catalysed hydrolysis reaction of lactose, and (d) GOx catalysed oxidation reaction of glucose. Solid lines: 1st-order kinetic fits.

Similar articles

Cited by

References

    1. Zhang G. Z. Niu A. Z. Peng S. F. Jiang M. Tu Y. F. Li M. Wu C. Acc. Chem. Res. 2001;34:249. doi: 10.1021/ar000011x. - DOI - PubMed
    1. Lyon L. A. Meng Z. Singh N. Sorrell C. D. John A. S. Chem. Soc. Rev. 2009;38:865. doi: 10.1039/B715522K. - DOI - PubMed
    1. Stuart M. A. C. Huck W. T. S. Genzer J. Müller M. Ober C. Stamm M. Sukhorukov G. B. Szleifer I. Tsukruk V. V. Urban M. Winnik F. Zauscher S. Luzinov I. Minko S. Nat. Mater. 2010;9:101. doi: 10.1038/nmat2614. - DOI - PubMed
    1. He X. M. Aizenberg M. Kuksenok O. Zarzar L. D. Shastri A. Balazs A. C. Aizenberg J. Nature. 2012;487:214. doi: 10.1038/nature11223. - DOI - PubMed
    1. Hu J. M. Zhang G. Q. Liu S. Y. Chem. Soc. Rev. 2012;41:5933. doi: 10.1039/C2CS35103J. - DOI - PubMed