. 2022 Apr 19:13:873688.
doi: 10.3389/fpls.2022.873688. eCollection 2022.

A Non-redundant Function of MNS5: A Class I α-1, 2 Mannosidase, in the Regulation of Endoplasmic Reticulum-Associated Degradation of Misfolded Glycoproteins

Affiliations

A Non-redundant Function of MNS5: A Class I α-1, 2 Mannosidase, in the Regulation of Endoplasmic Reticulum-Associated Degradation of Misfolded Glycoproteins

Xiaoxia Sun et al. Front Plant Sci. .

Abstract

Endoplasmic Reticulum-Associated Degradation (ERAD) is one of the major processes in maintaining protein homeostasis. Class I α-mannosidases MNS4 and MNS5 are involved in the degradation of misfolded variants of the heavily glycosylated proteins, playing an important role for glycan-dependent ERAD in planta. MNS4 and MNS5 reportedly have functional redundancy, meaning that only the loss of both MNS4 and MNS5 shows phenotypes. However, MNS4 is a membrane-associated protein while MNS5 is a soluble protein, and both can localize to the endoplasmic reticulum (ER). Furthermore, MNS4 and MNS5 differentially demannosylate the glycoprotein substrates. Importantly, we found that their gene expression patterns are complemented rather than overlapped. This raises the question of whether they indeed work redundantly, warranting a further investigation. Here, we conducted an exhaustive genetic screen for a suppressor of the bri1-5, a brassinosteroid (BR) receptor mutant with its receptor downregulated by ERAD, and isolated sbi3, a suppressor of bri1-5 mutant named after sbi1 (suppressor of bri1). After genetic mapping together with whole-genome re-sequencing, we identified a point mutation G343E in AT1G27520 (MNS5) in sbi3. Genetic complementation experiments confirmed that sbi3 was a loss-of-function allele of MNS5. In addition, sbi3 suppressed the dwarf phenotype of bri1-235 in the proteasome-independent ERAD pathway and bri1-9 in the proteasome-dependent ERAD pathway. Importantly, sbi3 could only affect BRI1/bri1 with kinase activities such that it restored BR-sensitivities of bri1-5, bri1-9, and bri1-235 but not null bri1. Furthermore, sbi3 was less tolerant to tunicamycin and salt than the wild-type plants. Thus, our study uncovers a non-redundant function of MNS5 in the regulation of ERAD as well as plant growth and ER stress response, highlighting a need of the traditional forward genetic approach to complement the T-DNA or CRISPR-Cas9 systems on gene functional study.

Keywords: BRI1; ERAD; MNS4; MNS5; SBI3.


Conflict of interest statement

The authors declare that the research was conducted in the absence of any commercial or financial relationships that could be construed as a potential conflict of interest.

Figures
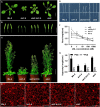
FIGURE 1
FIGURE 1
sbi3 mutation partly suppresses bri1-5 dwarfism. (A) Phenotypes of 2-week-old soil-grown seedlings of Ws-2, bri1-5, sbi3 bri1-5, and sbi3. Scale bar, 1 cm. (B) 2-month-old siliques of Ws-2, bri1-5, sbi3 bri1-5, and sbi3. Scale bar, 1 cm. (C) 2-month-old mature plants of Ws-2, bri1-5, sbi3 bri1-5, and sbi3. Scale bar, 3 cm. (D) Hypocotyl comparison of 5-day-old dark-grown seedlings of Ws-2, bri1-5, sbi3 bri1-5, and sbi3. Scale bar, 1.5 cm. (E) The morphology of cotyledon pavement cells of 7-day-old seedlings from Ws-2, bri1-5, sbi3 bri1-5, and sbi3. Cotyledons were stained by propidium iodide (PI). Scale bar, 100 μm. (F) Root growth phenotypes of 8-day-old Ws-2, bri1-5, sbi3 bri1-5, and sbi3 seedlings grown in 1/2 MS medium with different 24-epibrassinolide (24-eBL) concentrations at 22°C under long-day (16/8-h light/dark) condition. Quantitative analysis of root length plotted as the line graph and displayed in panel (F), n ≥ 30 seedlings. Error bar represents ± SD, three independent assays. (G) Hypocotyl growth phenotype of 5-day-old Ws-2, bri1-5, sbi3 bri1-5, and sbi3 seedlings grown in 1/2 MS medium treated with or without 5 μM PCZ in the dark. Quantitative analysis of hypocotyl length of 5-day-old dark-grown seedlings plotted as histograms displayed in panel (G), n ≥ 30 seedlings. ***P < 0.001 as two-way ANOVA with Sidak’s multiple comparisons test.
FIGURE 2
FIGURE 2
A mutant sbi3 weakly suppresses bri1-235 phenotypes. (A) Phenotypes of two-week-old soil-grown seedlings of Col-0, bri1-235, and sbi3 bri1-235. Scale bar, 1 cm. (B) Phenotypes of 2-month-old mature plants of Col-0, bri1-235, and sbi3 bri1-235. Scale bar, 3 cm. (C) Hypocotyl comparison of 5-day-old dark-grown seedlings of Col-0, bri1-235, and sbi3 bri1-235. Scale bar, 1.5 cm. (D) Morphology of cotyledon pavement cells of 7-day-old seedlings from Col-0, bri1-235, sbi3 bri1-235. Scale bar, 100 μm. (E) The 24-eBL-induced root inhibition assay. Quantitative measurements analysis of root length of 8-day-old Col-0, bri1-235, and sbi3 bri1-235 seedlings were plotted as the line graph and displayed in panel (E), n ≥ 30 seedlings. Error bar represents ± standard deviation (SD), three independent assays were performed with similar results. (F) Measurements of hypocotyl length of 5-day-old dark-grown in 1/2 MS medium treated with or without 5 μM PCZ seedlings were plotted as a histogram. ***P < 0.001. (G) Immunoblot analysis of BRI1 abundance in 2-week-old seedlings incubated with or without Kif for 24 h in liquid half-strength MS medium. The protein abundance of BRI1-235 was increased by treatment with Kif. (H) Immunoblot analysis of BRI1 proteins in 2-week-old seedlings of Col-0, bri1-235, and bri1-9 supplemented with or without MG132 for 24 h in liquid half-strength MS medium.
FIGURE 3
FIGURE 3
The molecular cloning of sbi3. (A) Schematic presentation of the mutation site in sbi3. (B) Sequence alignment of a small part of the SBI3 protein among different species. G residue at the 343rd position was highly conserved. (C) Three weeks-soil-grown plants of bri1-5, sbi3 bri1-5, three SBI3-complemented sbi3 bri1-9 transgenic lines carrying an SBI3 transgene driven by the 35S promoter, and three independent sbi3 overexpression transgenic lines on sbi3bri1-5 mutants served as control. Scale bar, 1 cm. (D) Protein expression levels of bri1-5, sbi3 bri1-5, and the corresponding transgenic plants with GFP tag shown in panel (C) were detected with anti-GFP antibody. Tubulin served as the loading control.
FIGURE 4
FIGURE 4
sbi3 mutation inhibits the Endoplasmic Reticulum-Associated Degradation (ERAD) of bri1-5 and bri1-235 through a posttranscriptional mechanism. (A) The expression abundance of transcripts for BR receptor BRI1 in Ws-2, bri1-5, sbi3 bri1-5, and sbi3 seedlings was detected by semi-quantitative RT-PCR. The transcripts of BRI1/bri1 in the wildtype (WT) or the mutant were similar. Actin2 was used as an internal control. N = 3 biological replicates. (B) Western blot analysis of BRI1 protein abundance in Ws-2, bri1-5, sbi3 bri1-5, and sbi3. Extracts were prepared from 14-day-old seedlings grown in 1/2 MS medium. Specific antibodies: Anti-BRI1, Anti-Tubulin (control). (C) Immunoblot analysis of BRI1 protein abundance in Col-0, bri1-235, and sbi3 bri1-235. Specific antibodies: Anti-BRI1; Anti-Tubulin (control). (D) Immunoblot analysis of BRI-5 stability in sbi3 bri1-5 with the anti-BRI1 antibody. Two-week-old seedlings were treated with 180 μM CHX for indicated incubation times. (E) Immunoblot analysis of BRI1-235 stability in sbi3 bri1-235 with the anti-BRI1 antibody. Two-week-old seedlings were treated with 180 μM CHX for indicated incubation times. (F) Endoglycosidase H (EndoH) analysis of Ws-2, bri1-5, sbi3 bri1-5, sbi3. BRI1ER is the ER-localized proteins form, while BRI1PM denotes the localization of BRI1 proteins in the plasma membrane. (G) EndoH analysis of Col-0, bri1-235, and sbi3 bri1-235. (H) Immunoblotting of eBL induced dephosphorylation of sbi3, Ws-2, bri1-5, and sbi3 bri1-5. Rubisco served as a loading control.
FIGURE 5
FIGURE 5
The double mutants of other backgrounds. (A) Phenotypes of bri1-301, bri1-119, bri1-116 and their corresponding double mutants with sbi3 grown in soil for 3 weeks. Scale bar, 1 cm. (B) Comparison of rosette width of 3-week-old plants measured using the ImageJ software. Error bar represents ± standard deviation (SD), n ≥ 10. ***P < 0.001 as two-way ANOVA with Tukey’s multiple comparisons test. (C) Western blotting analysis of BRI1 protein abundance in Col-0, bri1-301, sbi3 bri1-301, bri1-119, and sbi3 bri1-119. (D) Phenotypic comparison of det2-1, cpd, bin2-1 and their corresponding double mutants with sbi3 grown in soil for 3 weeks. Scale bar, 1 cm. (E) The width of rosette leaves of 3-week-old plants were measured using the ImageJ software. Error bar represents ± standard deviation (SD), n ≥ 10. ****P < 0.0001 as one-way ANOVA with Tukey’s multiple comparisons test.
FIGURE 6
FIGURE 6
sbi3 exists UPR and is less tolerant to TM and salt. (A) Reverse transcription PCR (RT-PCR) analysis of PDI5 in Col-0, bri1-235, and sbi3 bri1-235, UBQ5 served as a control. (B) Comparison of 7-day-old seedlings of wild type and sbi3 mutant grown in ½ MS with or without 0.3 μg/mL TM. Scale bar = 1 cm. (C) Expression levels of MNS5, MNS4, PDI5, and BIP3 in Ws-2 and sbi3 with or without 5 μg/mL TM for 6 h. UBQ5 served as a control. (D) The photograph of 12-day-old seedlings grown in ½ MS with or without 120 mM NaCl. Scale bar = 1.5 cm. (E) The ratio of the seedlings was shown in the bar graphs, alive (black), dying (light gray), dead (dark gray). These experiments were repeated three times.
FIGURE 7
FIGURE 7
The expression levels of MNS5 and MNS4 in different developmental stages. (A) The transcripts of MNS4 and MNS5 were performed using RT-PCR analysis in WT Ws-2. UBQ5 was a control. 1: 2-weeks-old seedlings, 2: 50-day-old rosette leaves, 3: 50-day-old flowers, 4: 50-day-old siliques, 5: 68-day-old rosette leaves. (B) The transcripts comparison of MNS1-MNS5 was plotted as a line graph during the 10 developmental stages from dataset AT_AFFY_ATH1-0 (https://www.genevestigator.com/gv/plant.jsp). The 10 developmental stages: Germinated, young seedling, rosette, developed rosette, bolting and young, flower, developed flower, flowers, and siliques, mature siliques, senescence.

Similar articles

Cited by

References

    1. Abe A., Kosugi S., Yoshida K., Natsume S., Takagi H., Kanzaki H., et al. (2012). Genome sequencing reveals agronomically important loci in rice using MutMap. Nat. Biotechnol. 30 174–178. 10.1038/nbt.2095 - DOI - PubMed
    1. Aebi M. (2013). N-linked protein glycosylation in the ER. Biochim. Biophys. Acta 1833 2430–2437. 10.1016/j.bbamcr.2013.04.001 - DOI - PubMed
    1. Balchin D., Hayer-Hartl M., Hartl F. U. (2016). In vivo aspects of protein folding and quality control. Science 353:aac4354. 10.1126/science.aac4354 - DOI - PubMed
    1. Baldridge R. D., Rapoport T. A. (2016). Autoubiquitination of the Hrd1 Ligase Triggers Protein Retrotranslocation in ERAD. Cell 166 394–407. 10.1016/j.cell.2016.05.048 - DOI - PMC - PubMed
    1. Braun N., Wyrzykowska J., Muller P., David K., Couch D., Perrot-Rechenmann C., et al. (2008). Conditional repression of AUXIN BINDING PROTEIN1 reveals that it coordinates cell division and cell expansion during postembryonic shoot development in Arabidopsis and tobacco. Plant Cell 20 2746–2762. 10.1105/tpc.108.059048 - DOI - PMC - PubMed

LinkOut - more resources