. 2022 Apr 18:13:858433.
doi: 10.3389/fpls.2022.858433. eCollection 2022.

Mild-Intensity UV-A Radiation Applied Over a Long Duration Can Improve the Growth and Phenolic Contents of Sweet Basil

Affiliations

Mild-Intensity UV-A Radiation Applied Over a Long Duration Can Improve the Growth and Phenolic Contents of Sweet Basil

Seonghwan Kang et al. Front Plant Sci. .

Abstract

UV-A radiation (320-400 nm) is an abiotic stressor that may be used to enhance the production of beneficial secondary metabolites in crops such as leafy vegetables. However, tradeoffs between enhanced phytochemical contents and overall growth/yield reductions have been reported. The responses varied depending on the UV-A intensity, spectral peak, exposure time, species, and varieties. We quantified the changes in growth, morphology, photosynthesis, and phenolic contents of sweet basil grown under a base red/blue/green LED light with four supplemental UV-A intensity treatments (0, 10, 20, and 30 W·m-2) in an indoor environment over 14 days. The objective was to determine whether UV-A radiation could be utilized to improve both yield and quality of high-value sweet basil in a controlled production environment. Biomass harvested at 14 days after treatment (DAT) was highest under mild-intensity UV-A treatment of 10 W·m-2 and lowest under high-intensity UV-A treatment of 30 W·m-2. The total leaf area and the number of leaves were significantly lower under the 30 W·m-2 treatment than under the 10 and 20 W·m-2 treatments at 14 DAT. The maximum quantum efficiency of photosystem II (PSII) for photochemistry (Fv/Fm ) showed a gradual decrease under the 20 and 30 W·m-2 treatments from 3 to 14 DAT, whereas Fv/Fm remained relatively constant under the 0 and 10 W·m-2 treatments over the entire 14 days. The leaf net photosynthesis rate showed a significant decrease of 17.4% in the 30 W·m-2 treatment compared to that in the 10 W·m-2 treatment at 14 DAT. Phenolic contents (PAL enzyme activity, total phenolic concentration, and antioxidant capacity) were the highest under the 20 W·m-2 treatment, followed by the 10, 30, and 0 W·m-2 treatments. Overall, our results indicate that the biomass production and accumulation of beneficial phenolic compounds in sweet basil varied depending on the intensity and duration of UV-A application. Mild UV-A radiation (10-20 W·m-2) can be a beneficial stressor to improve sweet basil yield and quality over relatively long-term cultivation.

Keywords: Ocimum basilicum; UV-A; antioxidant capacity; biomass; controlled environment agriculture; phenolic contents.


Conflict of interest statement

The authors declare that the research was conducted in the absence of any commercial or financial relationships that could be construed as a potential conflict of interest.

Figures

Figure 1
Figure 1
Spectral distribution of four UV-A light intensity treatments (0 W·m−2, 10 W·m−2, 20 W·m−2, and 30 W·m−2, peak at 385 nm) with RGB LEDs (red, green, and blue peaks at 664, 524, and 451 nm, respectively).
Figure 2
Figure 2
Shoot fresh weight (A) and shoot dry weight (B) of Ocimum basilicum under different UV-A light intensities on various days after treatment (0, 10, 20, and 30 W·m−2; peak at 385 nm) with RGB LEDs (red, green, and blue peaks at 664, 524, and 451 nm, respectively). Data points represent mean ± SE (n = 8; 2 plants per treatment × 4 replications). Different letters indicate a significant UV-A treatment difference at p < 0.05 after Tukey’s HSD test. p-values of the three-way ANOVA analysis for the UV-A treatments (TRT), time effect (days after treatment; DAT), and the interactive effects between UV-A treatments and time (DAT*TRT) are shown in the figures.
Figure 3
Figure 3
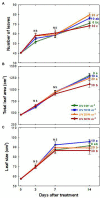
Number of leaves (A), total leaf area (B), and leaf size (C) of Ocimum basilicum according to different UV-A light intensities (0, 10, 20, and 30 W·m−2; peak at 385 nm) with RGB LEDs (red, green, and blue peaks at 664, 524, and 451 nm, respectively). Data points represent mean ± SE (n = 8; 2 plants per treatment × 4 replications). Different letters indicate a significant difference at p < 0.05 after Tukey’s HSD test.
Figure 4
Figure 4
Net photosynthetic rate (A), stomatal conductance (B), water-use efficiency (C), and maximum quantum efficiency of PSII (Fv/Fm) (D) of Ocimum basilicum according to different UV-A light intensities (0, 10, 20, and 30 W·m−2; peak at 385 nm) with RGB LEDs (red, green, and blue peaks at 664, 524, and 451 nm, respectively) as days after treatment. Data points represent mean ± SE (n = 8; 2 plants per treatment × 4 replications). Different letters indicate a significant UV-A treatment difference at p < 0.05 after Tukey’s HSD test. p-values of the three-way ANOVA analysis for the UV-A treatments (TRT), time effect (days after treatment; DAT), and the interactive effects between UV-A treatments and time (DAT*TRT) are shown in the figures.
Figure 5
Figure 5
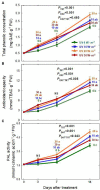
Total phenolic concentration (A), Antioxidant capacity (B), and PAL enzyme activity (C) of Ocimum basilicum according to different UV-A light intensities at days after treatment (0, 10, 20, and 30 W·m−2; peak at 385 nm) with RGB LEDs (red, green, and blue peaks at 664, 524, and 451 nm, respectively). Data points represent mean ± SE (n = 8; 2 plants per treatment × 4 replications). Different letters indicate a significant UV-A treatment difference at p < 0.05 after Tukey’s HSD test. p-values of the three-way ANOVA analysis for the UV-A treatments (TRT), time effect (days after treatment; DAT), and the interactive effects between UV-A treatments and time (DAT*TRT) are shown in the figures.

References

    1. Ainsworth E. A., Gillespie K. M. (2007). Estimation of total phenolic content and other oxidation substrates in plant tissues using Folin–Ciocalteu reagent. Nat. Prot. 2, 875–877. doi: 10.1038/nprot.2007.102 - DOI - PubMed
    1. Akula R., Ravishankar G. A. (2011). Influence of abiotic stress signals on secondary metabolites in plants. Plant Signal. Behav. 6, 1720–1731. doi: 10.4161/psb.6.11.17613, PMID: - DOI - PMC - PubMed
    1. Bidel L. P. R., Chomicki G., Bonini F., Mondolot L., Soulé J., Coumans M., et al. . (2015). Dynamics of flavonol accumulation in leaf tissues under different UV-B regimes in Centella asiatica (Apiaceae). Planta 242, 545–559. doi: 10.1007/s00425-015-2291-7, PMID: - DOI - PubMed
    1. Boo H.-O., Heo B.-G., Gorinstein S., Chon S.-U. (2011). Positive effects of temperature and growth conditions on enzymatic and antioxidant status in lettuce plants. Plant Sci. 181, 479–484. doi: 10.1016/j.plantsci.2011.07.013, PMID: - DOI - PubMed
    1. Brazaitytė A., Duchovskis P., Urbonavičiūtė A., Samuolienė G., Jankauskienė J., Sakalauskaitė J., et al. . (2010). The effect of light-emitting diodes lighting on the growth of tomato transplants. Zamdirbyste Agric. 97, 89–98.

LinkOut - more resources