

Blue-emitting acridine-tagged silver(i)-bis-N-heterocyclic carbene
- PMID: 35519949
- PMCID: PMC9061350
- DOI: 10.1039/c9ra00281b
Blue-emitting acridine-tagged silver(i)-bis-N-heterocyclic carbene
Abstract
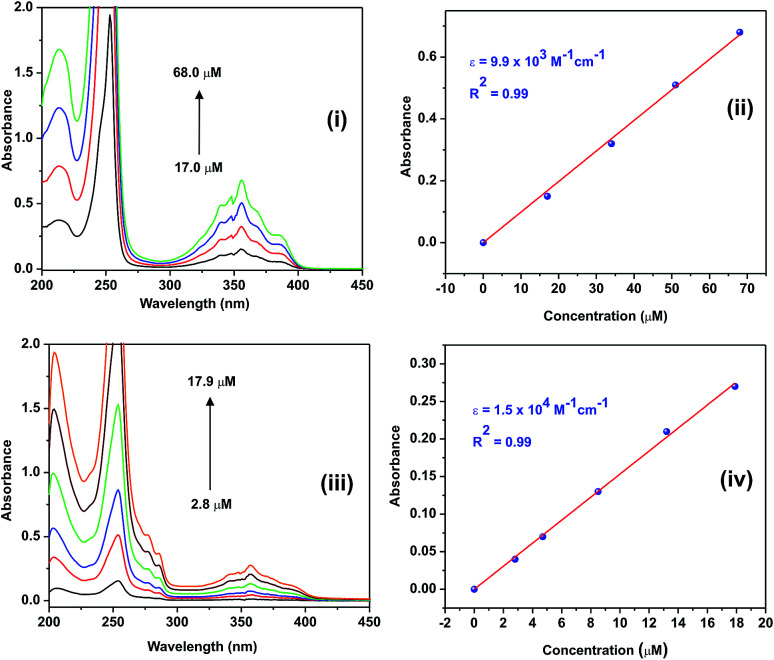
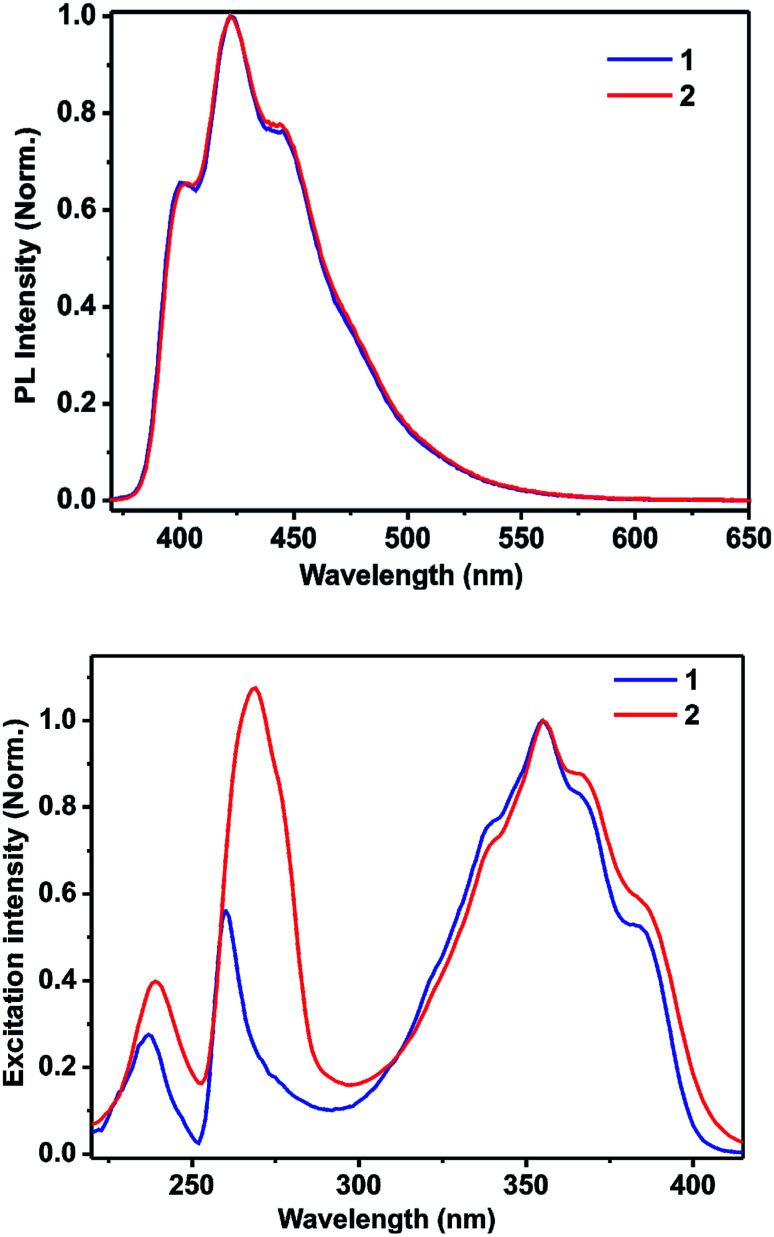
Herein, the photophysical properties of an acridine derivative of a bis-N-heterocyclic carbene silver complex were investigated. The HOMO and LUMO energy differences between 9-[(N-methyl imidazol-2-ylidene)]acridine and 4,5-bis[(N-methyl-imidazol-2-ylidene)methyl]acridine were theoretically compared. Based on the calculation, the 4,5-bis N-heterocyclic carbene-tethered acridine type of ligand was found to be a potential source for tuning the fluorescent nature of the resultant metal derivatives. Thus, a 4,5-bis N-heterocyclic carbene (NHC)-tethered acridine silver(i) salt was synthesized, and its photophysical properties were investigated. The 4,5-bis[(N-isopropylimidazol-2-ylidene)methyl]acridine silver(i) hexafluorophosphate complex was obtained from the reaction between [4,5-bis{(N-isopropylimidazolium)methyl}acridine] hexafluorophosphate and Ag2O in very good yield; this molecule was characterized by elemental analysis and FTIR, multinuclear (1H and 13C) NMR, UV-Vis, and fluorescence spectroscopic techniques. The molecular structure has been confirmed by single-crystal X-ray diffraction analysis, which has revealed that the complex is a homoleptic mononuclear silver(i) cationic solid. The charge of the Ag(i)-NHC cation is balanced by the hexafluorophosphate anion. The cationic moieties are closely packed in the chair and inverted chair forms where silver(i) possesses a quasi-linear geometry. Moreover, the silver complex provided blue emission from all the three excitations with good fluorescence quantum yield. The fluorescence lifetime of the silver(i) complex has been determined using the time-correlated single photon counting technique. Interestingly, the fluorescence decay pattern and the fluorescence lifetimes of the silver complex are largely different from those of the parent ligand acridine imidazolium salt. Moreover, the theoretical predictions have been found to be in good agreement with the experimental results.
This journal is © The Royal Society of Chemistry.
Conflict of interest statement
There are no conflicts to declare.
Figures


Similar articles
-
Silver(I) complexes of mono- and bidentate N-heterocyclic carbene ligands: synthesis, crystal structures, and in vitro antibacterial and anticancer studies.Eur J Med Chem. 2015 Jan 27;90:82-92. doi: 10.1016/j.ejmech.2014.11.005. Epub 2014 Nov 4. Eur J Med Chem. 2015. PMID: 25461313
-
Steric and Electronic Effects in N-Heterocyclic Carbene Gold(III) Complexes: An Experimental and Computational Study.Molecules. 2022 Nov 28;27(23):8289. doi: 10.3390/molecules27238289. Molecules. 2022. PMID: 36500397 Free PMC article.
-
Dinuclear silver(I)-N-heterocyclic carbene complexes: Synthesis, characterization and larvicidal activity of bis-imidazolium dinuclear silver(I)-N-heterocyclic carbene complexes.J Inorg Biochem. 2017 Oct;175:232-238. doi: 10.1016/j.jinorgbio.2017.07.030. Epub 2017 Aug 4. J Inorg Biochem. 2017. PMID: 28800547
-
Synthesis and characterization of oxygen-functionalised-NHC silver(I) complexes and NHC transmetallation to nickel(II).Dalton Trans. 2014 Mar 28;43(12):4700-10. doi: 10.1039/c3dt52773e. Dalton Trans. 2014. PMID: 24473851
-
Well-defined N-heterocyclic carbene silver halides of 1-cyclohexyl-3-arylmethylimidazolylidenes: synthesis, structure and catalysis in A3-reaction of aldehydes, amines and alkynes.Dalton Trans. 2011 Mar 7;40(9):2046-52. doi: 10.1039/c0dt01074j. Epub 2011 Jan 24. Dalton Trans. 2011. PMID: 21264392
Cited by
-
Reaction of chloroauric acid with histidine in microdroplets yields a catalytic Au-(His)2 complex.Chem Sci. 2020 Jan 31;11(9):2558-2565. doi: 10.1039/c9sc06221a. Chem Sci. 2020. PMID: 34084419 Free PMC article.
-
Luminescent zinc(ii) selone macrocyclic ring.RSC Adv. 2019 May 14;9(26):14841-14848. doi: 10.1039/c9ra01819k. eCollection 2019 May 9. RSC Adv. 2019. PMID: 35516307 Free PMC article.
-
Water-Soluble Pyrene-Adorned Imidazolium Salts with Multicolor Solid-State Fluorescence: Synthesis, Structure, Photophysical Properties, and Application on the Detection of Latent Fingerprints.ACS Omega. 2021 Apr 9;6(15):10318-10332. doi: 10.1021/acsomega.1c00679. eCollection 2021 Apr 20. ACS Omega. 2021. PMID: 34056185 Free PMC article.
-
Understanding the Role of NHC Ditopic Ligand Substituents in the Molecular Diversity and Emissive Properties of Silver Complexes.Inorg Chem. 2024 Nov 11;63(45):21699-21710. doi: 10.1021/acs.inorgchem.4c02940. Epub 2024 Oct 29. Inorg Chem. 2024. PMID: 39473062 Free PMC article.
-
Synthesis, characterization and catalytic properties of cationic N-heterocyclic carbene silver complexes.Turk J Chem. 2021 Jun 30;45(3):577-584. doi: 10.3906/kim-2010-26. eCollection 2021. Turk J Chem. 2021. PMID: 34385853 Free PMC article.
References
-
- Visbal R. Gimeno M. C. Chem. Soc. Rev. 2014;43:3551–3574. doi: 10.1039/C3CS60466G. - DOI - PubMed
- Basova T. V. Hassan A. Morozova N. B. Coord. Chem. Rev. 2019;380:58–82. doi: 10.1016/j.ccr.2018.09.005. - DOI
- Hameury S. Frémont P. d. Braunstein P. Chem. Soc. Rev. 2017;46:632–733. doi: 10.1039/C6CS00499G. - DOI - PubMed
LinkOut - more resources
Full Text Sources
Miscellaneous