

Synthesis of N-doped ZnO nanoparticles with cabbage morphology as a catalyst for the efficient photocatalytic degradation of methylene blue under UV and visible light
- PMID: 35519985
- PMCID: PMC9061168
- DOI: 10.1039/c8ra09962f
Synthesis of N-doped ZnO nanoparticles with cabbage morphology as a catalyst for the efficient photocatalytic degradation of methylene blue under UV and visible light
Abstract
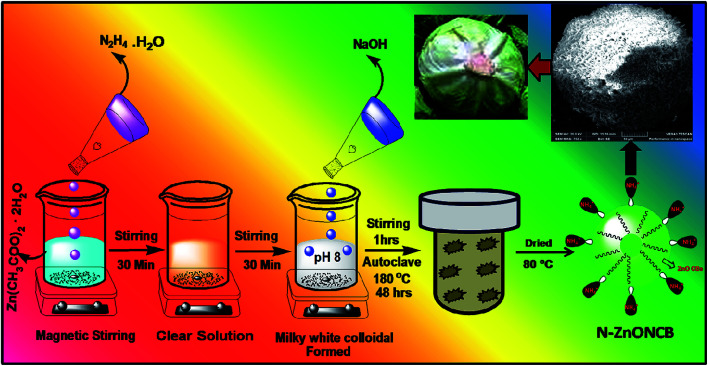
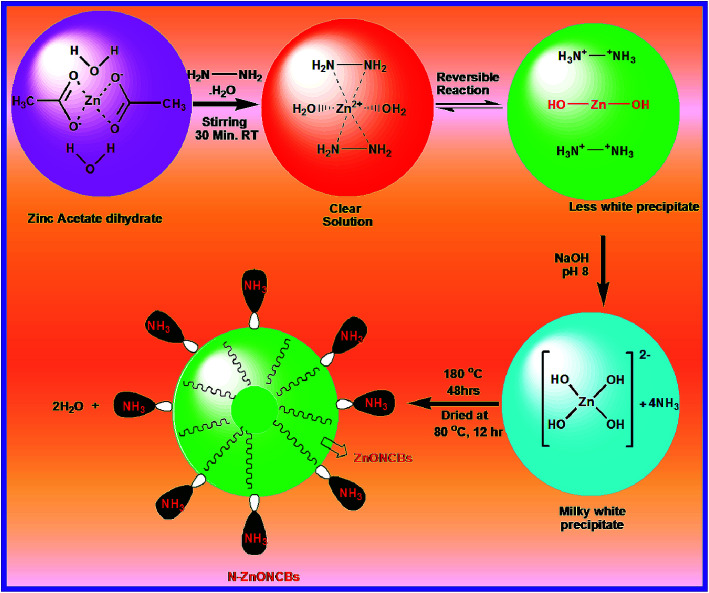
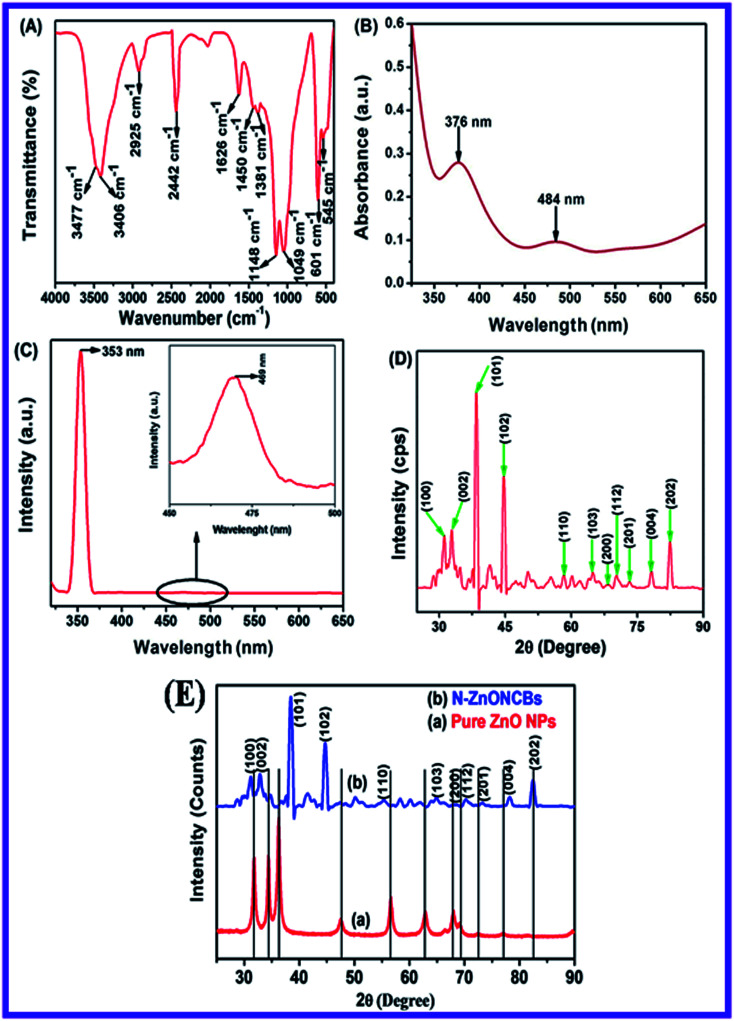
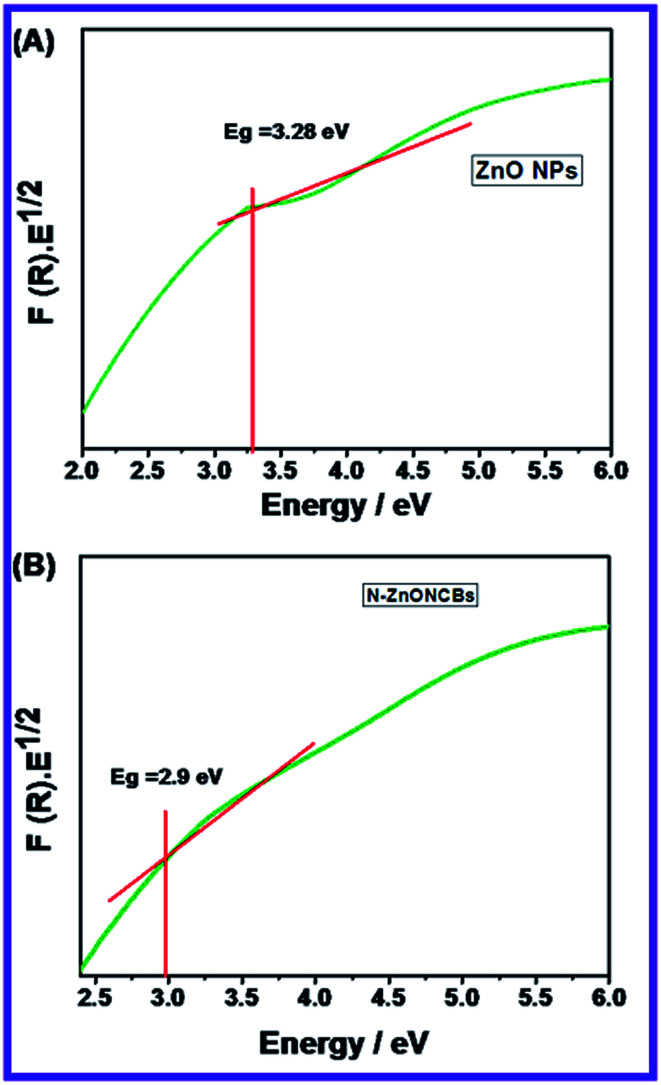
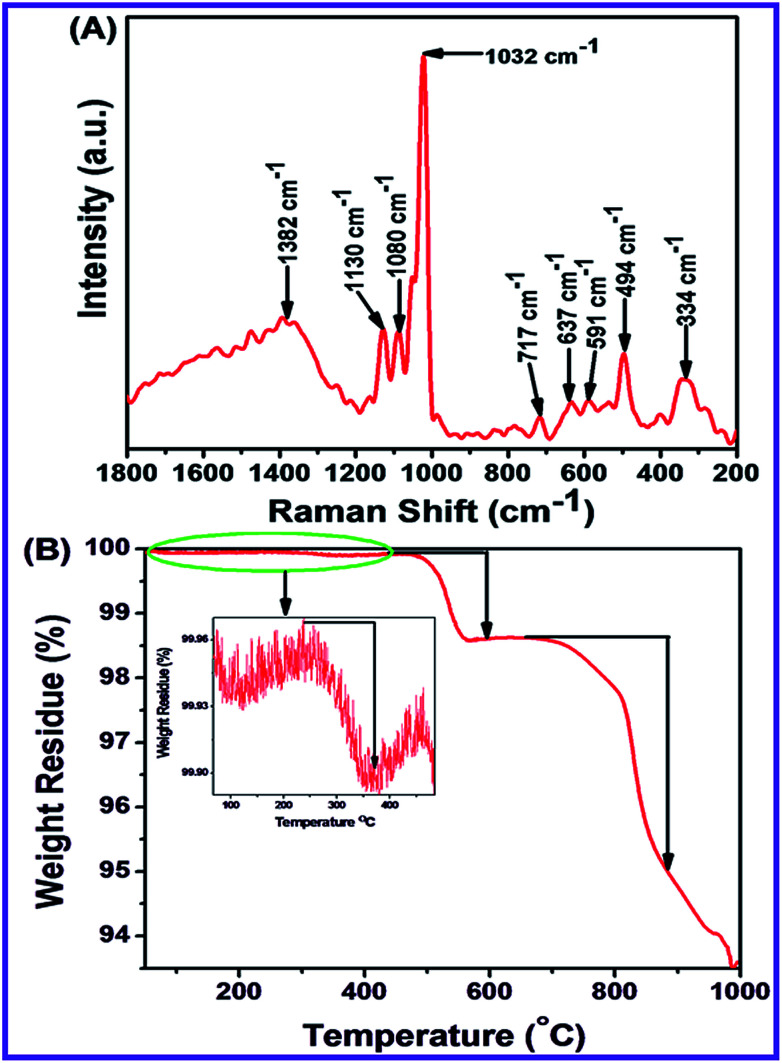
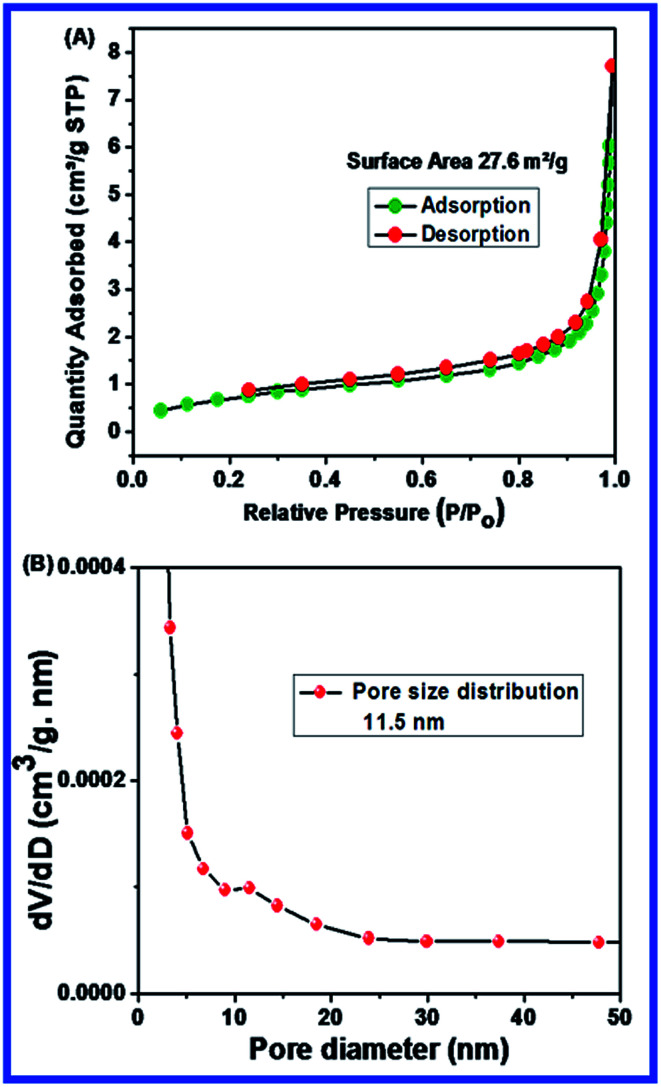
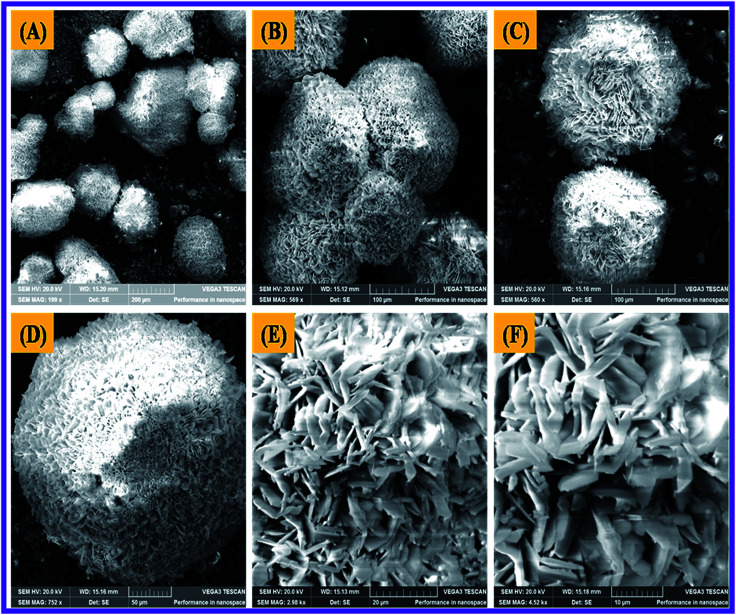
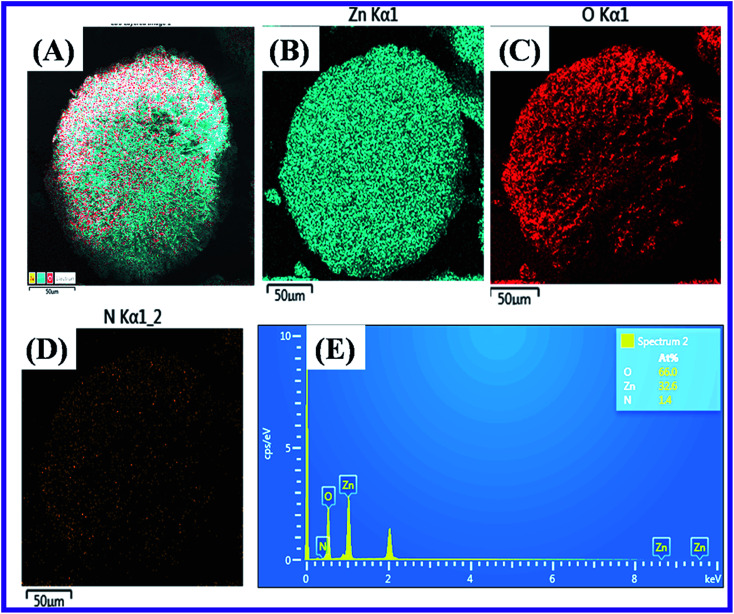
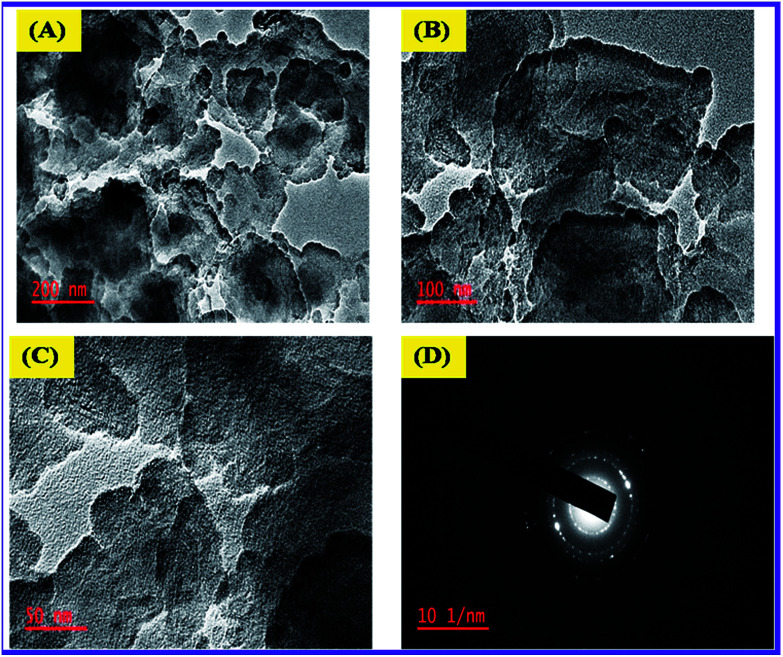
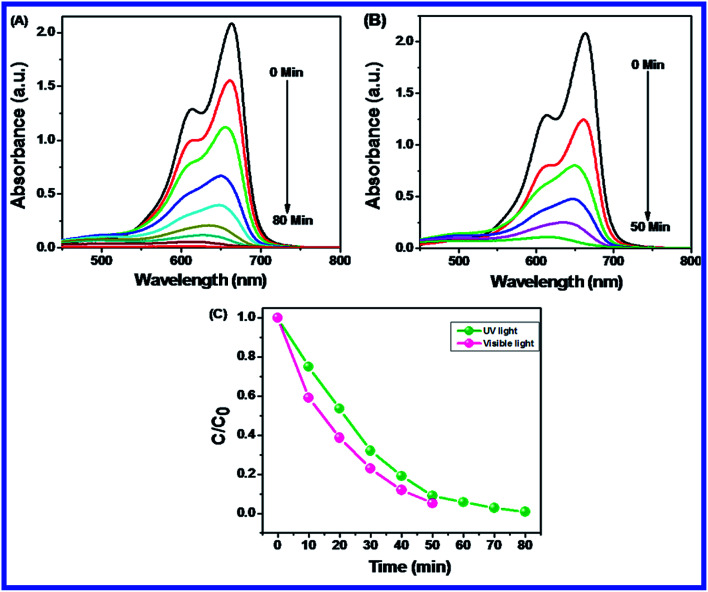
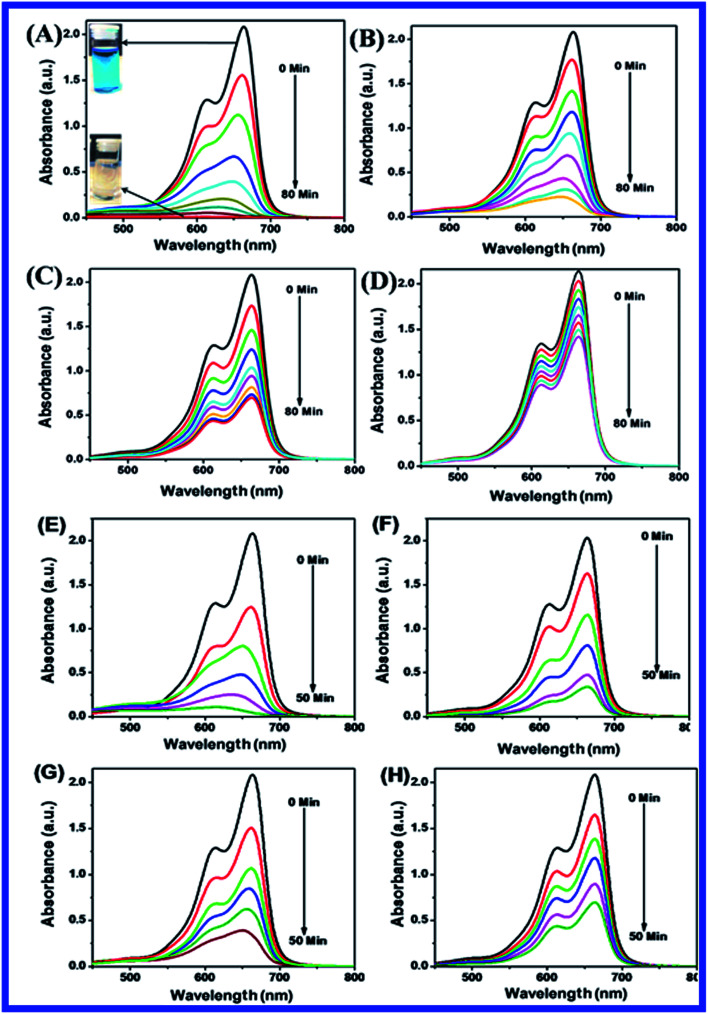
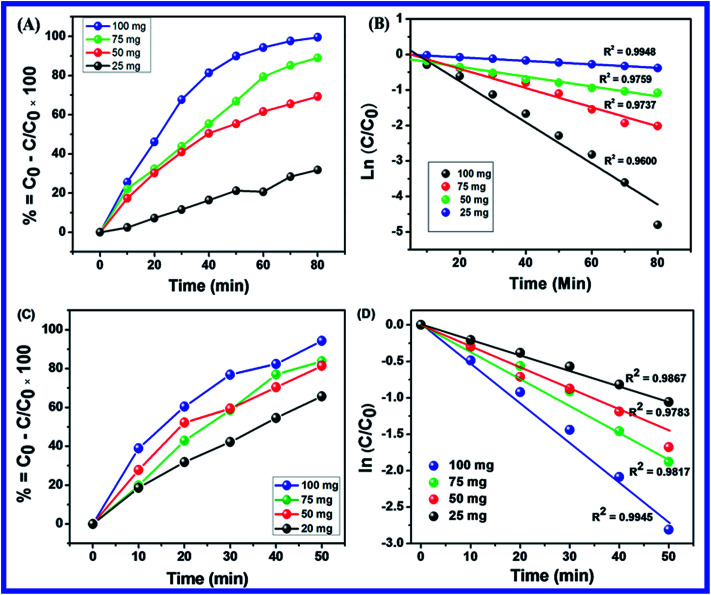
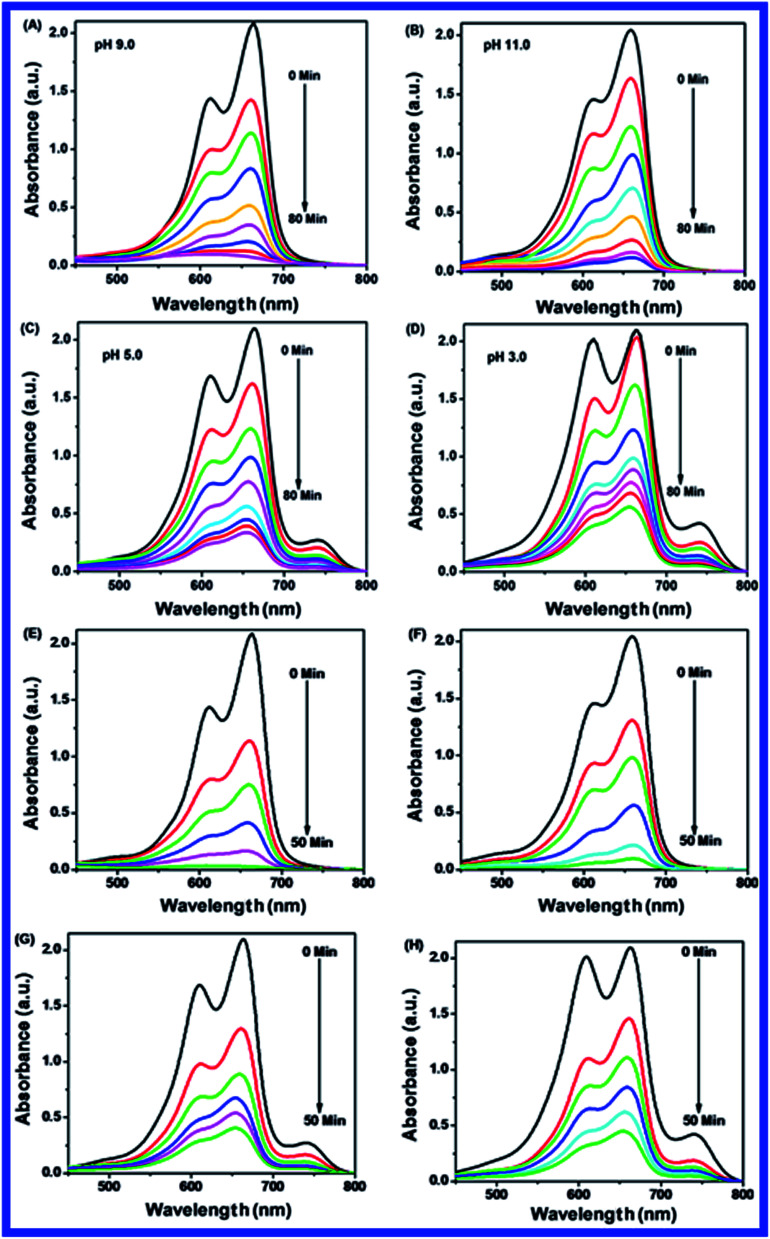
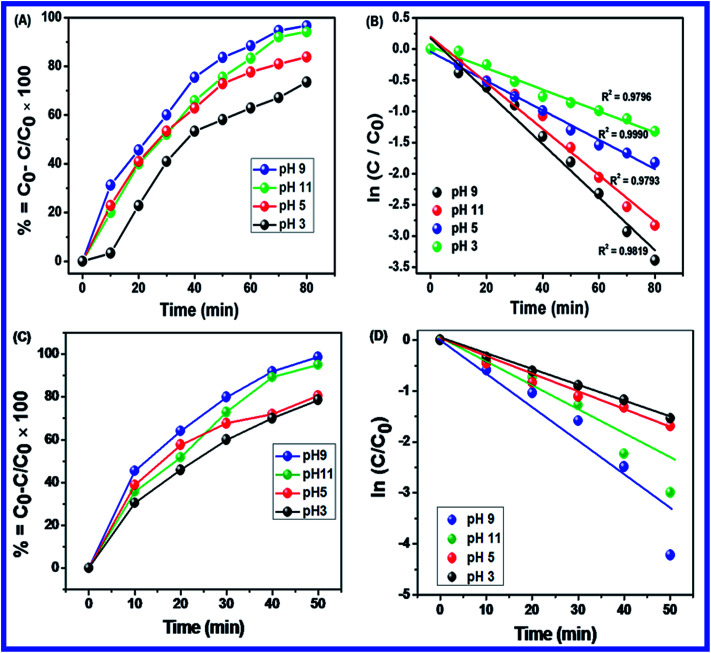
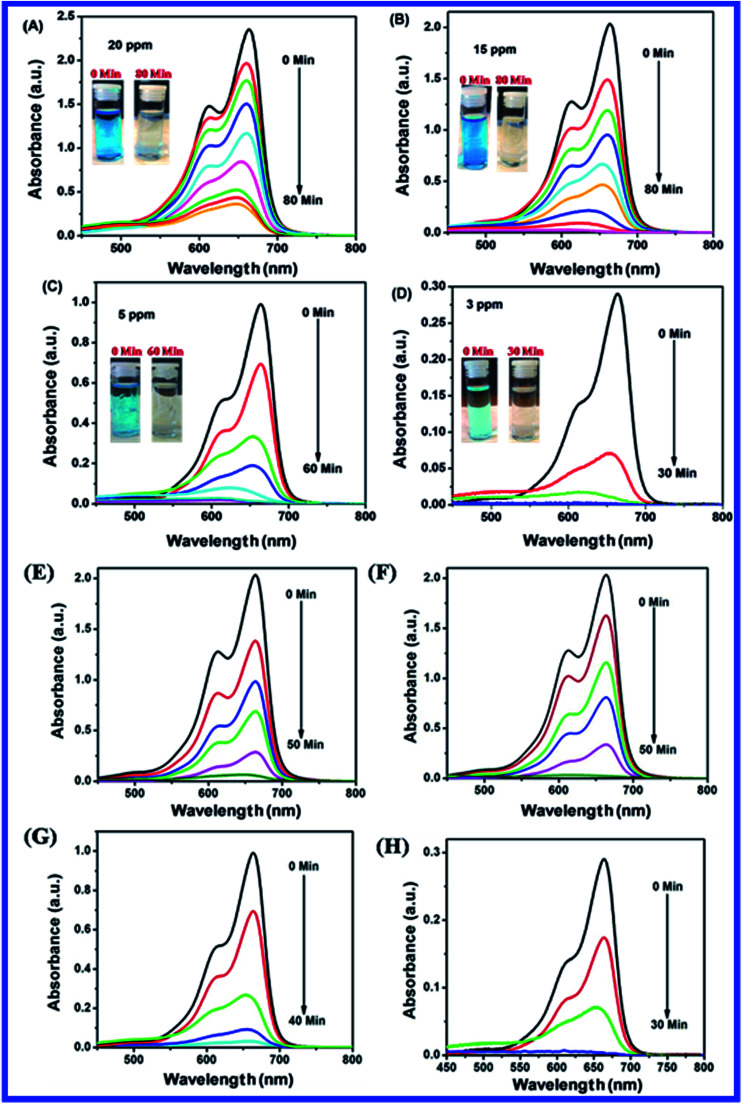
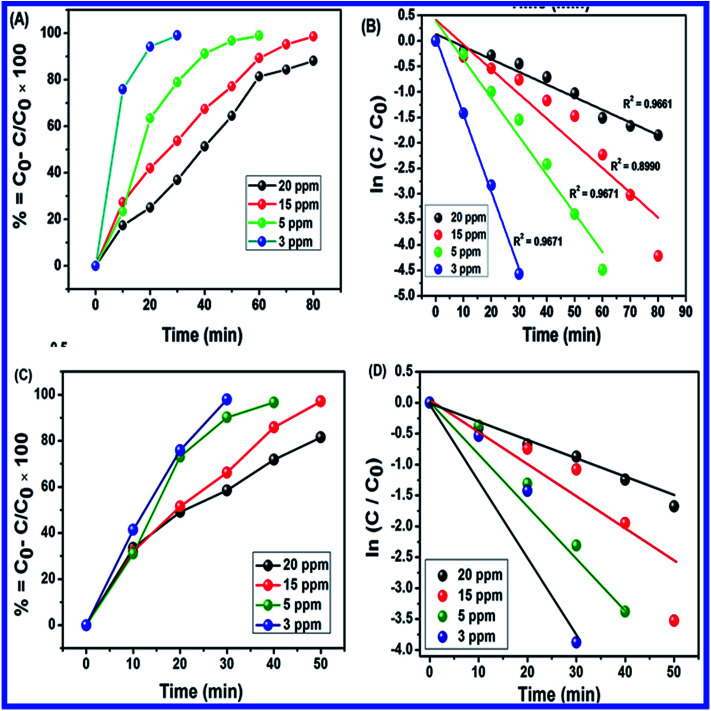
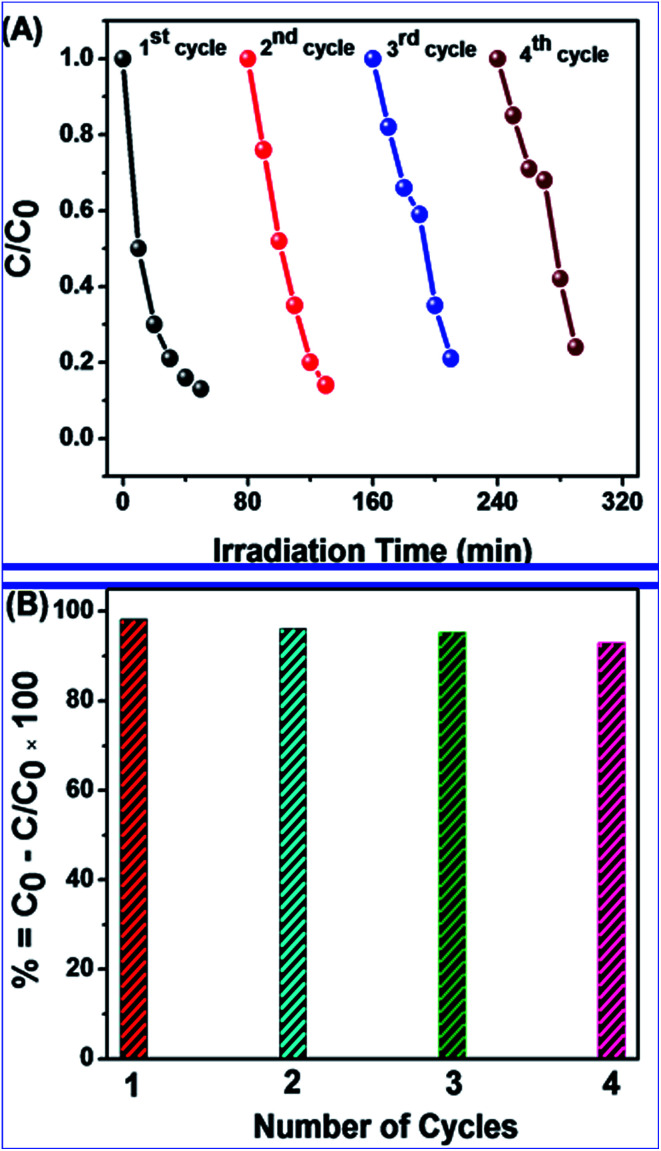
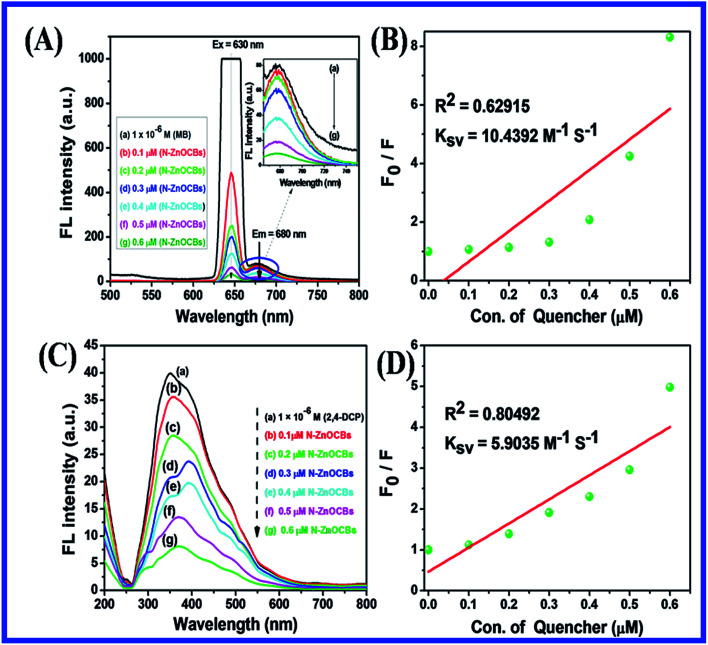
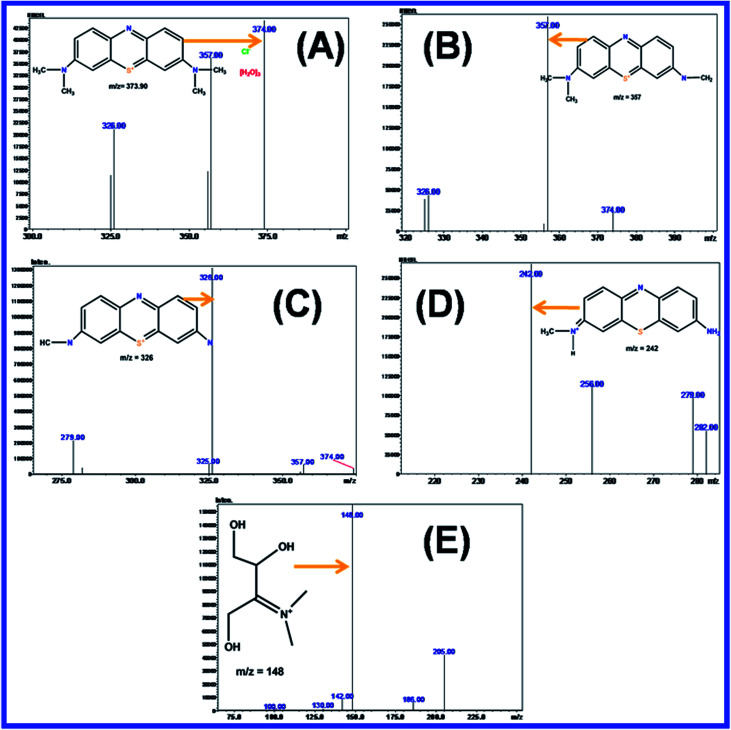
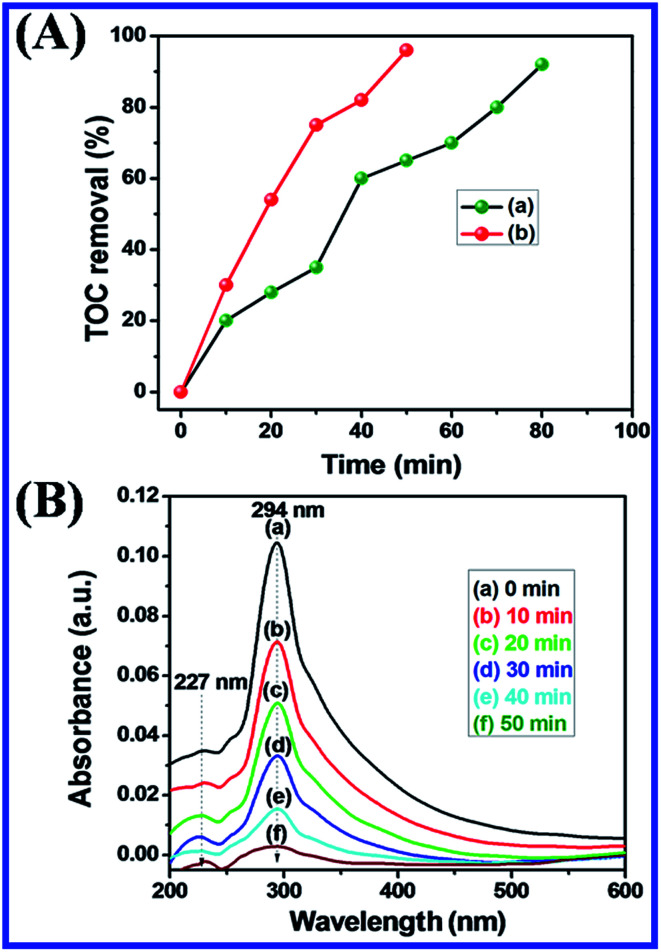
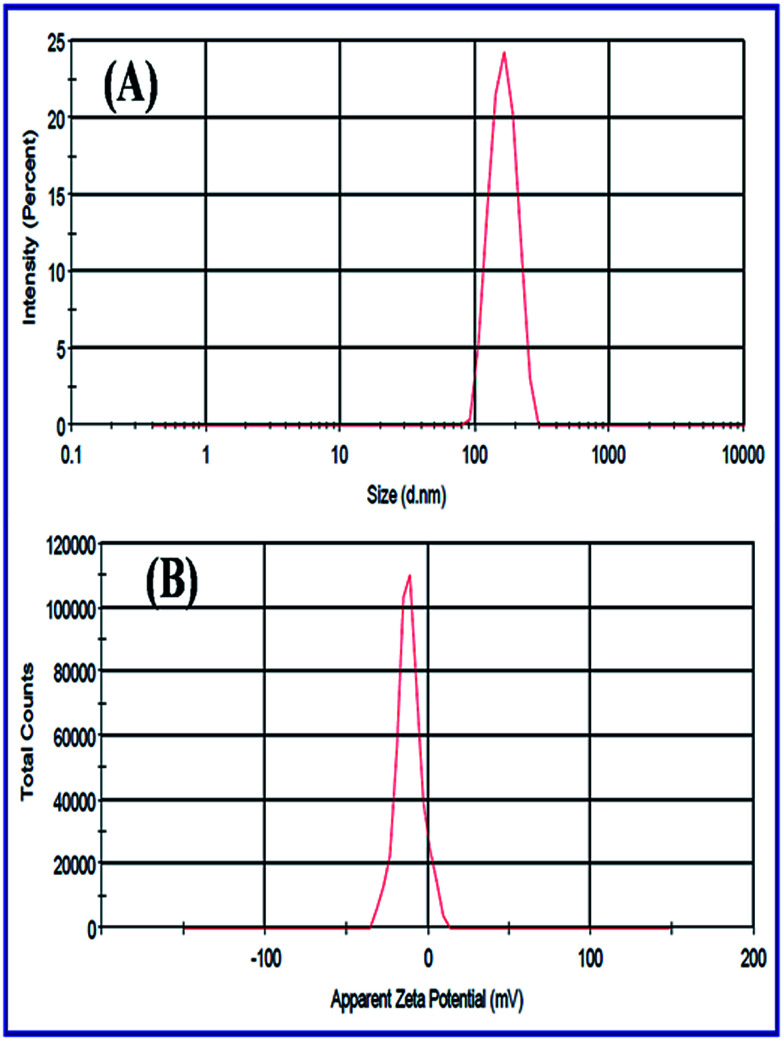
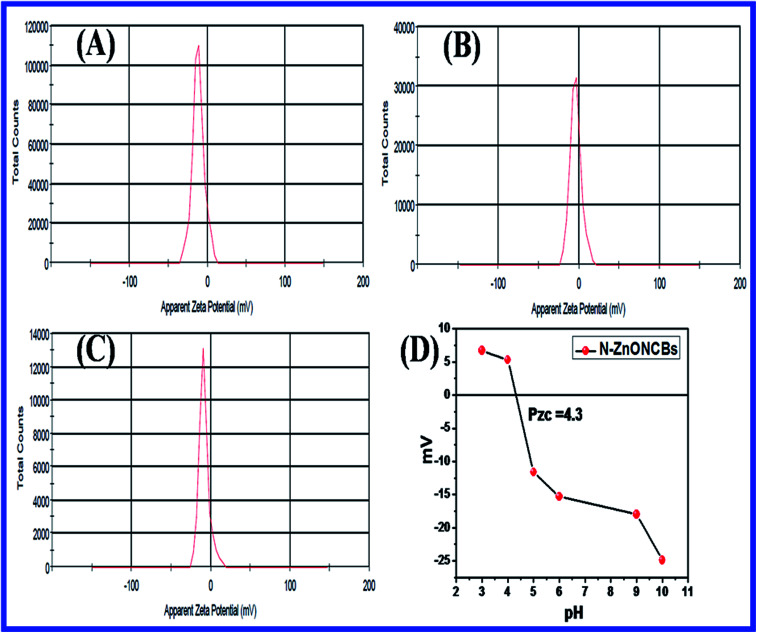
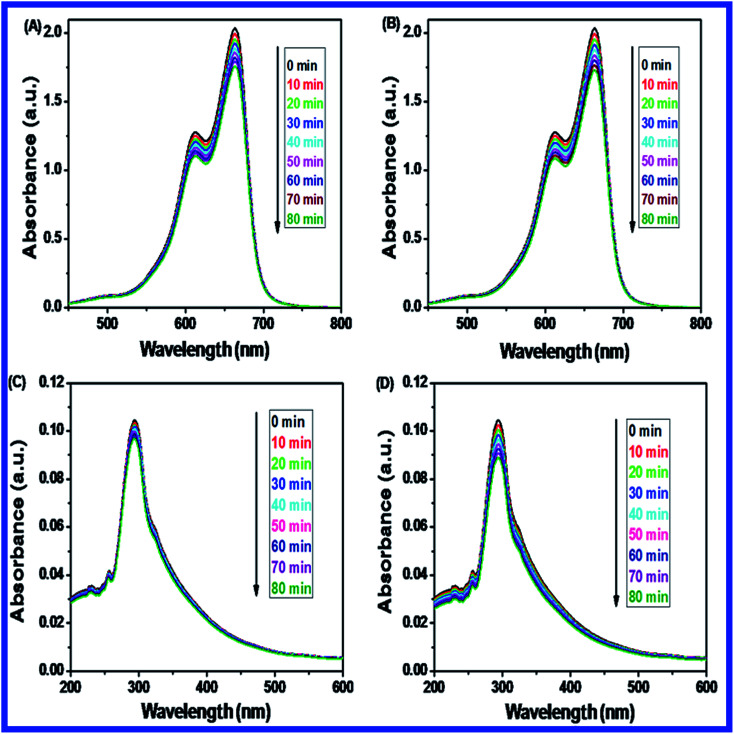
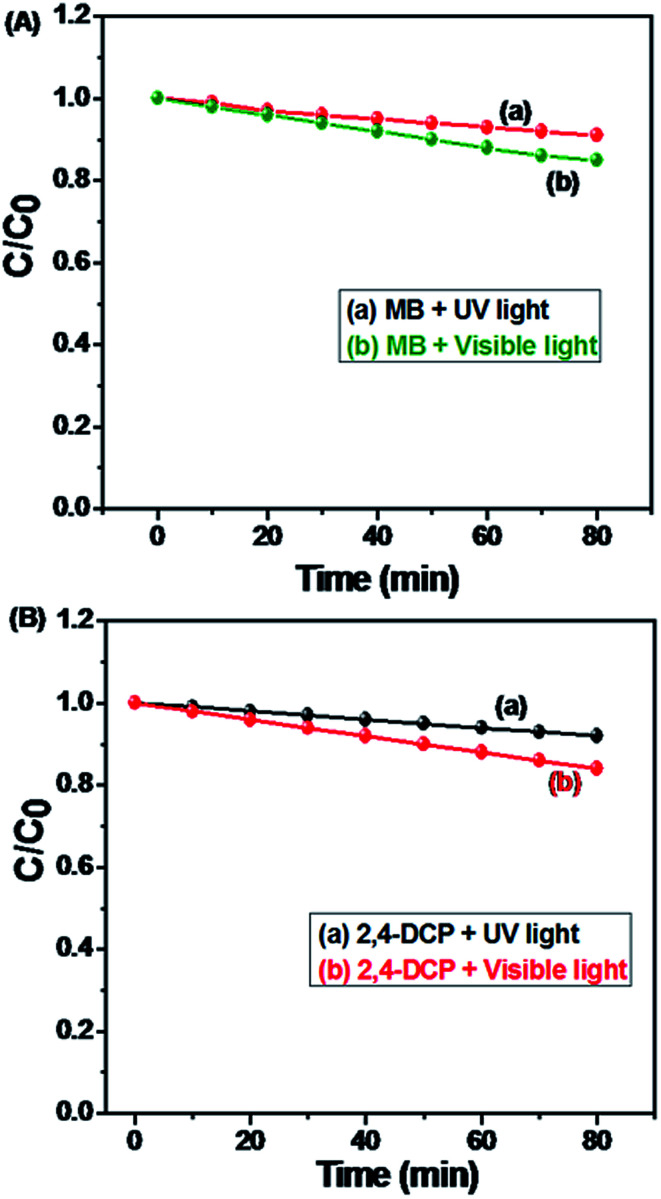
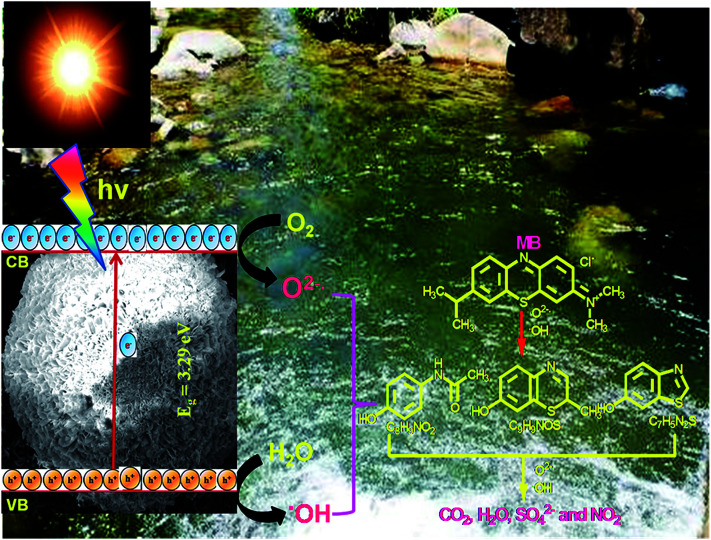
In this study, the synthesis of nitrogen-doped zinc oxide nanoparticles with a cabbage like morphology (N-ZnONCBs) by a hydrothermal method using zinc acetate dihydrate as a precursor and hydrazine monohydrate as a nitrogen source is reported. N-ZnONCB were characterized using UV-visible Spectroscopy (UV-Vis), Fluorescence Spectroscopy, Fourier Transmittance Infrared Spectroscopy (FTIR), X-ray diffraction (XRD), Raman Spectroscopy, Thermogravimetric Analysis (TGA), Scanning Electron Microscopy (SEM), Transmission Electron Microscopy (TEM), Electron Dispersive Spectroscopy (EDS) and EDX elemental mapping. N-ZnONCBs were tested for their photocatalytic capabilities in the degradation of methylene blue (MB) under UV-light and visible light irradiation for about 0 to 80 minutes and 0 to 50 min respectively. The N-ZnONCB catalyst demonstrated improved photodegradation efficiency (98.6% and 96.2%) and kinetic degradation rates of MB (k = -0.0579 min-1 and k = -0.0585 min-1) under UV light and visible light irradiation at different time intervals. The photodegradation study was also evaluated with different dosages of N-ZnONCB catalyst, different initial concentrations of MB and variation in the pH (3, 5, 9 and 11) of the solution of MB under UV light and visible light irradiation. The photocatalytic degradation intermediate products were obtained by liquid chromatography mass spectra (LC-MS) and also complete mineralization was determined by using Total Organic Carbon (TOC) studies. This photocatalyst was also tested with 2,4-dichlorophenol (2,4-DCP) under visible light irradiation at different time intervals. Fluorescence and quenching studies were performed for the binding interaction between the N-ZnONCB catalyst and MB dye. A Zetasizer was used to find the charge and average size of the N-ZnONCB catalyst and also the charge of the N-ZnONCB catalyst before and after MB dye solution adsorption. The N-ZnONCB catalyst was also tested for its photostability and reusability with a percentage degradation rate of MB (93.2%) after 4 cycle experiments. These results have clearly demonstrated that the N-ZnONCB catalyst can be applied for the photocatalytic degradation of MB from wastewater samples.
This journal is © The Royal Society of Chemistry.
Conflict of interest statement
There are no conflicts to declare.
Figures
Similar articles
-
Photocatalytic Degradation of Methylene Blue Using N-Doped ZnO/Carbon Dot (N-ZnO/CD) Nanocomposites Derived from Organic Soybean.ACS Omega. 2023 Apr 17;8(17):14965-14984. doi: 10.1021/acsomega.2c07546. eCollection 2023 May 2. ACS Omega. 2023. PMID: 37151531 Free PMC article.
-
Photocatalytic degradation of aqueous methylene blue using ca-alginate supported ZnO nanoparticles: point of zero charge role in adsorption and photodegradation.Environ Sci Pollut Res Int. 2023 Jun;30(26):68435-68449. doi: 10.1007/s11356-023-27318-1. Epub 2023 May 1. Environ Sci Pollut Res Int. 2023. PMID: 37126167
-
Coupling ZnO with CuO for efficient organic pollutant removal.Environ Sci Pollut Res Int. 2023 Jun;30(28):71984-72008. doi: 10.1007/s11356-022-24139-6. Epub 2022 Nov 22. Environ Sci Pollut Res Int. 2023. PMID: 36414902
-
Graphene-Based Multi-Nanocomposites: Synthesis, Characterization and Photodegradation Analysis.J Fluoresc. 2025 Feb 2. doi: 10.1007/s10895-025-04136-x. Online ahead of print. J Fluoresc. 2025. PMID: 39894873 Review.
-
Eco-friendly synthesis of self-regenerative low-cost biosorbent by the incorporation of CuO: a photocatalyst sensitive to visible light irradiation for azo dye removal.Environ Sci Pollut Res Int. 2020 Sep;27(25):31074-31091. doi: 10.1007/s11356-020-09364-1. Epub 2020 Jun 10. Environ Sci Pollut Res Int. 2020. PMID: 32524399 Review.
Cited by
-
Hydrothermal ZnO Nanomaterials: Tailored Properties and Infinite Possibilities.Nanomaterials (Basel). 2025 Apr 15;15(8):609. doi: 10.3390/nano15080609. Nanomaterials (Basel). 2025. PMID: 40278474 Free PMC article. Review.
-
Photocatalytic Degradation of Brilliant Blue Dye Under Solar Light Irradiation: An Insight Into Mechanistic, Kinetics, Mineralization and Scavenging Studies.J Fluoresc. 2025 Mar 5. doi: 10.1007/s10895-025-04218-w. Online ahead of print. J Fluoresc. 2025. PMID: 40042727
-
From Ethanolamine Precursor Towards ZnO-How N Is Released from the Experimental and Theoretical Points of View.Nanomaterials (Basel). 2019 Oct 3;9(10):1415. doi: 10.3390/nano9101415. Nanomaterials (Basel). 2019. PMID: 31623410 Free PMC article.
-
Photocatalytic Degradation of Methylene Blue Using N-Doped ZnO/Carbon Dot (N-ZnO/CD) Nanocomposites Derived from Organic Soybean.ACS Omega. 2023 Apr 17;8(17):14965-14984. doi: 10.1021/acsomega.2c07546. eCollection 2023 May 2. ACS Omega. 2023. PMID: 37151531 Free PMC article.
-
Visible-Light-Driven Mentha spicata L.-Mediated Ag-Doped Bi2Zr2O7 Nanocomposite for Enhanced Degradation of Organic Pollutants, Electrochemical Sensing, and Antibacterial Applications.ACS Environ Au. 2024 Jan 9;4(2):106-125. doi: 10.1021/acsenvironau.3c00057. eCollection 2024 Mar 20. ACS Environ Au. 2024. PMID: 38525021 Free PMC article.
References
-
- Hoffmann M. R. Choi W. Bahnemann D. W. Environmental Applications of Semiconductor Photocatalysis. Chem. Rev. 1995;95:69–96. doi: 10.1021/cr00033a004. - DOI
-
- Zhou H. Qu Y. Zeid T. Duan X. Towards highly efficient photocatalysts using semiconductor nanoarchitectures. Energy Environ. Sci. 2012;5:6732–6743. doi: 10.1039/C2EE03447F. - DOI
-
- Xu H. Ouyang S. Liu L. Reunchan P. Umezawa N. Ye J. Recent advances in TiO2-based photocatalysis. J. Mater. Chem. A. 2014;2:12642–12661. doi: 10.1039/C4TA00941J. - DOI
LinkOut - more resources
Full Text Sources
Miscellaneous