. 2020 Aug 5;10(48):28992-29009.
doi: 10.1039/d0ra04890a. eCollection 2020 Aug 3.

Preparation and characterisation of PHT-loaded chitosan lecithin nanoparticles for intranasal drug delivery to the brain

Affiliations

Preparation and characterisation of PHT-loaded chitosan lecithin nanoparticles for intranasal drug delivery to the brain

Amal Yousfan et al. RSC Adv. .

Abstract

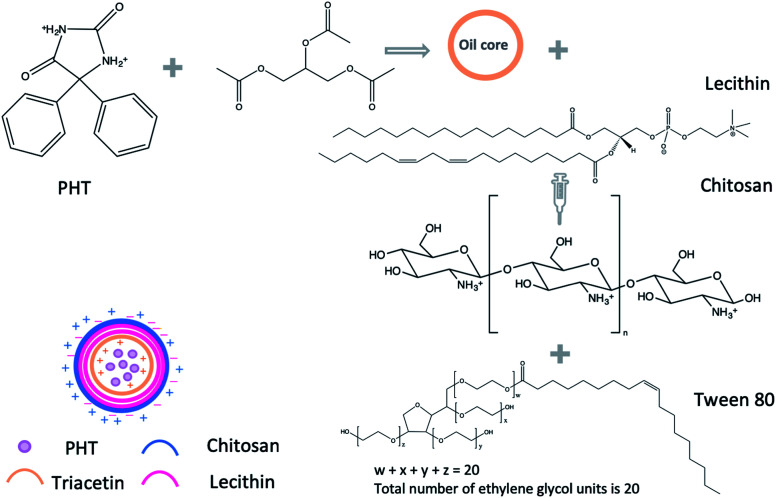
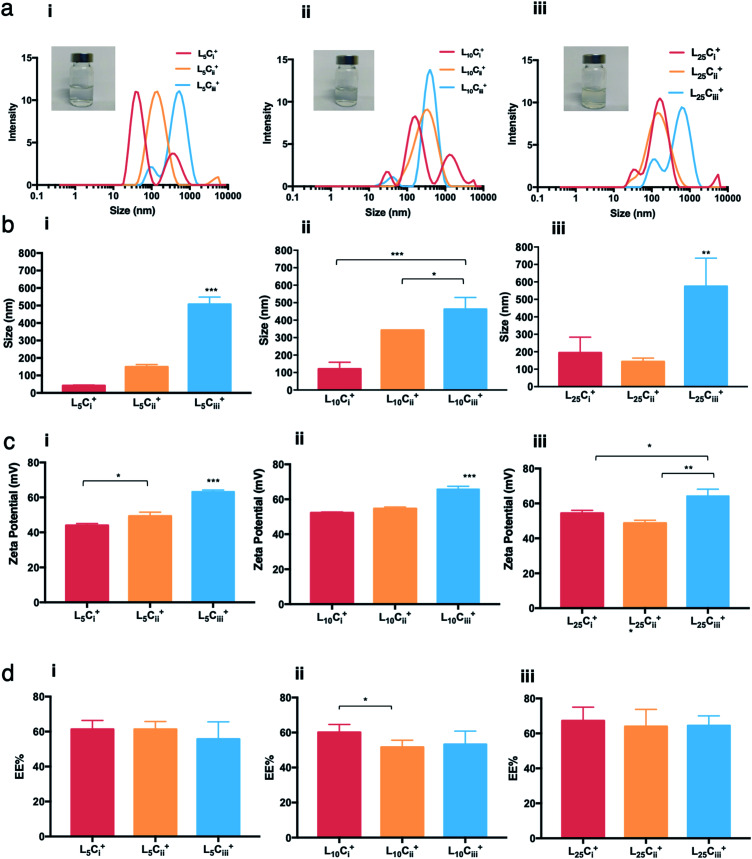
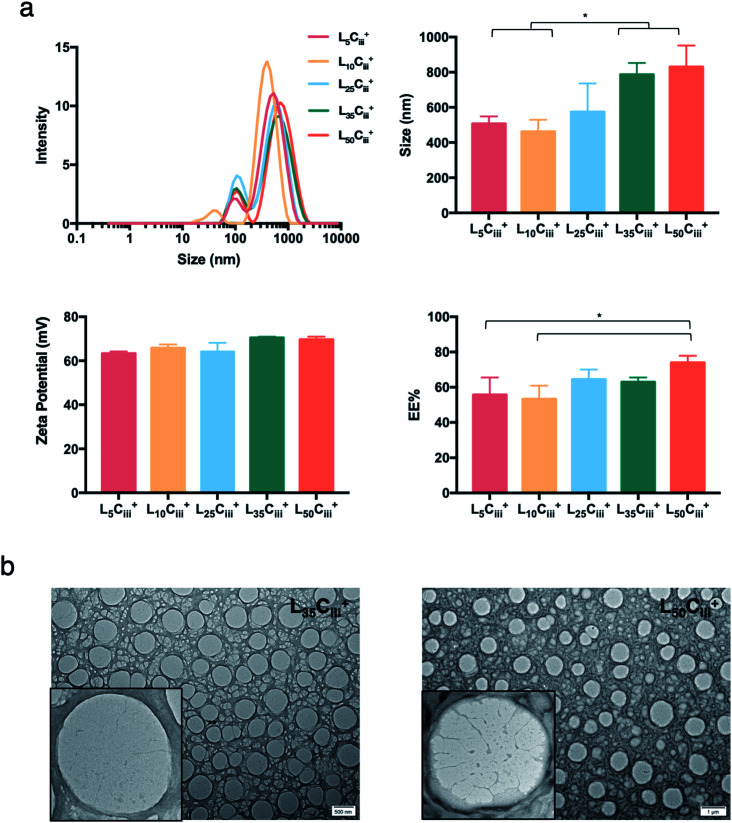
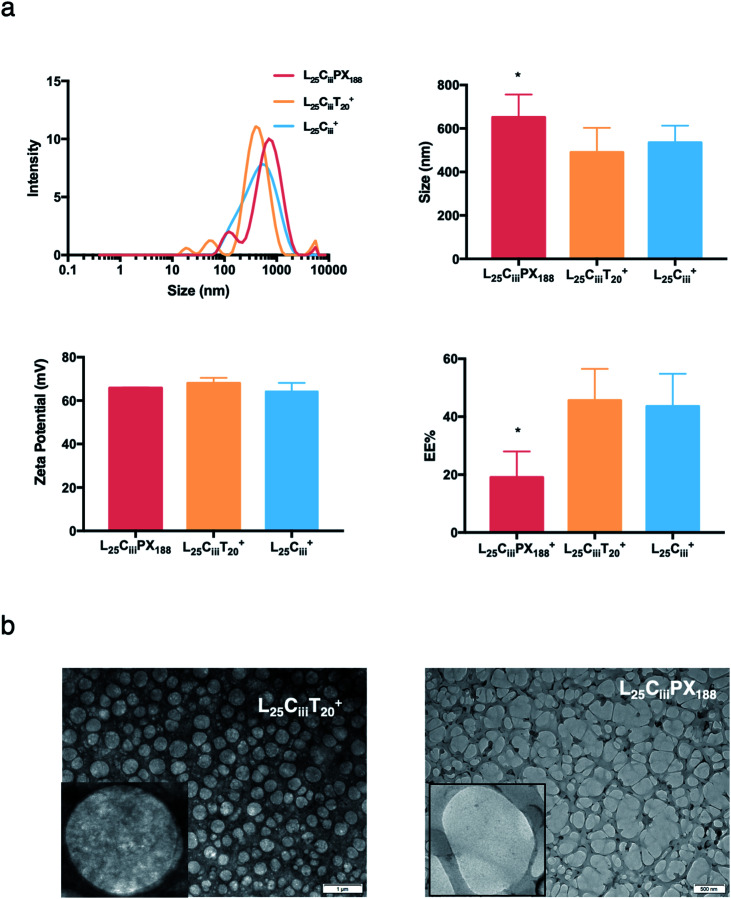
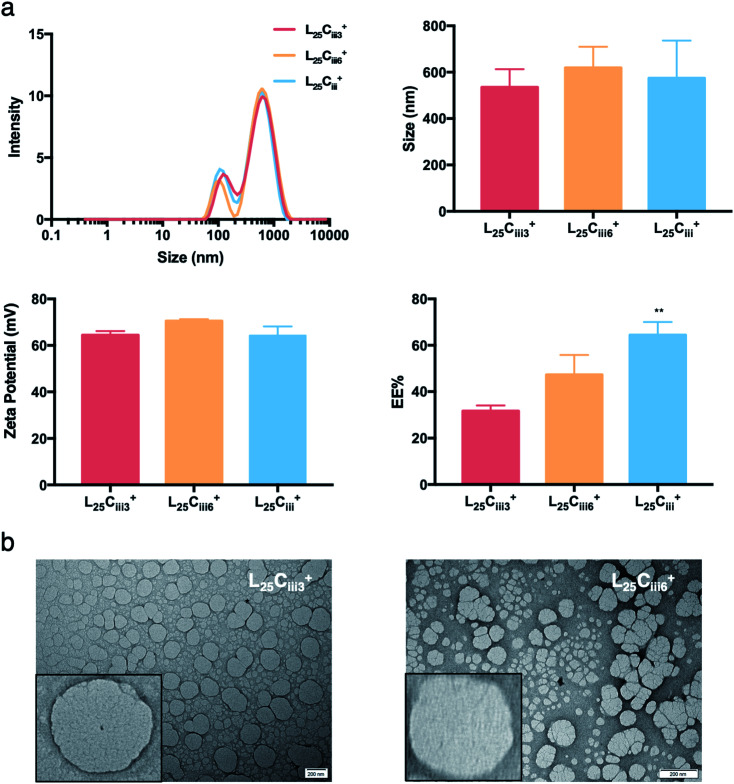
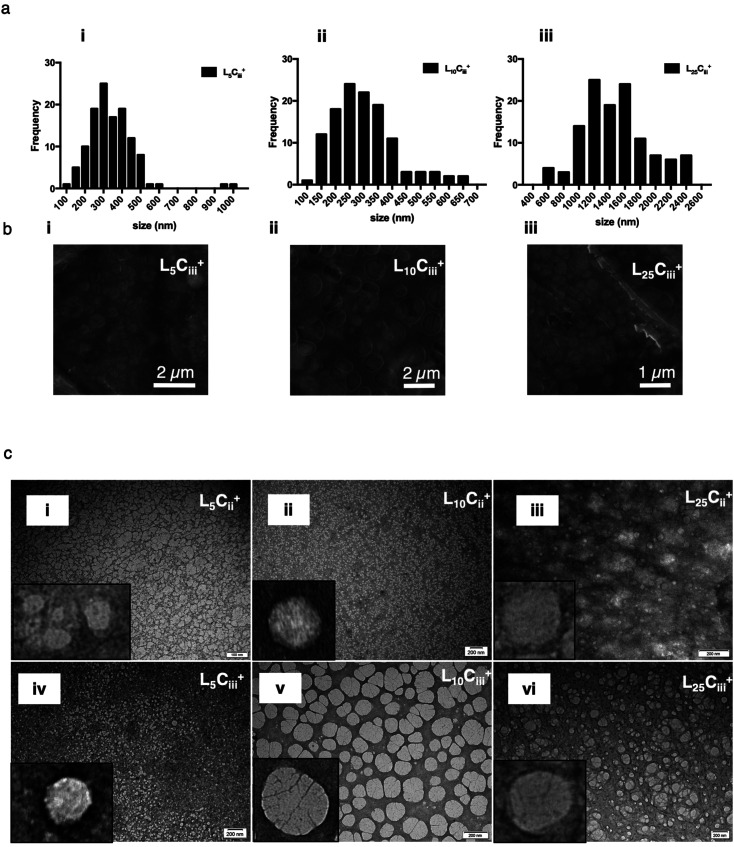
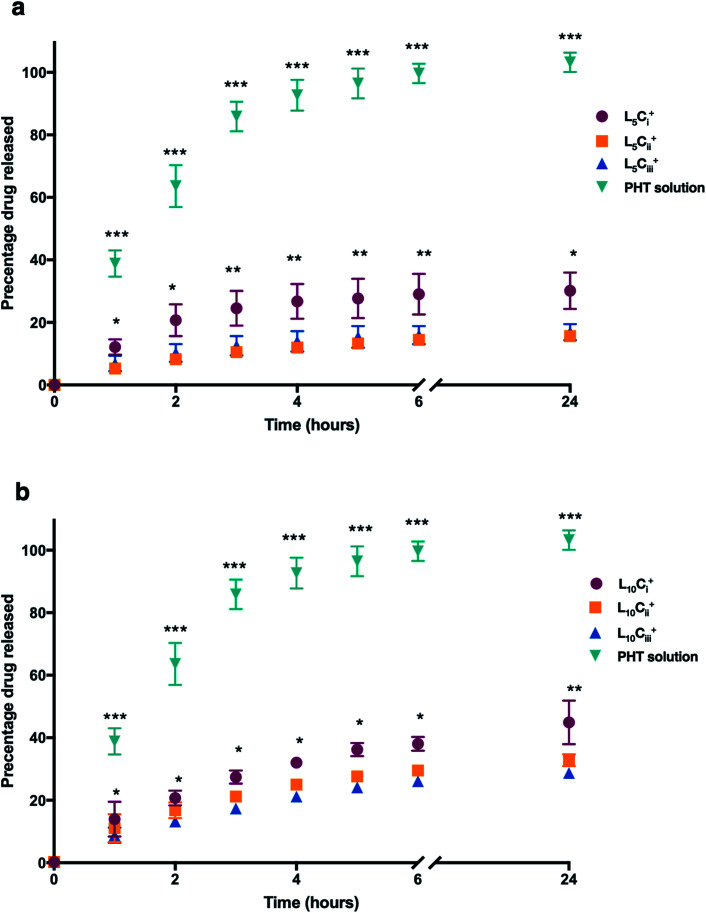
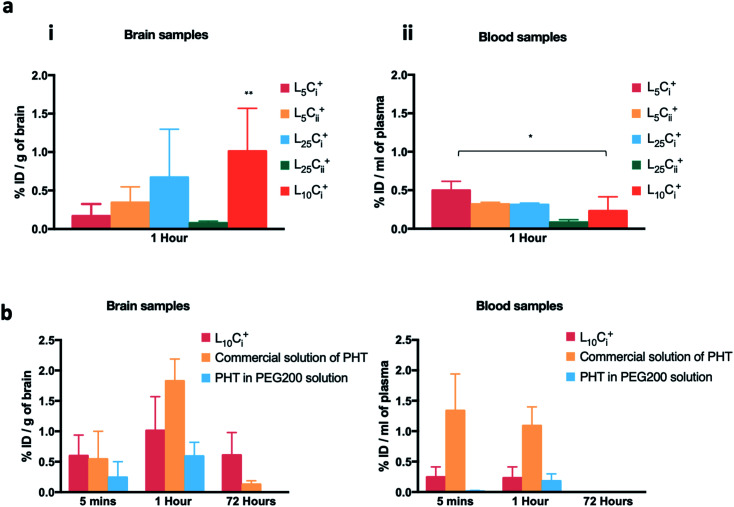
The use of nanoparticles (NPs) for intranasal (IN) drug delivery to the brain represents a hopeful strategy to enhance brain targeting of anti-epileptic drugs. In the present work, chitosan-lecithin NPs loaded with phenytoin (PHT), were prepared using the nano-precipitation method. The spherical nature of the NPs and their stability were confirmed using scanning and transmission electron microscopy, while the average dynamic size and zeta potential were measured using dynamic light scattering. The encapsulation efficiency of PHT was higher than 60% for all prepared NPs. Release studies showed that the amount of released PHT was directly related to the amount of chitosan used. The optimum preparation, L10Ci + was administered via the IN route, and the levels of PHT in the brain were measured in three-time points. Two experimental controls were given via the intraperitoneal (IP) and IN routes. The highest PHT amount reaching 1.01 ± 0.55% for L10Ci +, which was associated with a sustained release of PHT. These preliminary findings show that the IN delivery of PHT-loaded NPs is very promising for managing epilepsy. The direct nose-to-brain approach increases the safety margins of PHT, while the sustained release could improve patient compliance in a clinical setting.


Conflict of interest statement

There are no conflicts to declare.

Figures

Scheme 1
Scheme 1. Synthesis of PHT loaded NPs.
Fig. 1
Fig. 1. The calibration curves, residuals and chromographs of PHT concentration using HP-TLC and HPLC. (a.i) the calibration curve used for HP-TLC measurements relying on the height of the absorbance peaks against the concentration of PHT. The standard curve was linear in the range of 0–70 μg ml−1. (a.ii) Linear regression residuals were within 5% errors of the predicted values (95% confidence interval). (a.iii) The mobile phase for HP-TLC analysis was composed of chloroform : acetone (36 : 4%, v/v), which resulted in a sharp, symmetrical and well-resolved peak of PHT at Rf values of 0.2. (b.i) The calibration curve used for HPLC measurements relying on the area of the absorbance peaks against the concentration of PHT. The standard curve was linear in the range of 0–100 μg ml−1. (b.ii) The regression residuals showing no evidence of nonlinear pattern or unequal variances. (b.iii) The mobile phase for HPLC analysis was composed of methanol : water (55 : 45%, v/v), which resulted in a sharp, symmetrical and well-resolved peak of PHT at retention time of 5.6 minutes.
Fig. 2
Fig. 2. The characterisation of NPs with different amounts of chitosan using DLS and HP-TLC. The size distribution histograms (a) showing a dominant size population for each NP preparation, and the ADS (b) showed a significant increase in the size of prepared NPs as a function of the chitosan amount used in the preparation. (c) Zeta potential measurements showing that all prepared NPs carried a positive charge, which increased as the chitosan amount increased. (d) HP-TLC showed that the EE% of was independent of the chitosan amount in all NP preparations (one-way ANOVA test; *p < 0.05, **p < 0.01, ***p < 0.001, n = 3 at least).
Fig. 3
Fig. 3. The effect of lecithin on the prepared NPs. (a) NPs size distribution histogram showing a dominant population with a narrow distribution for all NPs preparation regardless of the lecithin amount. ADS, zeta potential and EE% showed no significant changes until large amounts of lecithin (35 and 50 mg) were used in the preparation. (one-way ANOVA test; *p < 0.05, **p < 0.01, ***p < 0.001, n = 3 at least). (b) TEM micrographs of NPs prepared with 35 and 50 mg of lecithin.
Fig. 4
Fig. 4. The effect of surfactants on the properties of prepared NPs. (a) NPs size distribution histograms showing highest homogeneity when tween 80 was used as a surfactant with one major population compared to multiple populations observed with tween 20 and poloxamer 188. ADS and zeta-potential measurements were comparable for all three tested surfactants. However, the EE% was significantly lower when poloxamer 188 was used in the preparation of NPs (one-way ANOVA test; *p < 0.05, **p < 0.01, ***p < 0.001, n = 3 at least). (b) TEM micrographs showing the spherical shape of NPs prepared with tween 20 and poloxamer 188.
Fig. 5
Fig. 5. The effect of PHT amount of NPs properties. (a) NPs size distribution histograms showing narrow distribution for all prepared NPs regardless of the PHT amount. ADS and zeta-potential measurements were independent of the amount of PHT. The EE%, however, increased proportionally with the amount of PHT in the preparation reaching highest EE% with 1200 μg of PHT (one-way ANOVA test; *p < 0.05, **p < 0.01, ***p < 0.001, n = 3 at least). (b) TEM micrographs showing that NPs retained the spherical shape despite the increase in PHT amount.
Fig. 6
Fig. 6. SEM size distribution histograms (a) for all prepared NPs generated from manually measuring the size of NPs from SEM micrographs (n = 120 at least). The spherical shape of the NPs were confirmed using uncoated SEM images (b), and bright field TEM images (c) on carbon/formvar-coated 300-mesh grids. The increase in chitosan amount in the NP preparations was associated with more defined NPs structure on the edges of the NPs.
Fig. 7
Fig. 7. The release profile of PHT from NPs, which were dialysed against de-ionized water. A solution of PHT in water was used for comparison. The cumulative release curve of NPs containing 5 mg of lecithin (a) and 10 mg of lecithin (b) showed that the amount of PHT released was significantly higher in NPs with low amount of chitosan compared to other NPs at all tested time points. The PHT solution showed a rapid release of PHT (99%) within 6 hours. The results are represented as mean% ± SD (n = 3 at least) (one-way ANOVA test; *p < 0.05, **p < 0.01, ***p < 0.001).
Fig. 8
Fig. 8. The accumulation of PHT in brain and blood following in administration. (a) The brain and blood accumulation of PHT following in administration of different NPs formulations showing that the highest PHT level in brain (1.01 ± 0.558% ID per g) was associated with L10Ci+. (b) PHT biodistribution in brain and blood at 5 minutes, 1 and 72 h after the in administration of L10Ci+ and the PEG200 solution, and the IP administration of commercial solution of PHT. The biodistribution profile in brain suggested a rapid accumulation of PHT in mouse brain after 5 minutes of dosing reaching maximum concentration after 1 hour for both L10Ci+ and experimental controls. Significant amount of PHT was detected after 72 h with L10Ci+ (0.607 ± 0.373% ID per g), while PHT amount decreased sharply after IP administration of PHT solution and PHT in PEG200. The results are represented as % ID per g, mean ± SD, (n = 3 at least) (*p < 0.05, **p < 0.01, ***p < 0.001).

Similar articles

Cited by

References

    1. Trinka E. Kwan P. Lee B. Dash A. Epilepsy in Asia: disease burden, management barriers, and challenges. Epilepsia. 2019;60:7–21. doi: 10.1111/epi.14458. - DOI - PubMed
    1. McAuley J. W. Elliott J. O. Patankar S. Hart S. Long L. Moore J. L. et al., Comparing patients' and practitioners' views on epilepsy concerns: a call to address memory concerns. Epilepsy Behav. 2010;19(4):580–583. doi: 10.1016/j.yebeh.2010.09.001. - DOI - PubMed
    1. Nordli D. R., Focal and Multifocal Seizures, Swaiman's Pediatric Neurology, Elsevier, 2017, pp. 531–537
    1. Carrizosa Moog J. Kakooza-Mwesige A. Tan C. T. Epilepsy in the tropics: emerging etiologies. Seizure. 2017;44:108–112. doi: 10.1016/j.seizure.2016.11.032. - DOI - PubMed
    1. Espinosa-Jovel C. Toledano R. Aledo-Serrano Á. García-Morales I. Gil-Nagel A. Epidemiological profile of epilepsy in low income populations. Seizure. 2018;56:67–72. doi: 10.1016/j.seizure.2018.02.002. - DOI - PubMed