

The Association Between Hyperuricemia and Obesity Metabolic Phenotypes in Chinese General Population: A Retrospective Analysis
- PMID: 35520285
- PMCID: PMC9063096
- DOI: 10.3389/fnut.2022.773220
The Association Between Hyperuricemia and Obesity Metabolic Phenotypes in Chinese General Population: A Retrospective Analysis
Abstract
Purpose: Serum uric acid (UA) not only affects the development of obesity but also alters the metabolic status in obese subjects; thus we investigated the relationship between serum UA and the overweight/obese metabolic phenotypes.
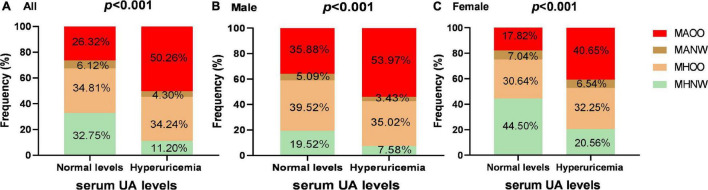
Methods: The demographic, biochemical, and hematological data were collected for 12,876 patients undergoing routine physical examination, and 6,912 participants were enrolled in our study. Participants were classified into four obesity metabolic phenotypes according to their BMI and the presence of metabolic syndrome: metabolically healthy overweight/obese (MHOO), metabolically healthy and normal weighted (MHNW), metabolically abnormal and overweight/obese (MAOO), and metabolically abnormal but normal weighted (MANW). Univariate and multivariate logistic regression analysis, stratified analysis, and also interaction analysis were conducted to analyze the relationship between serum UA and obesity metabolic phenotypes.
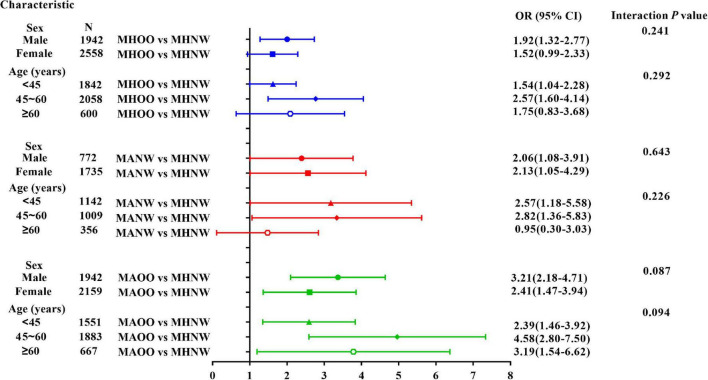
Results: Multivariable logistic regression analysis showed that hyperuricemia was positively associated with MHOO, MANW, and MAOO phenotypes relative to MHNW. After adjusting for the confounding factors, the odds ratios (OR) for individuals with hyperuricemia to be MHOO, MANW, and MAOO phenotypes were 1.86 (1.42-2.45), 2.30 (1.44-3.66), and 3.15 (2.34-4.24), respectively. The ORs for having MHOO, MANW, and MAOO increased 6% [OR: 1.06 (1.05-1.07), P < 0.0001], 5% [OR: 1.05 (1.03-1.07), P < 0.0001], and 11% [OR: 1.11 (1.10-1.13), P < 0.0001] for each 10 unit (μmol/L) of increase in serum UA level. Stratification analysis as well as an interaction test showed that sex and age did not interfere with the association of hyperuricemia with each metabolic phenotype. In terms of the components of the metabolic syndrome, after adjusting for other confounding factors including all of the metabolic indicators except itself, hyperuricemia was positively associated with increased BMI [OR: 1.66 (1.32-2.09), P < 0.0001], hypertriglyceridemia [OR: 1.56 (1.21-2.02), P = 0.0006], and hypertension [OR: 1.22 (1.03-1.46), P = 0.0233], while it had no significant association with hyperglycemia and low HDL-C (all P > 0.05).
Conclusion: In our study, we discovered that hyperuricemia was positively associated with MHOO, MANW, and MAOO phenotypes, and this relationship was independent of sex and age.
Keywords: hyperuricemia; metabolic phenotypes; obesity; overweight; uric acid.
Copyright © 2022 Feng, Yang, Xie, Zhuang, Fang, Dai, Jiang, Chen, Tang and Tang.
Conflict of interest statement
The authors declare that the research was conducted in the absence of any commercial or financial relationships that could be construed as a potential conflict of interest.
Figures
Similar articles
-
Determinants of the transition from a cardiometabolic normal to abnormal overweight/obese phenotype in a Spanish population.Eur J Nutr. 2014 Sep;53(6):1345-53. doi: 10.1007/s00394-013-0635-2. Epub 2013 Dec 10. Eur J Nutr. 2014. PMID: 24322835
-
Association between metabolic obesity phenotype, transition of metabolic phenotypes and the risk of hyperuricemia in Chinese adults: A cohort study.Medicine (Baltimore). 2022 Nov 25;101(47):e32094. doi: 10.1097/MD.0000000000032094. Medicine (Baltimore). 2022. PMID: 36451481 Free PMC article.
-
Association of metabolically abnormal but normal weight (MANW) and metabolically healthy but obese (MHO) individuals with arterial stiffness and carotid atherosclerosis.Atherosclerosis. 2014 May;234(1):218-23. doi: 10.1016/j.atherosclerosis.2014.02.033. Epub 2014 Mar 16. Atherosclerosis. 2014. PMID: 24681911
-
Circulating levels of IL-33 are elevated by obesity and positively correlated with metabolic disorders in Chinese adults.J Transl Med. 2021 Feb 4;19(1):52. doi: 10.1186/s12967-021-02711-x. J Transl Med. 2021. PMID: 33541367 Free PMC article.
-
Transitions in Metabolic Health Status and Obesity Over Time and Risk of Diabetes: The Dongfeng-Tongji Cohort Study.J Clin Endocrinol Metab. 2023 Jul 14;108(8):2024-2032. doi: 10.1210/clinem/dgad047. J Clin Endocrinol Metab. 2023. PMID: 36718514
Cited by
-
Data-Driven Technology Roadmaps to Identify Potential Technology Opportunities for Hyperuricemia Drugs.Pharmaceuticals (Basel). 2022 Nov 3;15(11):1357. doi: 10.3390/ph15111357. Pharmaceuticals (Basel). 2022. PMID: 36355529 Free PMC article.
-
Association and Interaction between Heavy Metals and Hyperuricemia in a Taiwanese Population.Diagnostics (Basel). 2023 May 15;13(10):1741. doi: 10.3390/diagnostics13101741. Diagnostics (Basel). 2023. PMID: 37238228 Free PMC article.
-
Association between hyperuricemia and metabolic syndrome: A cross-sectional study in Tibetan adults on the Tibetan plateau.Front Endocrinol (Lausanne). 2022 Oct 20;13:964872. doi: 10.3389/fendo.2022.964872. eCollection 2022. Front Endocrinol (Lausanne). 2022. PMID: 36339440 Free PMC article.
-
Chinese familial central precocious puberty with hyperuricemia due to recurrent DLK1 mutation: Case report and review of the literature.Mol Genet Genomic Med. 2022 Dec;10(12):e2087. doi: 10.1002/mgg3.2087. Epub 2022 Nov 9. Mol Genet Genomic Med. 2022. PMID: 36353763 Free PMC article. Review.
-
Remnant cholesterol elevates hyperuricemia risk in the middle aged and elderly Chinese: a longitudinal study.Sci Rep. 2024 Oct 19;14(1):24616. doi: 10.1038/s41598-024-75951-8. Sci Rep. 2024. PMID: 39427071 Free PMC article.
References
LinkOut - more resources
Full Text Sources