

Folic acid-conjugated magnetic mesoporous silica nanoparticles loaded with quercetin: a theranostic approach for cancer management
- PMID: 35520307
- PMCID: PMC9054720
- DOI: 10.1039/d0ra00664e
Folic acid-conjugated magnetic mesoporous silica nanoparticles loaded with quercetin: a theranostic approach for cancer management
Abstract
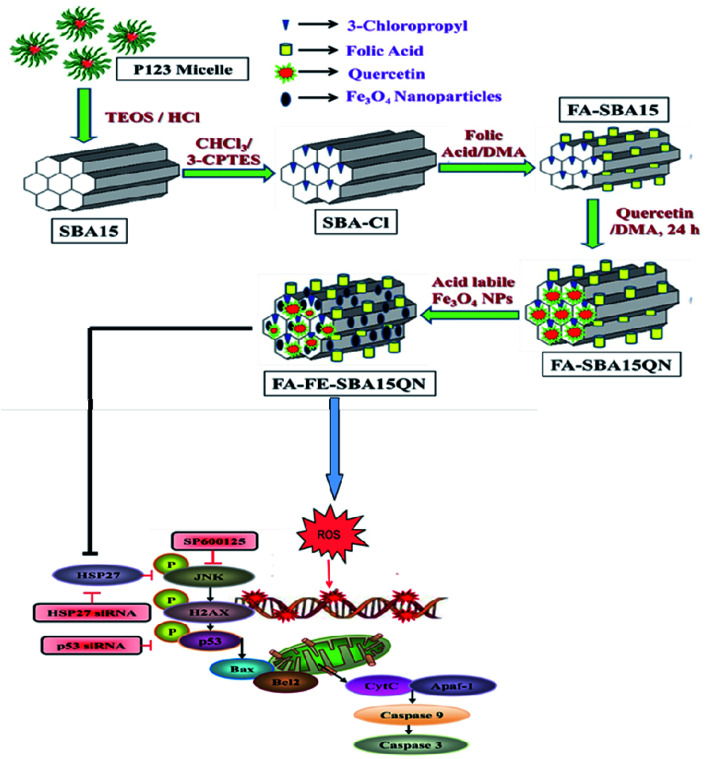
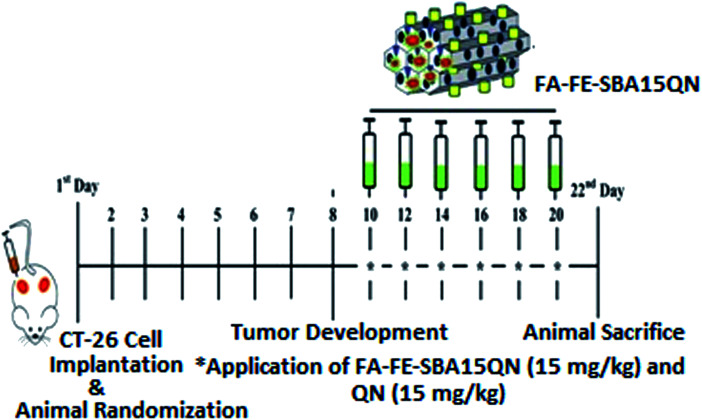
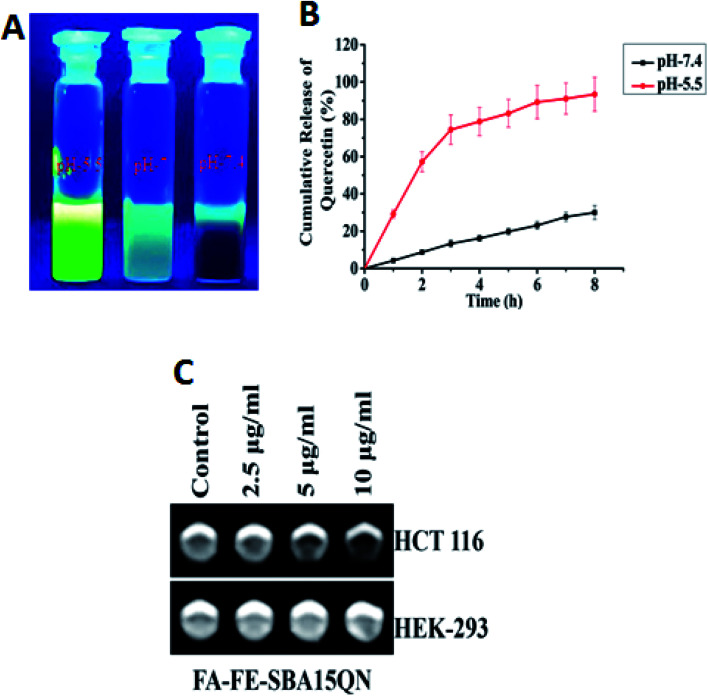
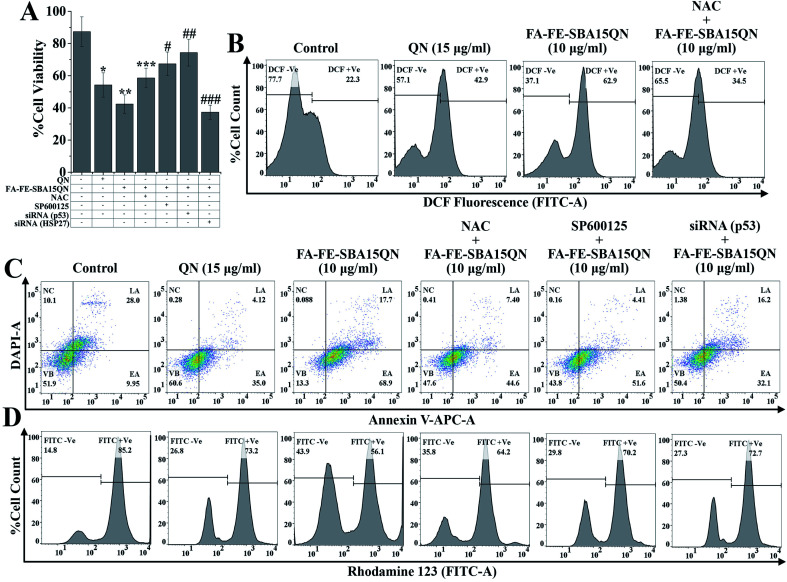
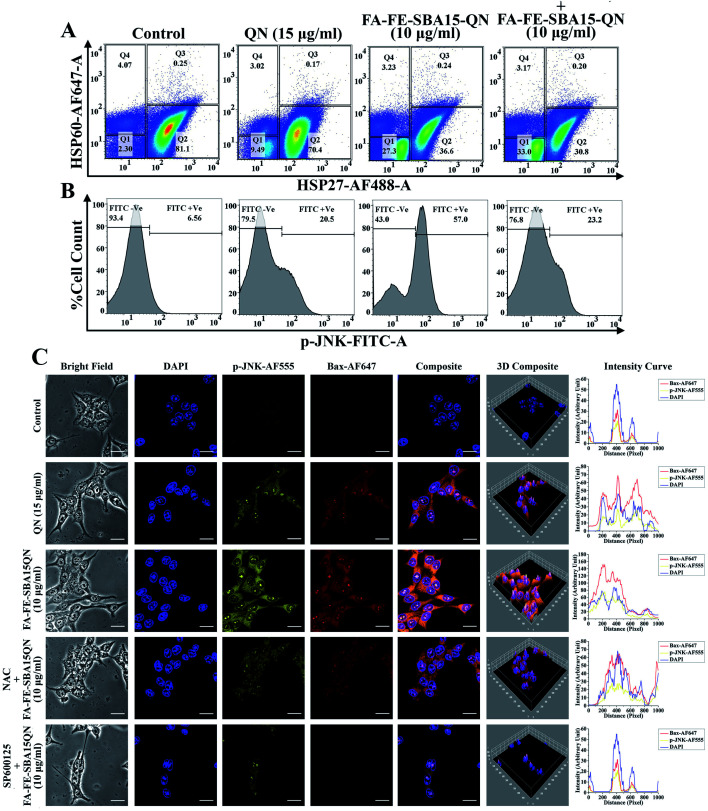
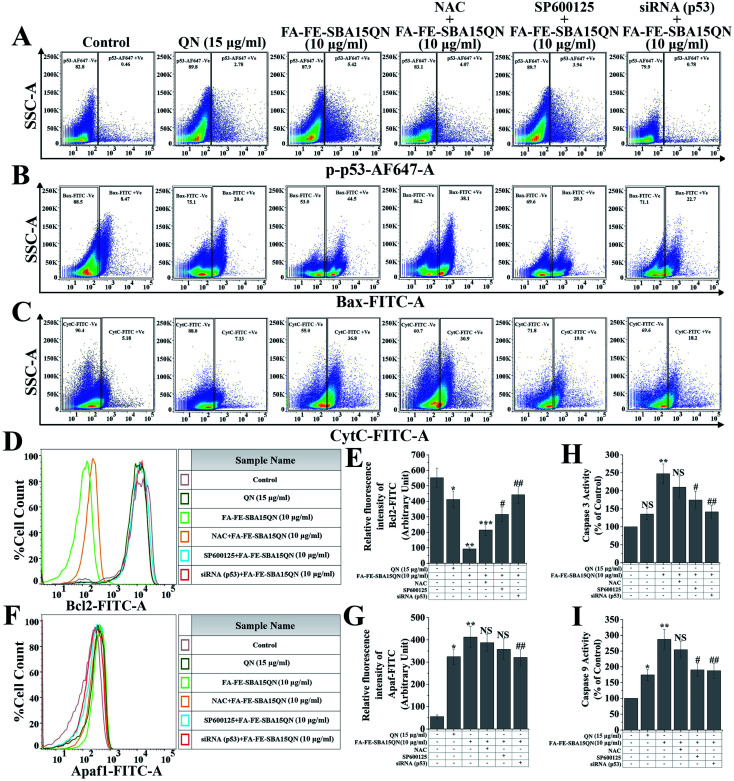
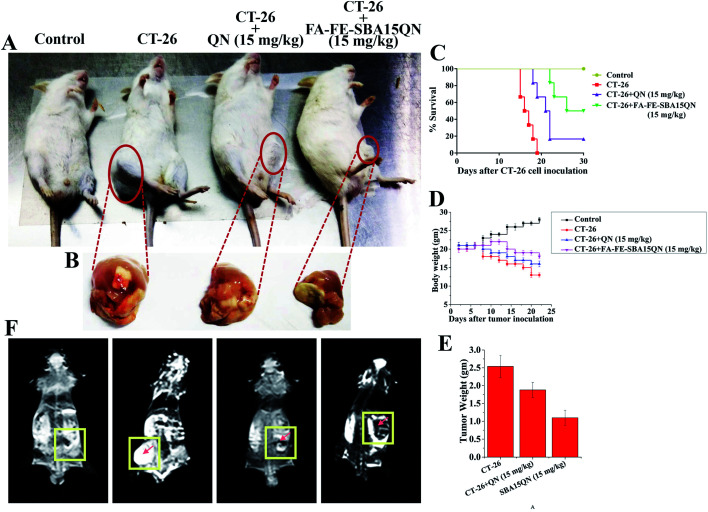
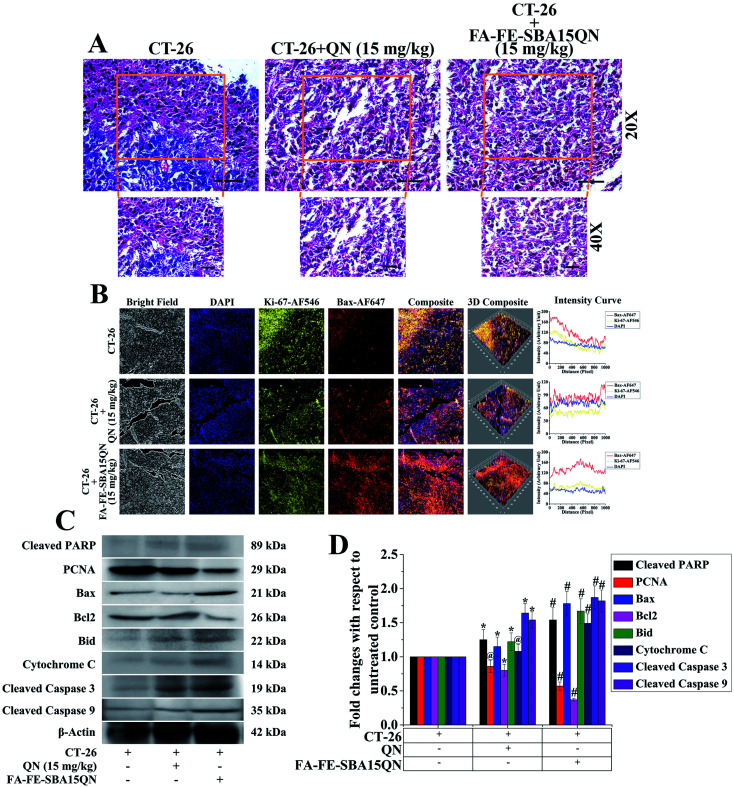
The development of drug carriers based on nanomaterials that can selectively carry chemotherapeutic agents to cancer cells has become a major focus in biomedical research. A novel pH-sensitive multifunctional envelope-type mesoporous silica nanoparticle (SBA-15) was fabricated for targeted drug delivery to human colorectal carcinoma cells (HCT-116). SBA-15 was functionalized with folic acid (FA), and the material was loaded with the water-insoluble flavonoid, quercetin (QN). Additionally, acid-labile magnetite Fe3O4 nanoparticles were embedded over the FA-functionalized QN-loaded monodisperse SBA-15 to prepare the highly orchestrated material FA-FE-SBA15QN. The in vitro and in vivo anti-carcinogenic efficacy of FA-FE-SBA15QN was carried out to explore the pH-sensitive QN release with putative mechanistic aspects. FA-FE-SBA15QN caused a marked tumor suppression, and triggered mitochondrial-dependent apoptosis through a redox-regulated cellular signaling system. Furthermore, FA-IO-SBA-15-QN initiated the c-Jun N-terminal Kinase (JNK)-guided H2AX phosphorylation, which relayed the downstream apoptotic signal to the phosphorylate tumor suppressor protein, p53. On the other hand, the selective inhibition of heat shock protein-27 (HSP-27) by FA-FE-SBA15QN augmented the apoptotic fate through JNK/H2AX/p53 axis. The in vitro and in vivo magnetic resonance imaging (MRI) studies have indicated the theranostic perspective of the composite. Thus, the result suggested that the newly synthesized FA-FE-SBA15QN could be used as a promising chemo theranostic material for the management of carcinoma.
This journal is © The Royal Society of Chemistry.
Conflict of interest statement
There are no conflicts to declare.
Figures
Similar articles
-
Mesoporous SBA-15 Silica-Loaded Nano-formulation of Quercetin: A Probable Radio-Sensitizer for Lung Carcinoma.Dose Response. 2022 Jan 18;20(1):15593258211050532. doi: 10.1177/15593258211050532. eCollection 2022 Jan-Mar. Dose Response. 2022. PMID: 35110975 Free PMC article.
-
Targeted delivery of quercetin loaded mesoporous silica nanoparticles to the breast cancer cells.Biochim Biophys Acta. 2016 Oct;1860(10):2065-75. doi: 10.1016/j.bbagen.2016.07.001. Epub 2016 Jul 5. Biochim Biophys Acta. 2016. PMID: 27392941
-
Folic acid decorated magnetic nanosponge: An efficient nanosystem for targeted curcumin delivery and magnetic resonance imaging.J Colloid Interface Sci. 2019 Nov 15;556:128-139. doi: 10.1016/j.jcis.2019.08.046. Epub 2019 Aug 13. J Colloid Interface Sci. 2019. PMID: 31437658
-
pH-Sensitive Magnetite Nanoparticles Modified with Hyperbranched Polymers and Folic Acid for Targeted Imaging and Therapy.Curr Drug Deliv. 2019;16(9):839-848. doi: 10.2174/1567201816666191002102353. Curr Drug Deliv. 2019. PMID: 31577207
-
Design and construction of multifunctional hyperbranched polymers coated magnetite nanoparticles for both targeting magnetic resonance imaging and cancer therapy.J Colloid Interface Sci. 2017 Mar 15;490:64-73. doi: 10.1016/j.jcis.2016.11.014. Epub 2016 Nov 10. J Colloid Interface Sci. 2017. PMID: 27870961
Cited by
-
Mesoporous Silica Nanoparticles: Properties and Strategies for Enhancing Clinical Effect.Pharmaceutics. 2021 Apr 17;13(4):570. doi: 10.3390/pharmaceutics13040570. Pharmaceutics. 2021. PMID: 33920503 Free PMC article. Review.
-
Progress in Mesoporous Silica Nanoparticles as Drug Delivery Agents for Cancer Treatment.Pharmaceutics. 2021 Jan 24;13(2):152. doi: 10.3390/pharmaceutics13020152. Pharmaceutics. 2021. PMID: 33498885 Free PMC article. Review.
-
Combinatorial Delivery of Docetaxel- and Erlotinib-Loaded Functionalized Nanostructured Lipid Carriers for the Treatment of Triple-Negative Breast Cancer Using Quality-by-Design Approach.Pharmaceutics. 2024 Jul 11;16(7):926. doi: 10.3390/pharmaceutics16070926. Pharmaceutics. 2024. PMID: 39065626 Free PMC article.
-
Cytotoxicity Mechanisms of Blue-Light-Activated Curcumin in T98G Cell Line: Inducing Apoptosis through ROS-Dependent Downregulation of MMP Pathways.Int J Mol Sci. 2023 Feb 14;24(4):3842. doi: 10.3390/ijms24043842. Int J Mol Sci. 2023. PMID: 36835252 Free PMC article.
-
A comparative assessment of in vitro cytotoxic activity and phytochemical profiling of Andrographis nallamalayana J.L.Ellis and Andrographis paniculata (Burm. f.) Nees using UPLC-QTOF-MS/MS approach.RSC Adv. 2021 Nov 8;11(57):35918-35936. doi: 10.1039/d1ra07496b. eCollection 2021 Nov 4. RSC Adv. 2021. PMID: 35492784 Free PMC article.
References
LinkOut - more resources
Full Text Sources
Research Materials
Miscellaneous