

The synthesis, characterization, DNA/BSA/HSA interactions, molecular modeling, antibacterial properties, and in vitro cytotoxic activities of novel parent and niosome nano-encapsulated Ho(iii) complexes
- PMID: 35520355
- PMCID: PMC9054688
- DOI: 10.1039/d0ra03436c
The synthesis, characterization, DNA/BSA/HSA interactions, molecular modeling, antibacterial properties, and in vitro cytotoxic activities of novel parent and niosome nano-encapsulated Ho(iii) complexes
Abstract
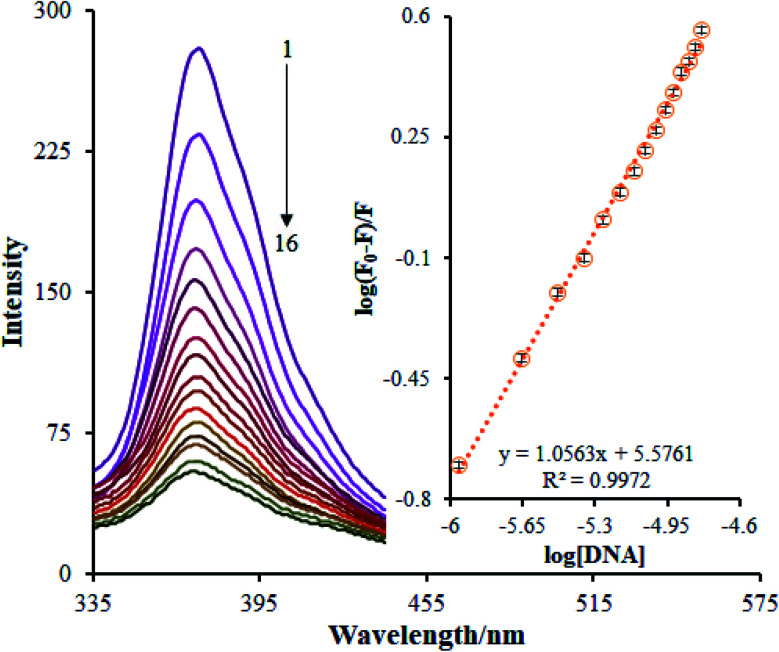
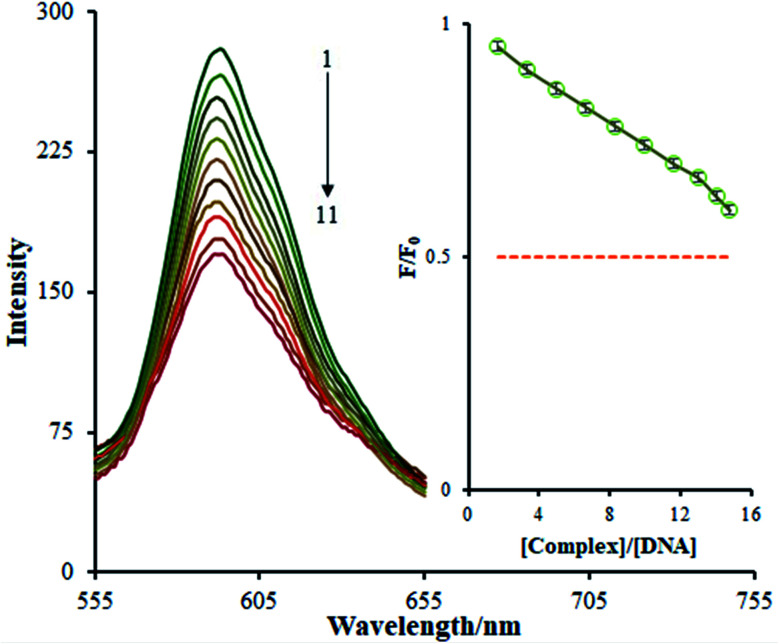
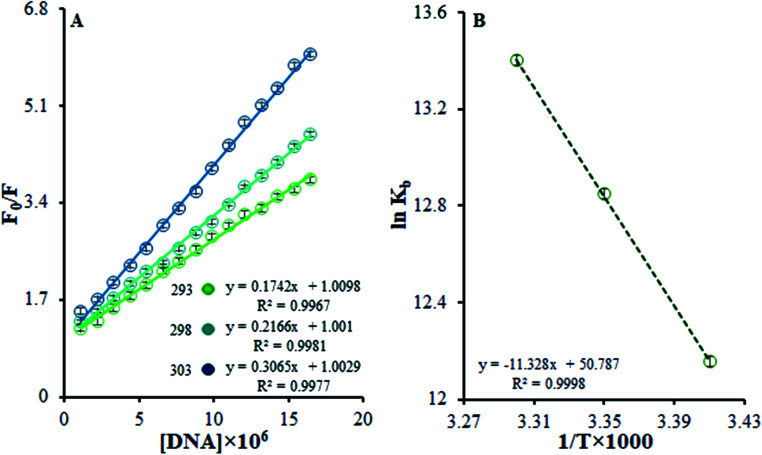
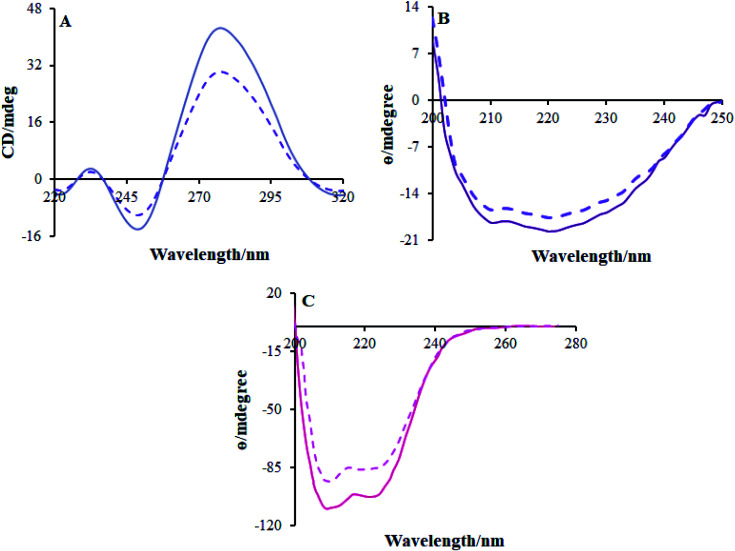
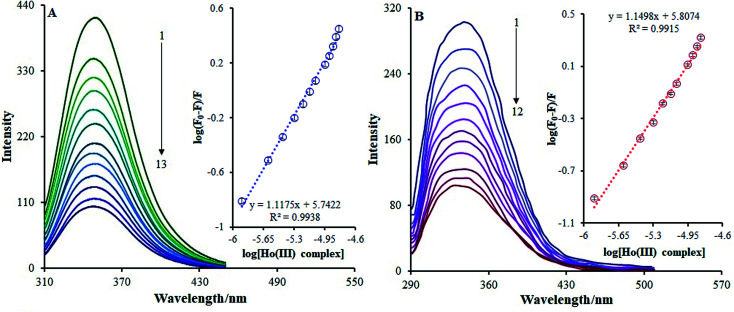
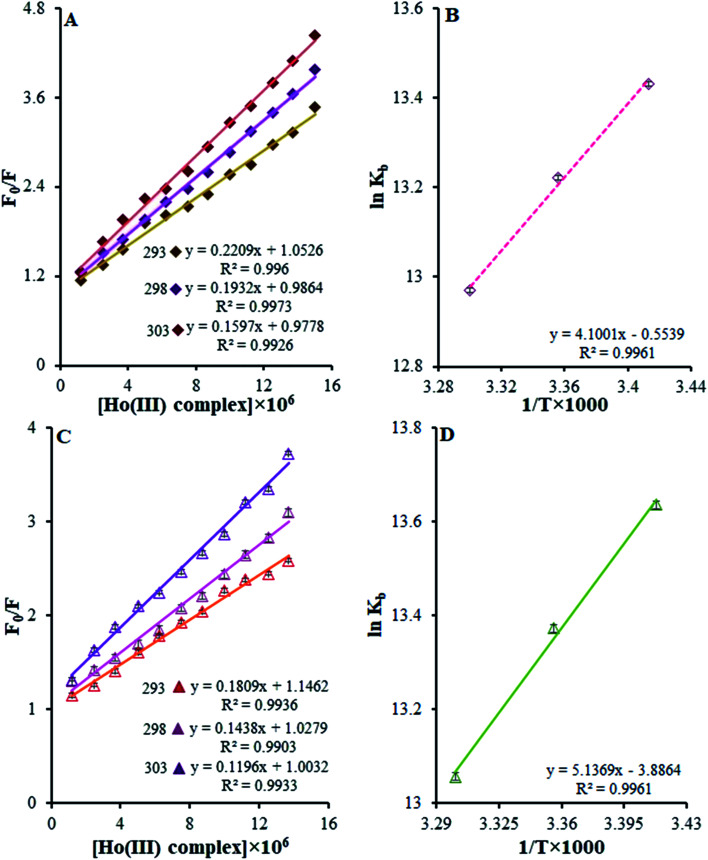
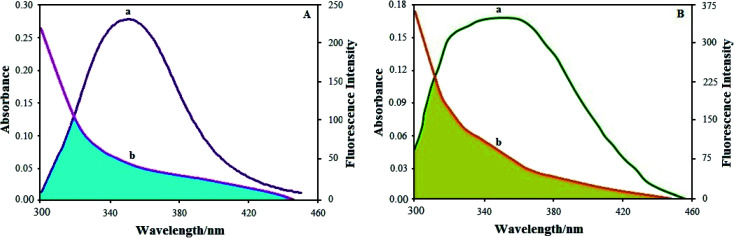
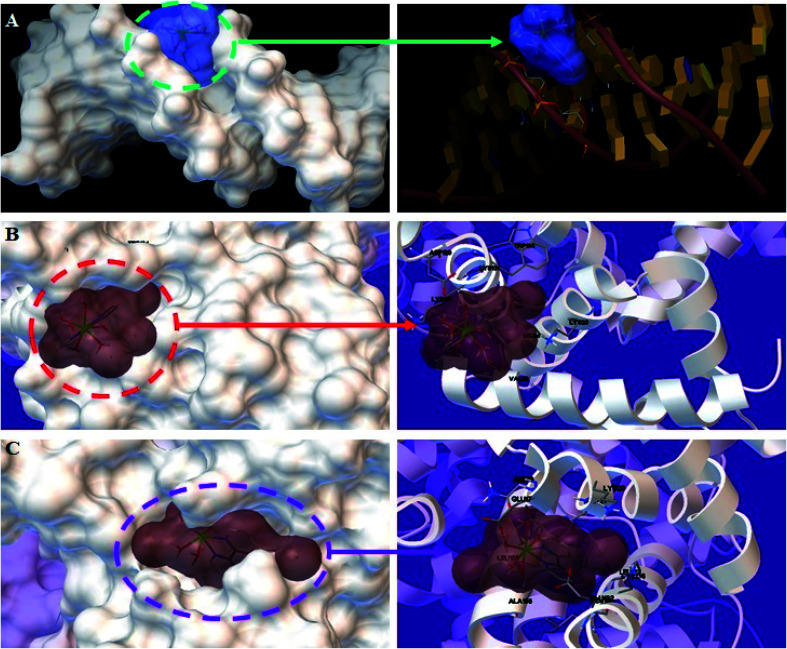
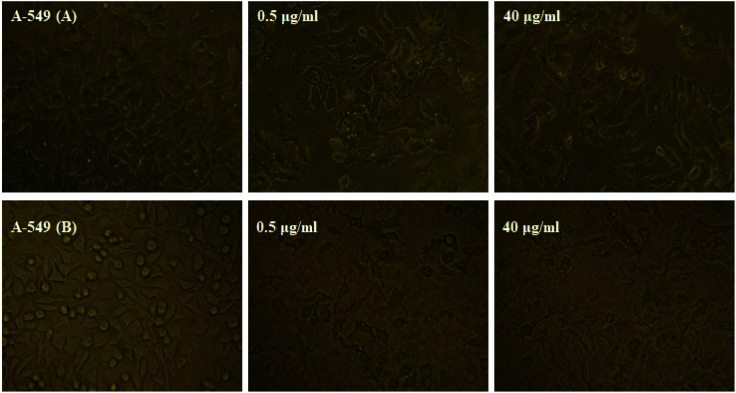
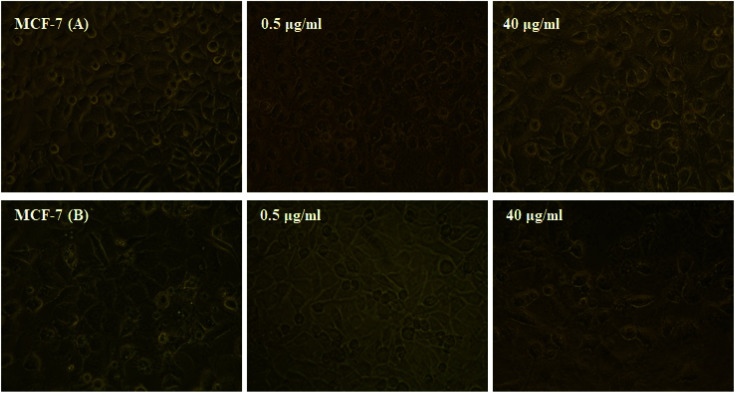
Based on the importance of metal-centered complexes that can interact with DNA, this research focused on the synthesis of a new Ho(iii) complex. This complex was isolated and characterized via elemental analysis, and FT-IR, fluorescence, and UV-vis spectroscopy. Additional confirmation of the Ho(iii) complex structure was obtained via single-crystal X-ray diffraction. DNA interaction studies were carried out via circular dichroism (CD) spectroscopy, UV-vis absorption spectroscopy, viscosity measurements and emission spectroscopy; it was proposed that the metal complex acts as an effective DNA binder based on studies in the presence of fish DNA (FS-DNA), showing high binding affinity to DNA in the presence of hydrophobic and electron donating substituents. Also, the interactions of this complex with human (HSA) and bovine serum albumin (BSA) proteins were studied via fluorescence spectroscopy techniques and the obtained results reveal an excellent propensity for binding in both cases. Furthermore, the interactions of the Ho(iii) complex with DNA, BSA and HSA were confirmed via molecular docking analysis. The antimicrobial activities of the Ho(iii) complex were tested against Gram-negative bacteria and Gram-positive bacteria. In addition, a niosome nano-encapsulated Ho(iii) complex was synthesized, and the parent and encapsulated complexes were evaluated as potential antitumor candidates. The main structure of the Ho(iii) complex is maintained after encapsulation using niosome nanoparticles. The MTT method was used to assess the anticancer properties of the Ho(iii) complex and its encapsulated form toward human lung carcinoma and breast cancer cell lines. The anticancer activity in the encapsulated form was more than that of the parent Ho(iii) complex. In conclusion, these compounds could be considered as new antitumor candidates.
This journal is © The Royal Society of Chemistry.
Conflict of interest statement
The authors declare that they have no known competing financial interests or personal relationships that could have appeared to influence the work reported in this paper.
Figures
Similar articles
-
Parent and nano-encapsulated ytterbium(iii) complex toward binding with biological macromolecules, in vitro cytotoxicity, cleavage and antimicrobial activity studies.RSC Adv. 2020 Jun 17;10(39):23002-23015. doi: 10.1039/d0ra03895d. eCollection 2020 Jun 16. RSC Adv. 2020. PMID: 35520322 Free PMC article.
-
In vitro anticancer activity of parent and nano-encapsulated samarium(iii) complex towards antimicrobial activity studies and FS-DNA/BSA binding affinity.RSC Adv. 2020 Aug 28;10(53):31979-31990. doi: 10.1039/d0ra05280a. eCollection 2020 Aug 26. RSC Adv. 2020. PMID: 35518188 Free PMC article.
-
Evaluation of parent and nano-encapsulated terbium(III) complex toward its photoluminescence properties, FS-DNA, BSA binding affinity, and biological applications.J Trace Elem Med Biol. 2020 Sep;61:126564. doi: 10.1016/j.jtemb.2020.126564. Epub 2020 May 21. J Trace Elem Med Biol. 2020. PMID: 32485498
-
In vitro anticancer and antibacterial activates of the yttrium(III) complex and its nano-carriers toward DNA cleavage and biological interactions with DNA and BSA; An experimental and computational studie.J Trace Elem Med Biol. 2021 Dec;68:126821. doi: 10.1016/j.jtemb.2021.126821. Epub 2021 Jul 16. J Trace Elem Med Biol. 2021. PMID: 34315038
-
In vitro cytotoxicity studies of parent and nanoencapsulated Holmium-2,9-dimethyl-1,10-phenanthroline complex toward fish-salmon DNA-binding properties and antibacterial activity.J Biomol Struct Dyn. 2019 Oct;37(17):4437-4449. doi: 10.1080/07391102.2018.1557077. Epub 2019 Jan 16. J Biomol Struct Dyn. 2019. PMID: 30526398
Cited by
-
Response of Ancillary Azide Ligand in Designing a 1D Copper(II) Polymeric Complex along with the Introduction of High DNA- and HAS-Binding Efficacy, Leading to Impressive Anticancer Activity: A Compact Experimental and Theoretical Approach.ACS Omega. 2022 Jun 28;7(27):23276-23288. doi: 10.1021/acsomega.2c01403. eCollection 2022 Jul 12. ACS Omega. 2022. PMID: 35847281 Free PMC article.
-
Synthesis and characterization of the new ligand, 1,2,4-triazino[5,6-b]indol-3-ylimino methyl naphthalene-2-ol and its Ni(II) and Cu(II) complexes: comparative studies of their in vitro DNA and HSA Binding.Biometals. 2022 Dec;35(6):1199-1223. doi: 10.1007/s10534-022-00437-x. Epub 2022 Sep 8. Biometals. 2022. PMID: 36074281
-
A DNA Biosensor Based on a Raspberry-like Hierarchical Nano-structure for the Determination of the Anticancer Drug Nilotinib.ChemistryOpen. 2022 Mar;11(3):e202100261. doi: 10.1002/open.202100261. ChemistryOpen. 2022. PMID: 35333006 Free PMC article.
-
Parent and nano-encapsulated ytterbium(iii) complex toward binding with biological macromolecules, in vitro cytotoxicity, cleavage and antimicrobial activity studies.RSC Adv. 2020 Jun 17;10(39):23002-23015. doi: 10.1039/d0ra03895d. eCollection 2020 Jun 16. RSC Adv. 2020. PMID: 35520322 Free PMC article.
-
In vitro anticancer activity of parent and nano-encapsulated samarium(iii) complex towards antimicrobial activity studies and FS-DNA/BSA binding affinity.RSC Adv. 2020 Aug 28;10(53):31979-31990. doi: 10.1039/d0ra05280a. eCollection 2020 Aug 26. RSC Adv. 2020. PMID: 35518188 Free PMC article.
References
-
- Conoci S. Mascali A. Pappalardo F. RSC Adv. 2014;4:2845. doi: 10.1039/C3RA45247F. - DOI
LinkOut - more resources
Full Text Sources