

Naphthalimide-based optical turn-on sensor for monosaccharide recognition using boronic acid receptor
- PMID: 35520557
- PMCID: PMC9064670
- DOI: 10.1039/c9ra01757g
Naphthalimide-based optical turn-on sensor for monosaccharide recognition using boronic acid receptor
Abstract
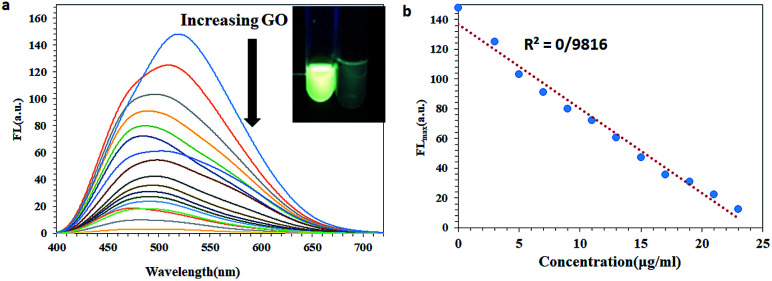
A highly selective and sensitive fluorescent sensor for the determination of fructose is developed. The fluorescent sensor was prepared by incorporating a new naphthalimide dye with a planar structure as a selectophore and graphene oxide (GO) nanoplatelets as a quencher for rapid optical detection of fructose. The designed probe, made with the high fusion loop-containing dye, along with the GO nanoplatelets, detected fructose over the other monosaccharides very well. The proposed sensor displays a linear response range of 7 × 10⁻⁵ to 3 × 10⁻² M with a low limit of detection of 23 × 10-6 M in solution at pH 7.4. This sensor shows a good selectivity towards fructose with respect to other saccharides. The proposed sensor was then applied to the determination of fructose in human plasma with satisfactory results.
This journal is © The Royal Society of Chemistry.
Conflict of interest statement
There are no conflicts to declare.
Figures


Similar articles
-
A new fluorescent boronic acid sensor based on carbazole for glucose sensing via aggregation-induced emission.RSC Adv. 2022 Sep 14;12(40):26201-26205. doi: 10.1039/d2ra04110c. eCollection 2022 Sep 12. RSC Adv. 2022. PMID: 36275092 Free PMC article.
-
A new boronic acid fluorescent sensor based on fluorene for monosaccharides at physiological pH.Spectrochim Acta A Mol Biomol Spectrosc. 2015 Jun 5;144:53-60. doi: 10.1016/j.saa.2015.02.066. Epub 2015 Feb 25. Spectrochim Acta A Mol Biomol Spectrosc. 2015. PMID: 25748592
-
Selective fluorescence detection of monosaccharides using a material composite formed between graphene oxide and boronate-based receptors.ACS Appl Mater Interfaces. 2014 Jul 9;6(13):10078-82. doi: 10.1021/am500801g. Epub 2014 Jun 25. ACS Appl Mater Interfaces. 2014. PMID: 24918717
-
Fluorene-based boronic acids as fluorescent chemosensor for monosaccharides at physiological pH.Luminescence. 2015 Aug;30(5):549-55. doi: 10.1002/bio.2776. Epub 2014 Sep 29. Luminescence. 2015. PMID: 25264138
-
A simple ratiometric fluorescent sensor for fructose based on complexation of 10-hydroxybenzo[h]quinoline with boronic acid.Spectrochim Acta A Mol Biomol Spectrosc. 2017 Jun 5;180:199-203. doi: 10.1016/j.saa.2017.03.017. Epub 2017 Mar 7. Spectrochim Acta A Mol Biomol Spectrosc. 2017. PMID: 28285244
Cited by
-
Synthesis, Solvatochromism and Fluorescence Quenching Studies of Naphthalene Diimide Dye by Nano graphene oxide.J Fluoresc. 2023 Sep;33(5):2003-2014. doi: 10.1007/s10895-023-03197-0. Epub 2023 Mar 25. J Fluoresc. 2023. PMID: 36964846
-
A Highly Water-Soluble and Solid State Emissive 1,8-Naphthalimide as a Fluorescent PET Probe for Determination of pHs, Acid/Base Vapors, and Water Content in Organic Solvents.Molecules. 2022 Jun 30;27(13):4229. doi: 10.3390/molecules27134229. Molecules. 2022. PMID: 35807479 Free PMC article.
-
Fluorescent Probes as a Tool in Diagnostic and Drug Delivery Systems.Pharmaceuticals (Basel). 2023 Mar 1;16(3):381. doi: 10.3390/ph16030381. Pharmaceuticals (Basel). 2023. PMID: 36986481 Free PMC article. Review.
-
A new fluorescent boronic acid sensor based on carbazole for glucose sensing via aggregation-induced emission.RSC Adv. 2022 Sep 14;12(40):26201-26205. doi: 10.1039/d2ra04110c. eCollection 2022 Sep 12. RSC Adv. 2022. PMID: 36275092 Free PMC article.
References
-
- Ruizang B. Yu G. F. J. Nutr. Food Sci. 2018;8:65.
LinkOut - more resources
Full Text Sources
Other Literature Sources