

Biofilm formation potential and chlorine resistance of typical bacteria isolated from drinking water distribution systems
- PMID: 35520667
- PMCID: PMC9056398
- DOI: 10.1039/d0ra04985a
Biofilm formation potential and chlorine resistance of typical bacteria isolated from drinking water distribution systems
Abstract
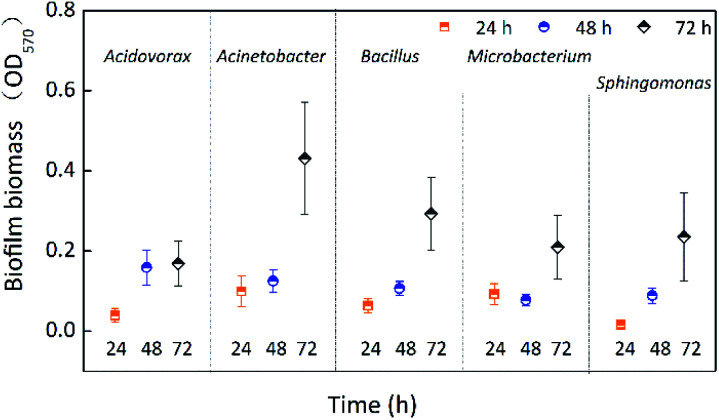
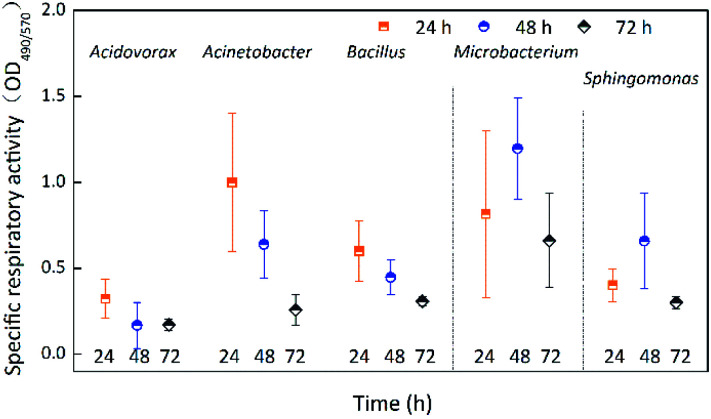
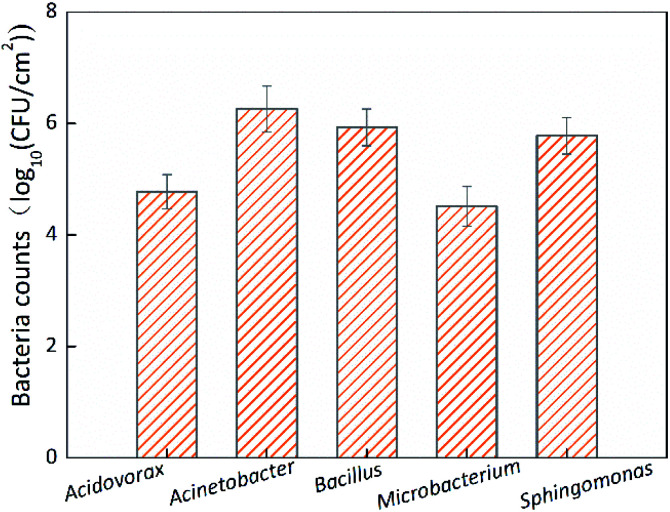
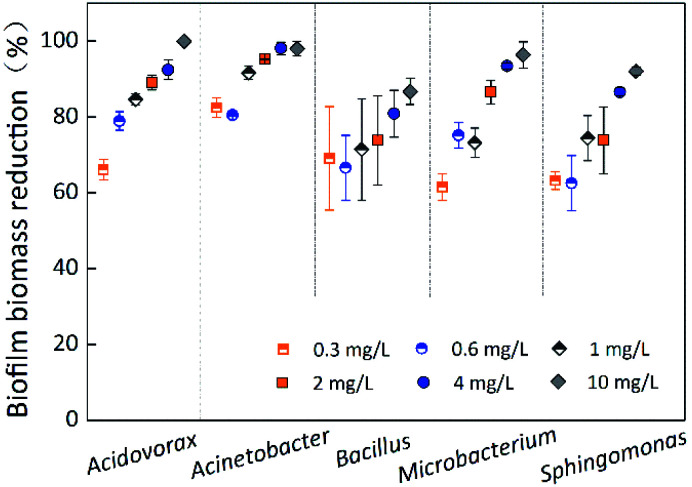
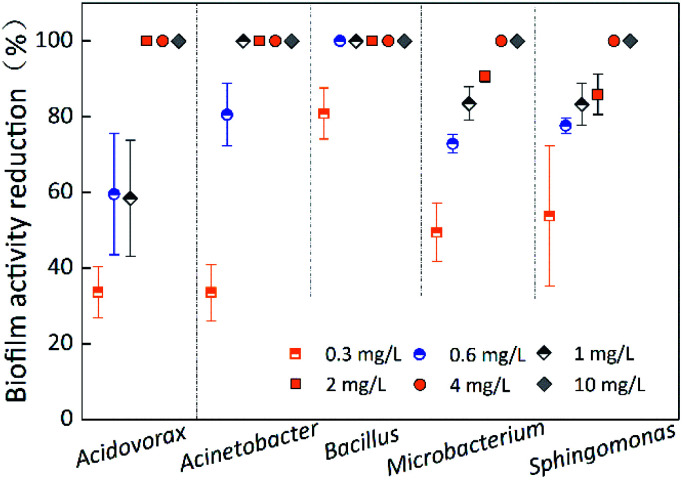
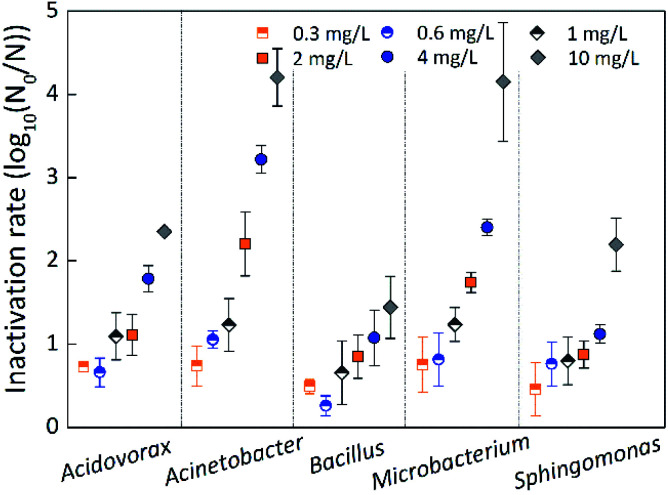
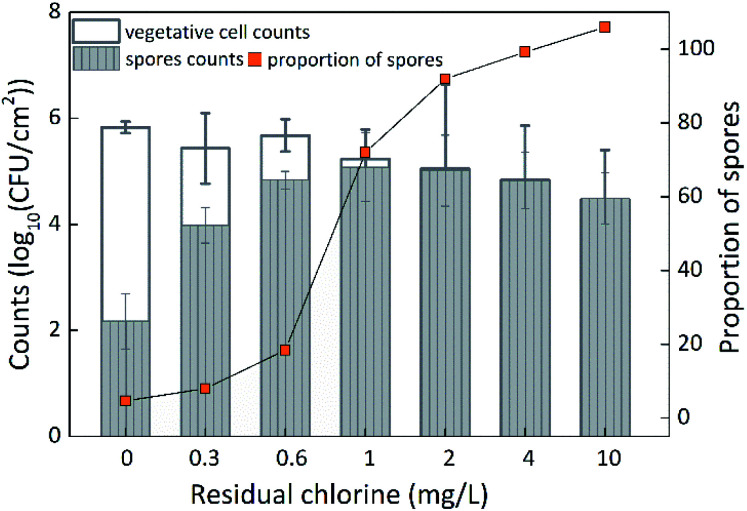
Biofilms are the main carrier of microbial communities throughout drinking water distribution systems (DWDSs), and strongly affect the safety of drinking water. Understanding biofilm formation potential and chlorine resistance is necessary for exploring future disinfection strategies and preventing water-borne diseases. This study investigated biofilm formation of five bacterial strains isolated from a simulated DWDS at different incubation times (24 h, 48 h, and 72 h), then evaluated chlorine resistance of 72 h incubated biofilms under chlorine concentrations of 0.3, 0.6, 1, 2, 4, and 10 mg L-1. All five bacterial strains had biofilm formation potential when incubated for 72 h. The biofilm formation potential of Acinetobacter sp. was stronger than that of Bacillus cereus, Microbacterium sp. and Sphingomonas sp. were moderate, and that of Acidovorax sp. was weak. In contrast, the order of chlorine resistance was Bacillus sp. > Sphingomonas sp. > Microbacterium sp. > Acidovorax sp. > Acinetobacter sp. Thus, the chlorine resistance of a single-species biofilm has little relation with the biofilm formation potential. The biofilm biomass is not a major factor affecting chlorine resistance. Moreover, the chlorine resistance of a single-species biofilm is highly related to the physiological state of bacterial cells, such as their ability to form spores or secrete extracellular polymeric substances, which could reduce the sensitivity of the single-species biofilm to a disinfectant or otherwise protect the biofilm.
This journal is © The Royal Society of Chemistry.
Conflict of interest statement
The authors declare that there are no conflicts of interest.
Figures
Similar articles
-
Effects of bacterial community composition and structure in drinking water distribution systems on biofilm formation and chlorine resistance.Chemosphere. 2021 Feb;264(Pt 1):128410. doi: 10.1016/j.chemosphere.2020.128410. Epub 2020 Sep 24. Chemosphere. 2021. PMID: 33002803
-
Thermal energy recovery from chlorinated drinking water distribution systems: Effect on chlorine and microbial water and biofilm characteristics.Environ Res. 2020 Aug;187:109655. doi: 10.1016/j.envres.2020.109655. Epub 2020 May 15. Environ Res. 2020. PMID: 32450425
-
Reduced Efficiency of Chlorine Disinfection of Naegleria fowleri in a Drinking Water Distribution Biofilm.Environ Sci Technol. 2015 Sep 15;49(18):11125-31. doi: 10.1021/acs.est.5b02947. Epub 2015 Sep 2. Environ Sci Technol. 2015. PMID: 26287820
-
The control of red water occurrence and opportunistic pathogens risks in drinking water distribution systems: A review.J Environ Sci (China). 2021 Dec;110:92-98. doi: 10.1016/j.jes.2021.03.018. Epub 2021 Mar 26. J Environ Sci (China). 2021. PMID: 34593198 Review.
-
Impact of biofilm formation and detachment on the transmission of bacterial antibiotic resistance in drinking water distribution systems.Chemosphere. 2018 Jul;203:368-380. doi: 10.1016/j.chemosphere.2018.03.143. Epub 2018 Mar 22. Chemosphere. 2018. PMID: 29627603 Review.
Cited by
-
Robust immobilization of anionic silver nanoparticles on cellulose filter paper toward a low-cost point-of-use water disinfection system with improved anti-biofouling properties.RSC Adv. 2021 Jan 25;11(9):4873-4882. doi: 10.1039/d0ra09152a. eCollection 2021 Jan 25. RSC Adv. 2021. PMID: 35424442 Free PMC article.
-
Effect of household pipe materials on formation and chlorine resistance of the early-stage biofilm: various interspecific interactions exhibited by the same microbial biofilm in different pipe materials.Arch Microbiol. 2024 Jun 10;206(7):295. doi: 10.1007/s00203-024-04013-4. Arch Microbiol. 2024. PMID: 38856934
-
Comparative Genomic Analysis of Biofilm-Forming Polar Microbacterium sp. Strains PAMC22086 and PAMC21962 Isolated from Extreme Habitats.Microorganisms. 2023 Jul 5;11(7):1757. doi: 10.3390/microorganisms11071757. Microorganisms. 2023. PMID: 37512929 Free PMC article.
-
The Role of Chlorine in the Formation and Development of Tap Water Biofilms under Different Flow Regimes.Microorganisms. 2023 Oct 31;11(11):2680. doi: 10.3390/microorganisms11112680. Microorganisms. 2023. PMID: 38004692 Free PMC article.
-
Full-length 16S rRNA gene sequencing reveals the operating mode and chlorination-aggravated SWRO biofouling at a nuclear power plant.Water Sci Technol. 2024 Jul;90(1):1-17. doi: 10.2166/wst.2024.185. Epub 2024 Jun 7. Water Sci Technol. 2024. PMID: 39007303
References
LinkOut - more resources
Full Text Sources