

Graphene oxide quantum dots immobilized on mesoporous silica: preparation, characterization and electroanalytical application
- PMID: 35520679
- PMCID: PMC9056381
- DOI: 10.1039/d0ra04605a
Graphene oxide quantum dots immobilized on mesoporous silica: preparation, characterization and electroanalytical application
Abstract
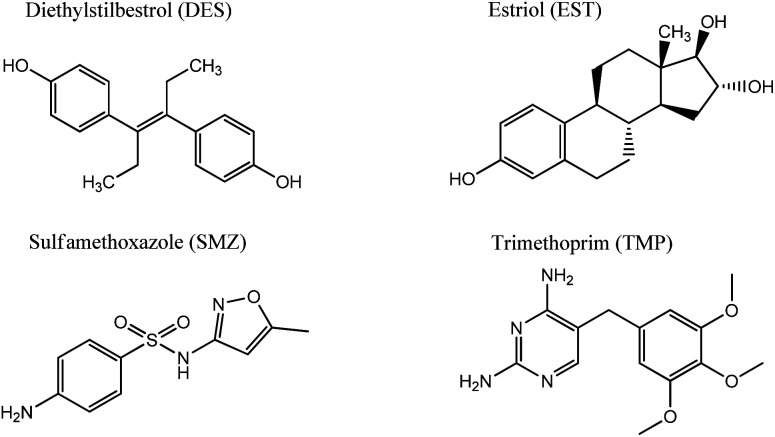
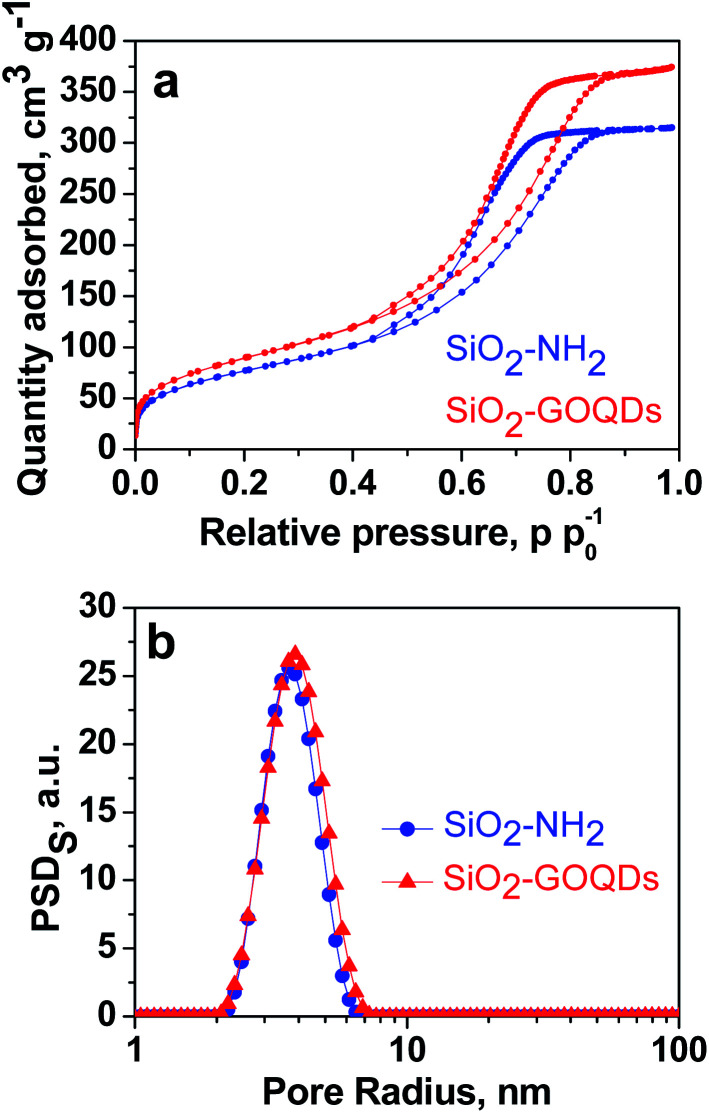
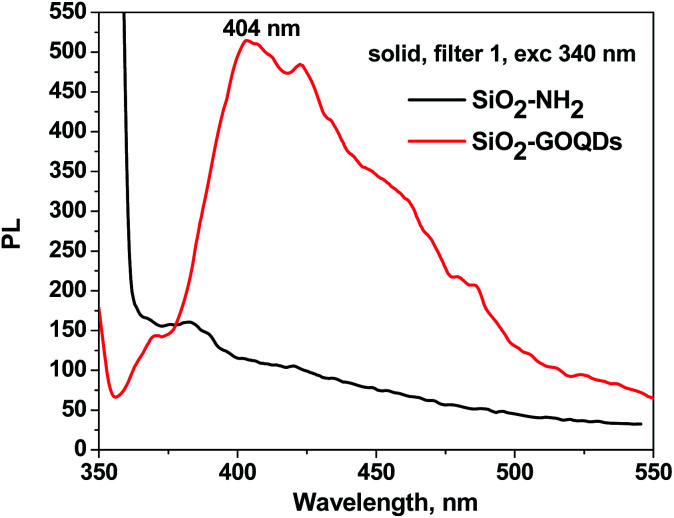
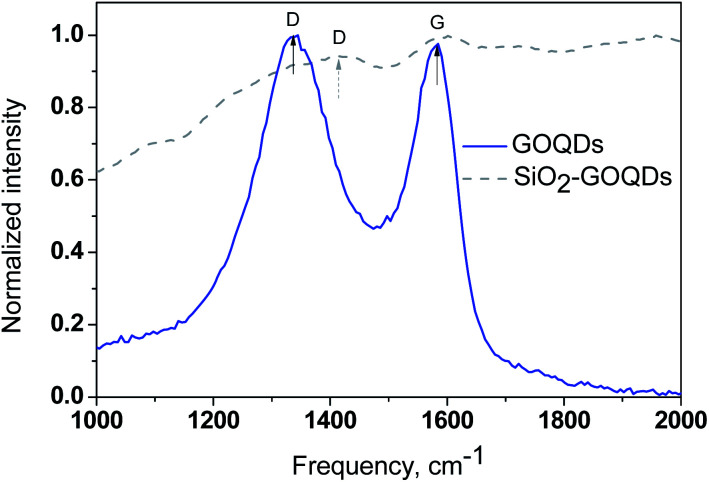
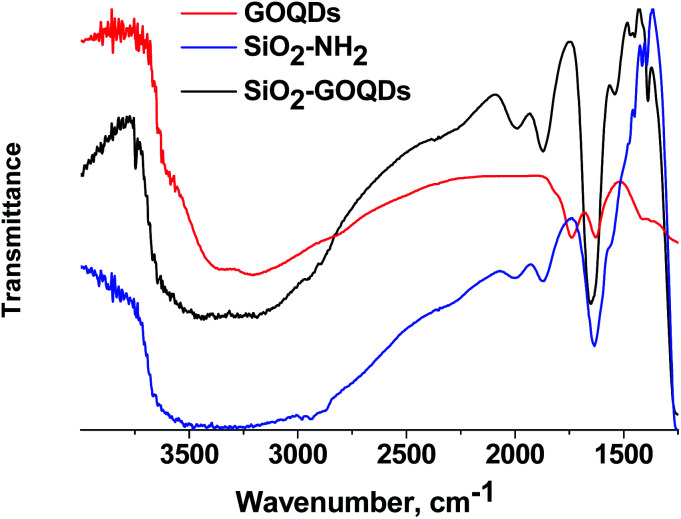
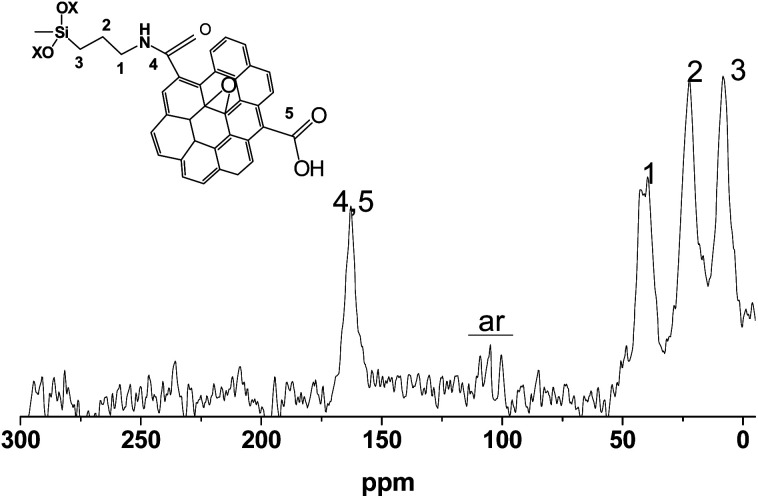
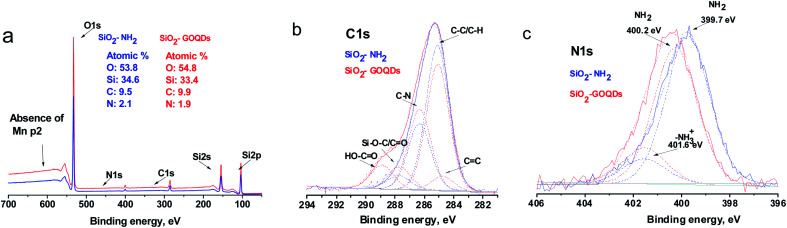
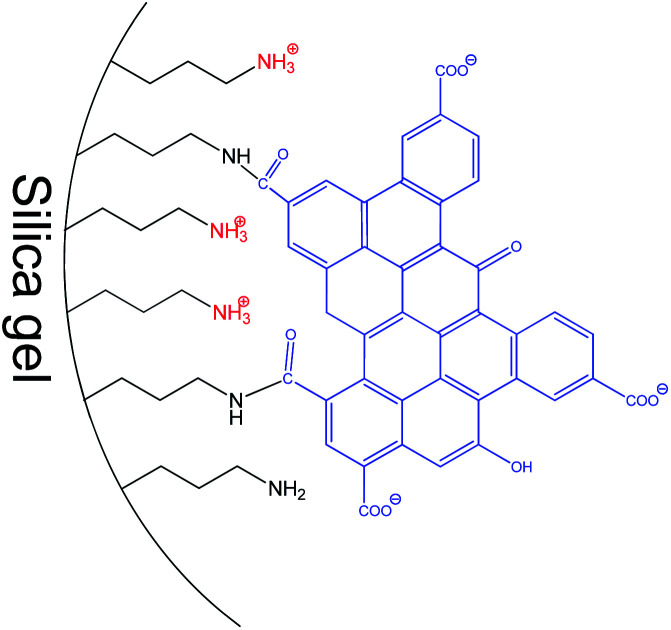
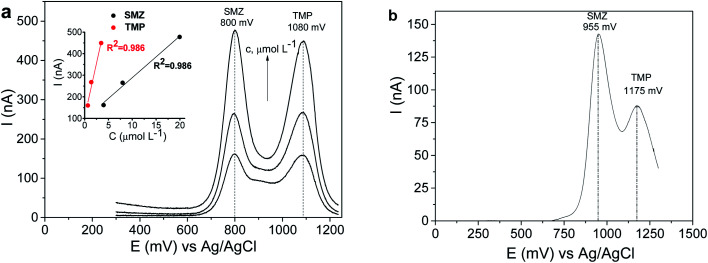
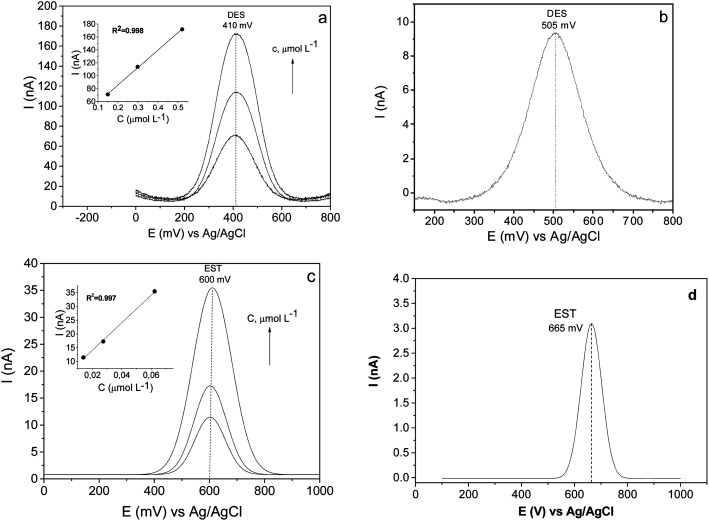
Because of its high surface area and combination of various functional groups, graphene oxide (GO) is currently one of the most actively studied materials for electroanalytical applications. It is not practical to utilize self-supported GO on its own and thus it is commonly integrated with different supporting carriers. Having a large lateral size, GO can only wrap the particles of the support and thus can significantly reduce the surface area of porous materials. To achieve synergy from the high surface area and polyfunctional nature of GO, and the rigid structure of a porous support, the lateral size of GO must essentially be decreased. Recently reported graphene oxide quantum dots (GOQDs) can fulfil this task. Here we report the successful preparation of an SiO2-GOQDs hybrid, where GOQDs have been incorporated into the mesoporous network of silica. The SiO2-GOQDs emit a strong luminescence with a band maximum at 404 nm. The Raman spectrum of SiO2-GOQDs shows two distinct peaks at 1585 cm-1 (G-peak) and 1372 cm-1 (D-peak), indicating the presence of a graphene ordered basal plane with aromatic sp2-domains and a disordered oxygen-containing structure. Covalent immobilization of GOQDs onto aminosilica via such randomly structured oxygen fragments was proven with the help of Fourier transform infrared spectroscopy, solid-state cross-polarization magic angle spinning 13C nuclear magnetic resonance, and X-ray photoelectron spectroscopy. SiO2-GOQDs were used as a modifier of a carbon paste electrode for differential pulse voltammetry determination of two antibiotics (sulfamethoxazole and trimethoprim) and two endocrine disruptors (diethylstilbestrol (DES) and estriol (EST)). The modified electrodes demonstrated a significant signal enhancement for EST (370%) and DES (760%), which was explained by a π-π stacking interaction between GOQDs and the aromatic system of the analytes.
This journal is © The Royal Society of Chemistry.
Conflict of interest statement
The authors declare that they have no conflict of interest.
Figures
Similar articles
-
Rational design of large flat nitrogen-doped graphene oxide quantum dots with green-luminescence suitable for biomedical applications.RSC Adv. 2022 May 12;12(23):14342-14355. doi: 10.1039/d2ra01516a. eCollection 2022 May 12. RSC Adv. 2022. PMID: 35702221 Free PMC article.
-
Short-pulsed Q-switched fiber laser using graphene oxide quantum dots based as saturable absorber.Heliyon. 2023 Sep 13;9(10):e20136. doi: 10.1016/j.heliyon.2023.e20136. eCollection 2023 Oct. Heliyon. 2023. PMID: 37780762 Free PMC article.
-
Electrochemical Method To Prepare Graphene Quantum Dots and Graphene Oxide Quantum Dots.ACS Omega. 2017 Nov 28;2(11):8343-8353. doi: 10.1021/acsomega.7b01539. eCollection 2017 Nov 30. ACS Omega. 2017. PMID: 31457373 Free PMC article.
-
Erratum: Preparation of Poly(pentafluorophenyl acrylate) Functionalized SiO2 Beads for Protein Purification.J Vis Exp. 2019 Apr 30;(146). doi: 10.3791/6328. J Vis Exp. 2019. PMID: 31038480
-
Photoluminescence and Fluorescence Quenching of Graphene Oxide: A Review.Nanomaterials (Basel). 2022 Jul 17;12(14):2444. doi: 10.3390/nano12142444. Nanomaterials (Basel). 2022. PMID: 35889668 Free PMC article. Review.
Cited by
-
Rational design of large flat nitrogen-doped graphene oxide quantum dots with green-luminescence suitable for biomedical applications.RSC Adv. 2022 May 12;12(23):14342-14355. doi: 10.1039/d2ra01516a. eCollection 2022 May 12. RSC Adv. 2022. PMID: 35702221 Free PMC article.
-
Cyclodextrin-Modified Nanomaterials for Drug Delivery: Classification and Advances in Controlled Release and Bioavailability.Pharmaceutics. 2021 Dec 10;13(12):2131. doi: 10.3390/pharmaceutics13122131. Pharmaceutics. 2021. PMID: 34959412 Free PMC article. Review.
-
Recent trends in gas sensing via carbon nanomaterials: outlook and challenges.Nanoscale Adv. 2021 Oct 28;3(23):6514-6544. doi: 10.1039/d1na00707f. eCollection 2021 Nov 24. Nanoscale Adv. 2021. PMID: 36132656 Free PMC article. Review.
-
Silane modified nitrogen-doped graphene quantum dots as a high-efficiency hybrid sorbent for NSAIDs.RSC Adv. 2025 Mar 27;15(12):9364-9374. doi: 10.1039/d5ra00253b. eCollection 2025 Mar 21. RSC Adv. 2025. PMID: 40151535 Free PMC article.
-
Short-pulsed Q-switched fiber laser using graphene oxide quantum dots based as saturable absorber.Heliyon. 2023 Sep 13;9(10):e20136. doi: 10.1016/j.heliyon.2023.e20136. eCollection 2023 Oct. Heliyon. 2023. PMID: 37780762 Free PMC article.
References
LinkOut - more resources
Full Text Sources
Research Materials
Miscellaneous