

Structures, photoresponse properties and DNA binding abilities of 4-(4-pyridinyl)-2-pyridone salts
- PMID: 35520716
- PMCID: PMC9062393
- DOI: 10.1039/c9ra00666d
Structures, photoresponse properties and DNA binding abilities of 4-(4-pyridinyl)-2-pyridone salts
Abstract
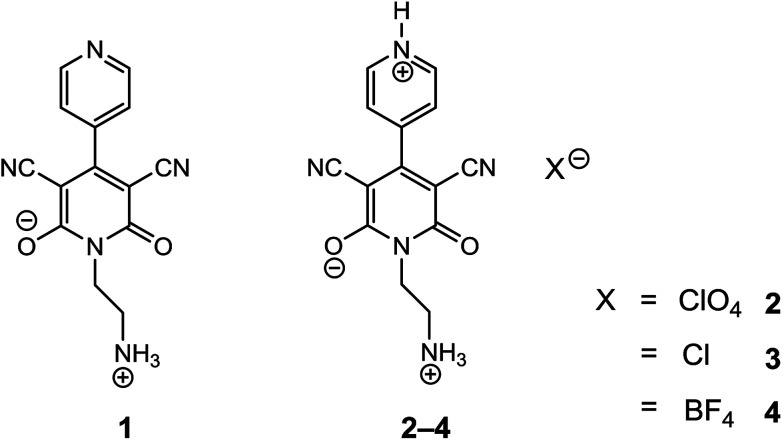
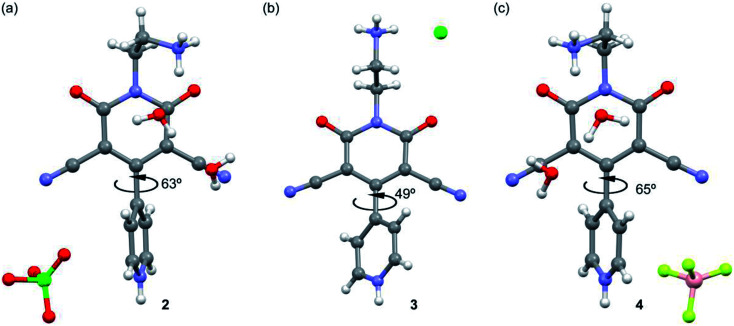
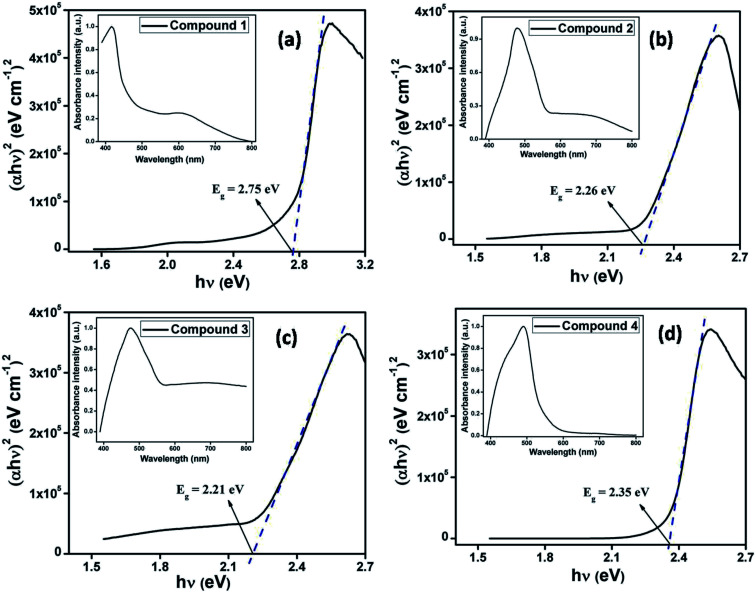
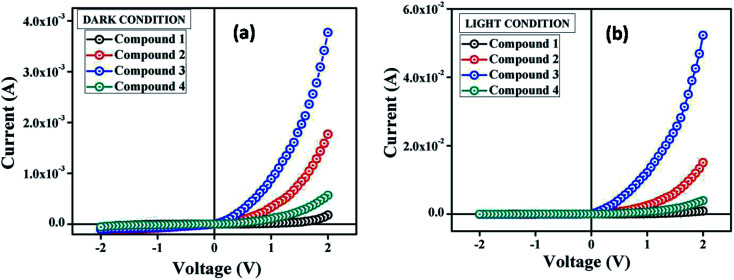
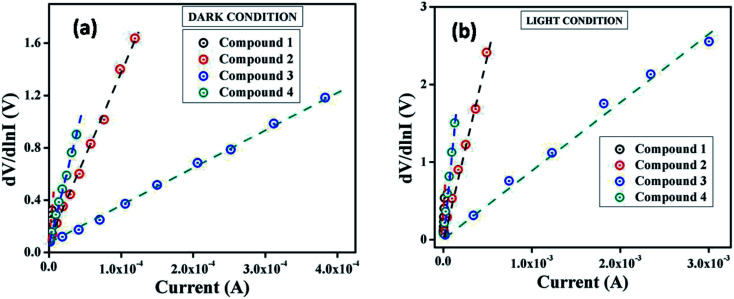
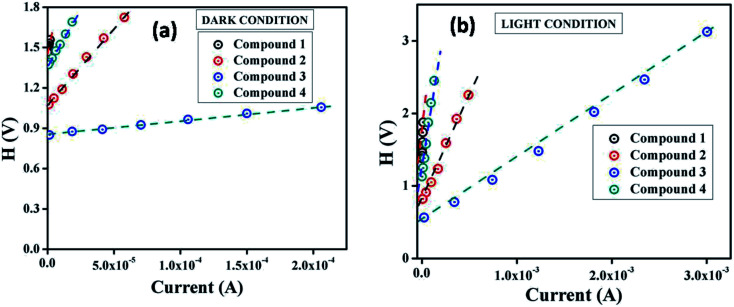
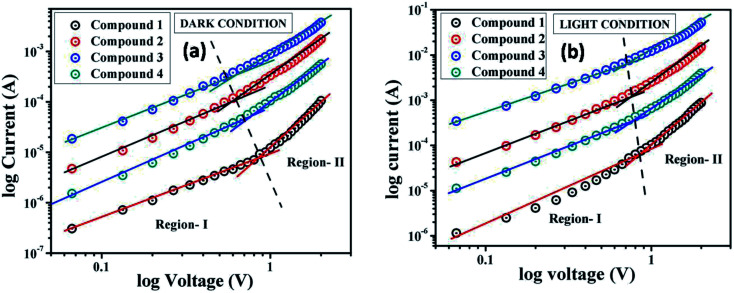
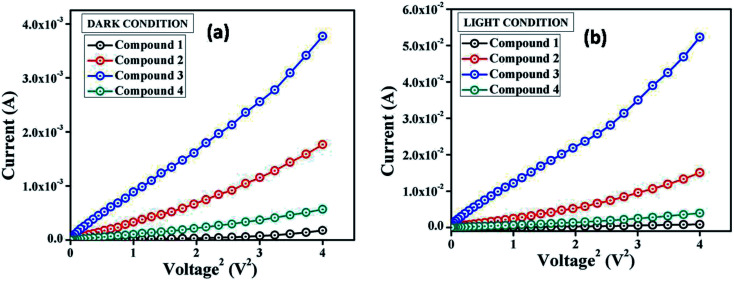
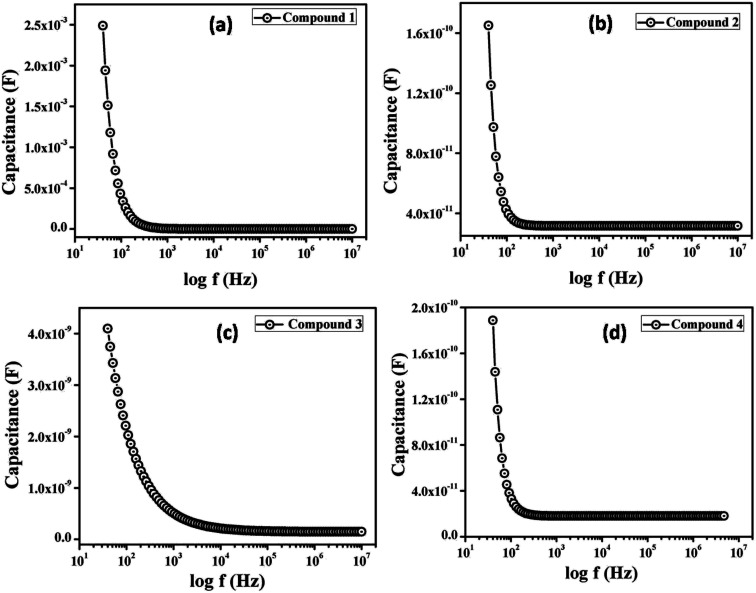
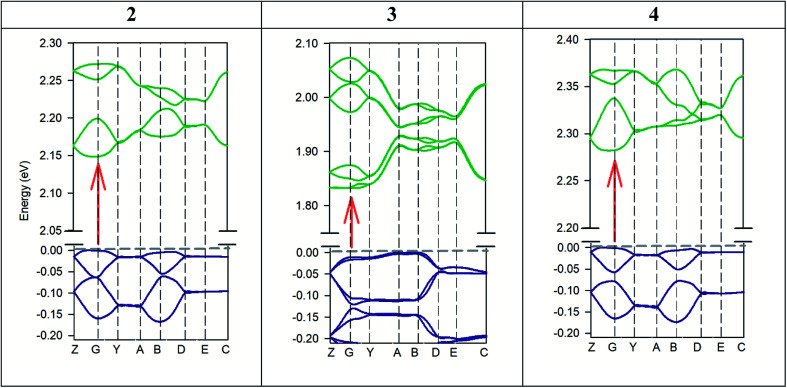
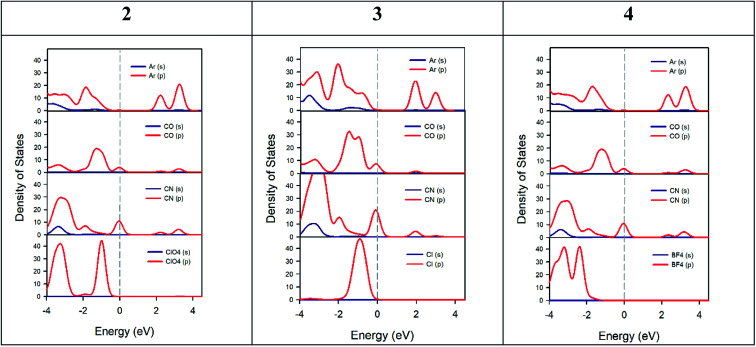
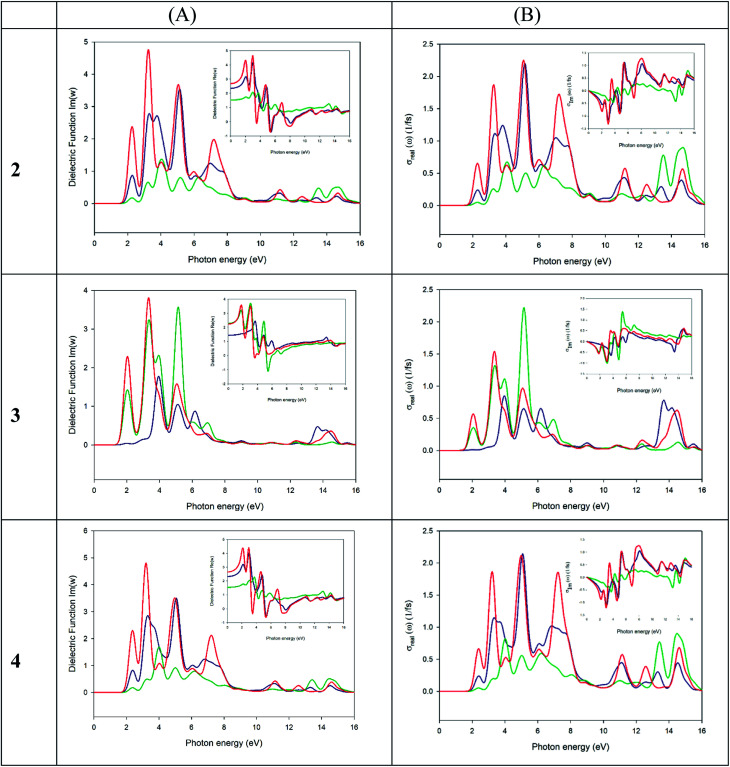
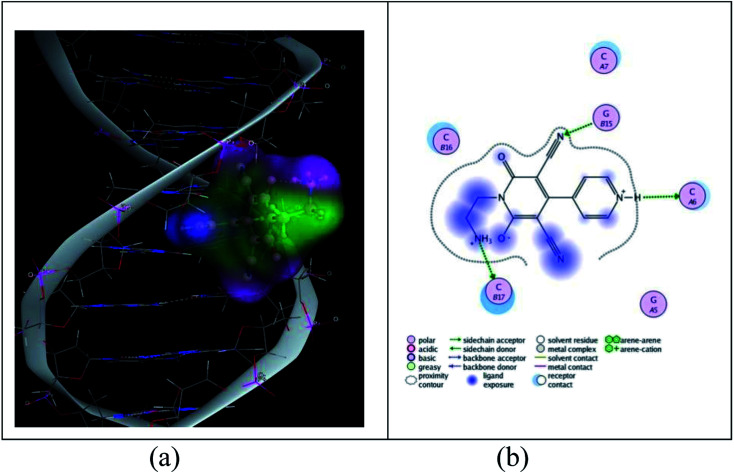
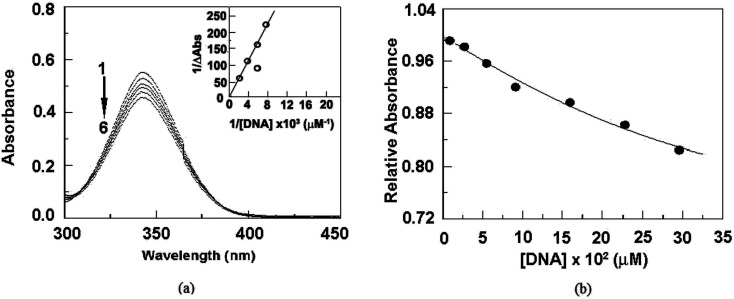
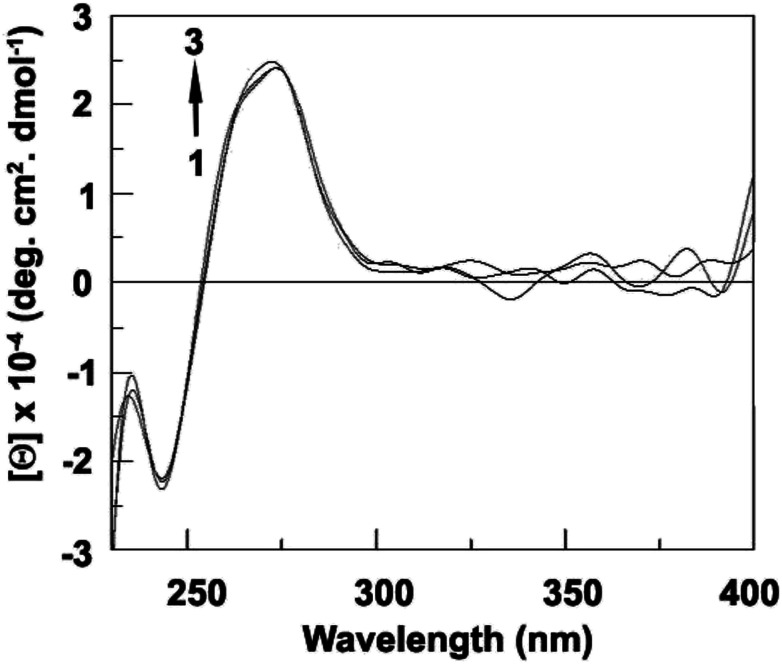
Three salts [perchlorate (2), chloride (3) and tetrafluoroborate (4)] were synthesized from a 1-(2-aminoethyl)-6-hydroxy-2-oxo-1,2-dihydro-[4,4'-bipyridine]-3,5-dicarbonitrile compound (1) and characterized by spectroscopic and single crystal X-ray diffraction methods. Various noncovalent interactions (e.g., anion⋯π+, π⋯π, lp⋯π) are explored in the solid state crystal structure of the salts. Optical band gaps of all the four compounds were determined from their solid-state UV-vis spectrum. Electrical properties like electrical conductivity, photosensitivity, etc. were calculated and the results revealed that they have potential to act as optoelectronic devices. The values of the electrical parameters increase several times when they are exposed to visible light rather than in dark conditions. The light sensing properties of the salts (2-4) are enhanced compared to that of the mother organic compound 1 but the magnitude of this enhancement is not same for the three salts. This observation has been rationalized by theoretical considerations. Moreover, the DNA binding ability of one of the representative salts (compound 2) was examined to check the biological importance of the synthesized salts.
This journal is © The Royal Society of Chemistry.
Conflict of interest statement
There is no conflict to declare.
Figures
Similar articles
-
Structures, Photoresponse Properties, and Biological Activity of Dicyano-Substituted 4-Aryl-2-pyridone Derivatives.ACS Omega. 2019 Apr 22;4(4):7200-7212. doi: 10.1021/acsomega.9b00289. eCollection 2019 Apr 30. ACS Omega. 2019. PMID: 31459825 Free PMC article.
-
De novo synthesis of hybrid d-f block metal complex salts for electronic charge transport applications.Dalton Trans. 2022 Jan 25;51(4):1561-1570. doi: 10.1039/d1dt02722k. Dalton Trans. 2022. PMID: 34989731
-
Insight into charge transportation in cadmium based semiconducting organic-inorganic hybrid materials and their application in the fabrication of photosensitive Schottky devices.Dalton Trans. 2022 Apr 5;51(14):5721-5734. doi: 10.1039/d2dt00197g. Dalton Trans. 2022. PMID: 35342921
-
Bridging the crystal and solution structure of a series of lipid-inspired ionic liquids.Soft Matter. 2023 Jan 25;19(4):749-765. doi: 10.1039/d2sm01478e. Soft Matter. 2023. PMID: 36621948
-
A new multicomponent salt of imidazole and tetrabromoterepthalic acid: structural, optical, thermal, electrical transport properties and antibacterial activity along with Hirshfeld surface analysis.Spectrochim Acta A Mol Biomol Spectrosc. 2015 Jun 5;144:43-52. doi: 10.1016/j.saa.2015.02.045. Epub 2015 Feb 18. Spectrochim Acta A Mol Biomol Spectrosc. 2015. PMID: 25748591
Cited by
-
Influence of 2-Amino-4-methylpyridine and 2-Aminopyrimidine Ligands on the Malonic Acid-Cu(II) System: Insights through Supramolecular Interactions and Photoresponse Properties.ACS Omega. 2019 Dec 31;5(1):460-470. doi: 10.1021/acsomega.9b02971. eCollection 2020 Jan 14. ACS Omega. 2019. PMID: 31956792 Free PMC article.
-
Crystallographic Aspects, Photophysical Properties, and Theoretical Survey of Tetrachlorometallates of Group 12 Metals [Zn(II), Cd(II), and Hg(II)] with a Triply Protonated 2,4,6-Tris(2-pyridyl)-1,3,5-triazine Ligand.Inorg Chem. 2023 May 15;62(19):7220-7234. doi: 10.1021/acs.inorgchem.2c04521. Epub 2023 May 2. Inorg Chem. 2023. PMID: 37130352 Free PMC article.
-
Structures, Photoresponse Properties, and Biological Activity of Dicyano-Substituted 4-Aryl-2-pyridone Derivatives.ACS Omega. 2019 Apr 22;4(4):7200-7212. doi: 10.1021/acsomega.9b00289. eCollection 2019 Apr 30. ACS Omega. 2019. PMID: 31459825 Free PMC article.
-
Solvation-Enhanced Intermolecular Charge Transfer Interaction in Organic Cocrystals: Enlarged C-C Surface Close Contact in Mixed Packing between PTZ and TCNB.ACS Omega. 2019 Jun 17;4(6):10424-10430. doi: 10.1021/acsomega.9b01083. eCollection 2019 Jun 30. ACS Omega. 2019. PMID: 31460137 Free PMC article.
References
LinkOut - more resources
Full Text Sources