

GVS-12 attenuates non-alcoholic steatohepatitis by suppressing inflammatory responses via PPARγ/STAT3 signaling pathways
- PMID: 35520738
- PMCID: PMC9062151
- DOI: 10.1039/c8ra10178g
GVS-12 attenuates non-alcoholic steatohepatitis by suppressing inflammatory responses via PPARγ/STAT3 signaling pathways
Abstract
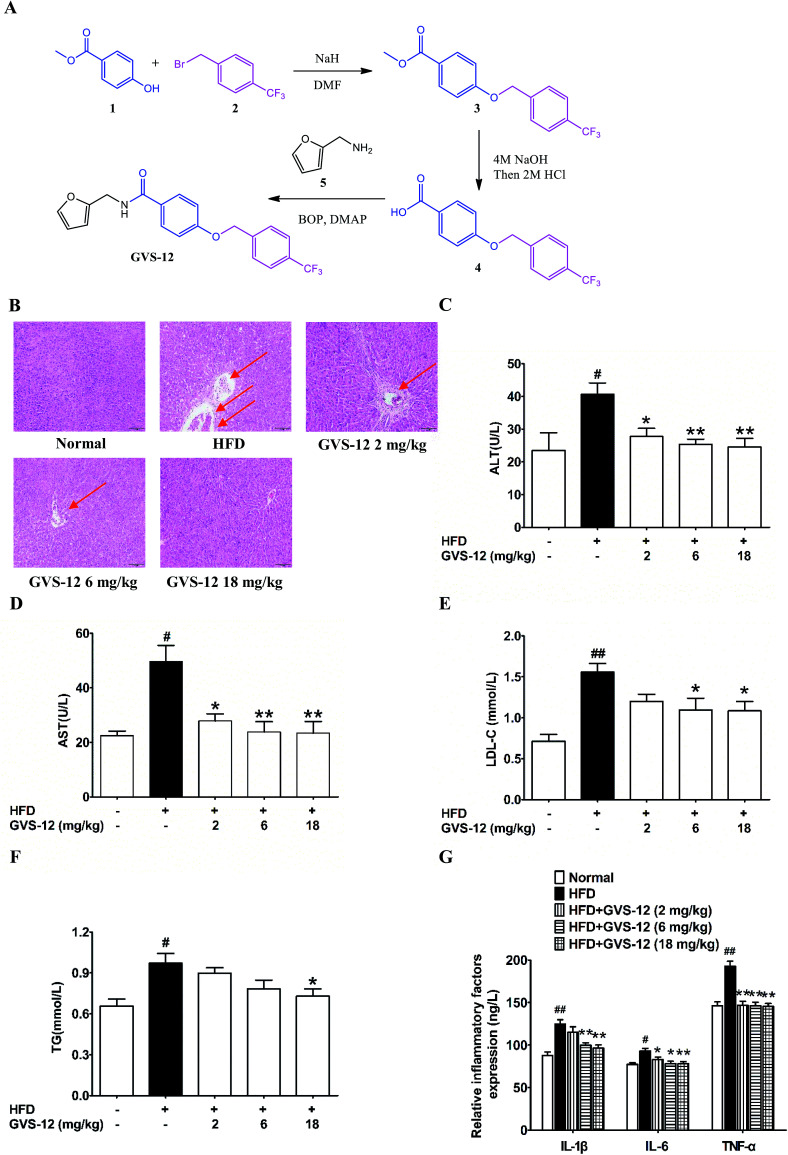
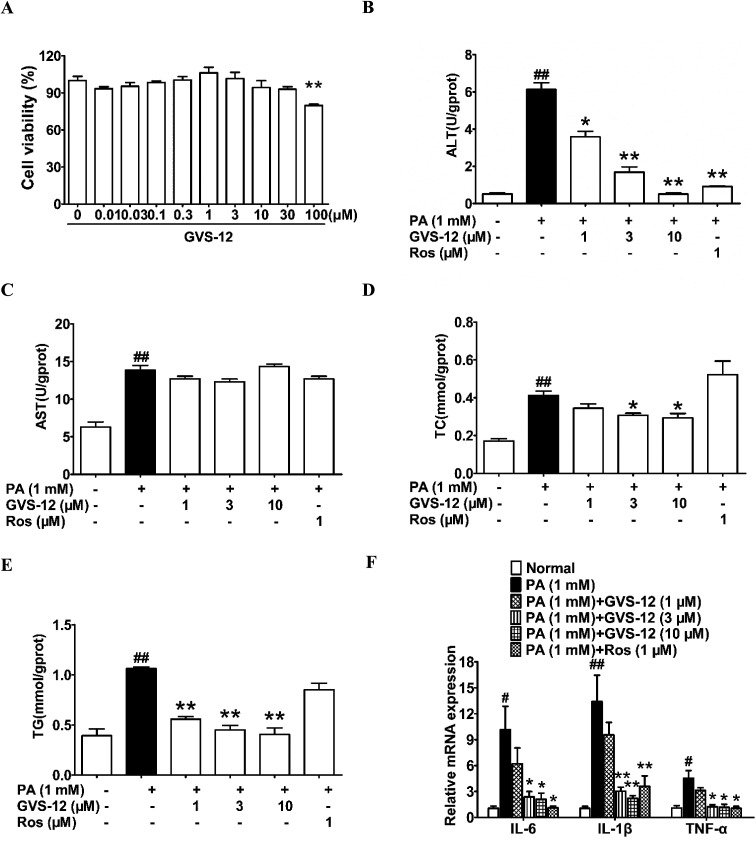
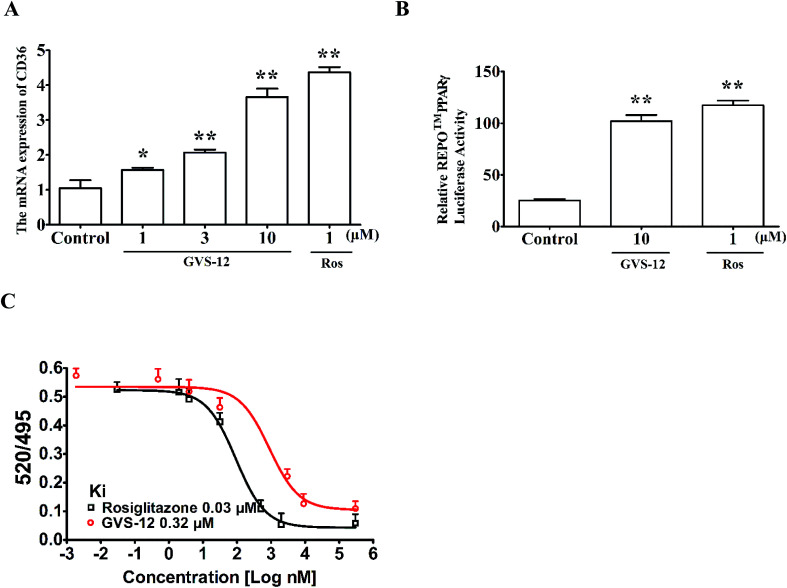
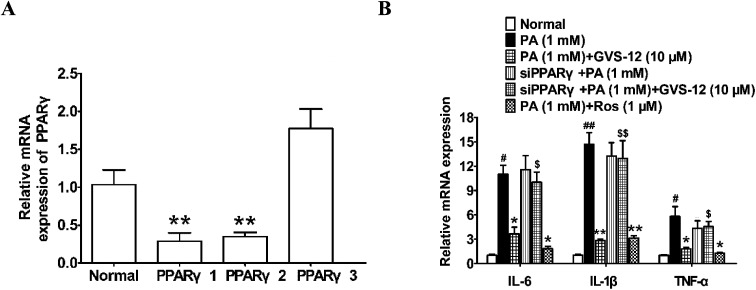
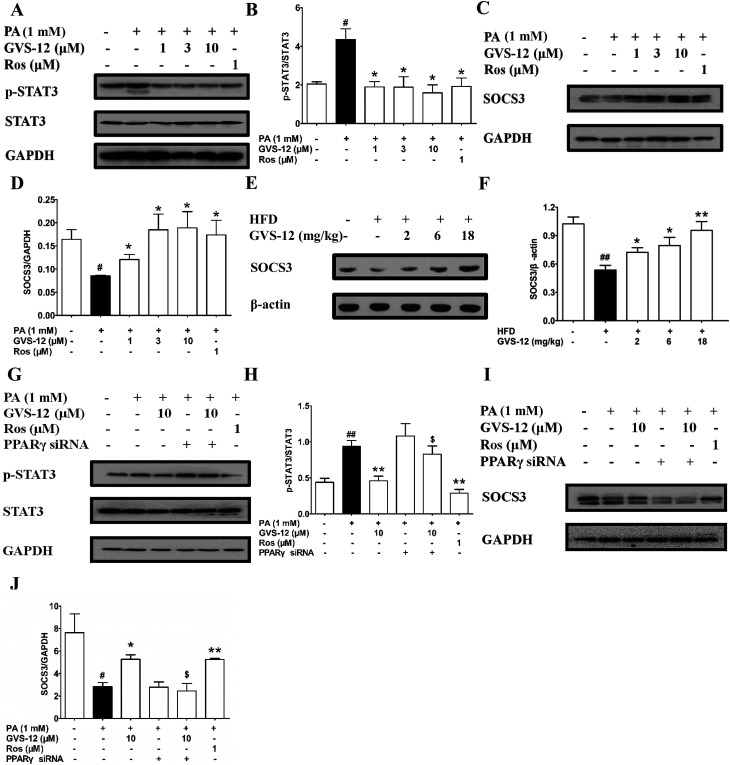
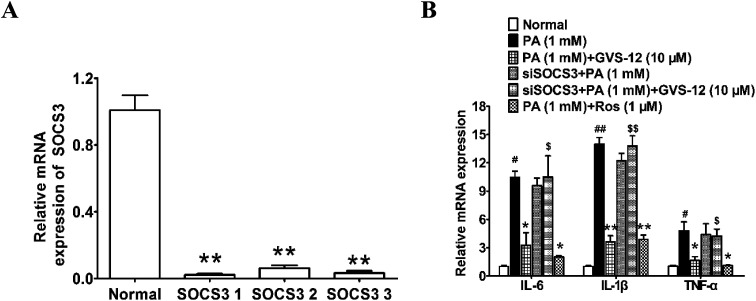
Non-alcoholic steatohepatitis (NASH), a type of fatty liver disease, is characterized by excessive inflammation and fat accumulation in the liver. Peroxisome proliferator-activated receptor γ (PPARγ) agonist rosiglitazone has great potential in protecting against the development of NASH. However, long-term usage of rosiglitazone probably leads to many adverse reactions. In this research, GVS-12 was designed and synthesized as a PPARγ agonist with high selectivity, evidenced by increasing the activity of the PPARγ reporter gene and promoting the mRNA expression of the PPARγ responsive gene cluster of differentiation 36 (CD36). It was noteworthy that GVS-12 could ameliorate dysfunction and lipid accumulation by down-regulating the mRNA expression of interleukin-1β (IL-1β), interleukin-6 (IL-6) and tumor necrosis factor-α (TNF-α) in the liver of high fat diet (HFD)-induced rats and palmitic acid (PA)-stimulated hepatocellular carcinoma G2 (HepG2) cells. Moreover, PPARγ siRNA (siPPARγ) markedly diminished GVS-12 induced the down-regulation of mRNA expression of IL-1β, IL-6 and TNF-α in PA-stimulated HepG2 cells. Additionally, GVS-12 could reduce the phosphorylation level of STAT3 and up-regulate the protein expression of a suppressor of cytokine signaling 3 (SOCS3), which could be reversed by siPPARγ. In detail, SOCS3 siRNA (siSOCS3) diminished the inhibitory effect of GVS-12 on the mRNA expression of IL-1β, IL-6 and TNF-α. In conclusion, GVS-12 suppressed the development of NASH by down-regulating the mRNA expression of IL-1β, IL-6 and TNF-α via PPARγ/STAT3 signaling pathways.
This journal is © The Royal Society of Chemistry.
Conflict of interest statement
The authors have no financial conflicts of interest.
Figures
Similar articles
-
Inhibitory effects of suppressor of cytokine signaling 3 on inflammatory cytokine expression and migration and proliferation of IL-6/IFN-γ-induced vascular smooth muscle cells.J Huazhong Univ Sci Technolog Med Sci. 2013 Oct;33(5):615-622. doi: 10.1007/s11596-013-1168-x. Epub 2013 Oct 20. J Huazhong Univ Sci Technolog Med Sci. 2013. PMID: 24142708
-
The effects of S-nitrosylation-induced PPARγ/SFRP5 pathway inhibition on the conversion of non-alcoholic fatty liver to non-alcoholic steatohepatitis.Ann Transl Med. 2021 Apr;9(8):684. doi: 10.21037/atm-21-1070. Ann Transl Med. 2021. PMID: 33987382 Free PMC article.
-
PPARγ alleviated hepatocyte steatosis through reducing SOCS3 by inhibiting JAK2/STAT3 pathway.Biochem Biophys Res Commun. 2018 Apr 15;498(4):1037-1044. doi: 10.1016/j.bbrc.2018.03.110. Epub 2018 Mar 19. Biochem Biophys Res Commun. 2018. PMID: 29550470
-
The ménage à trois of autophagy, lipid droplets and liver disease.Autophagy. 2022 Jan;18(1):50-72. doi: 10.1080/15548627.2021.1895658. Epub 2021 Apr 2. Autophagy. 2022. PMID: 33794741 Free PMC article. Review.
-
Docosahexaenoic acid attenuates LPS-stimulated inflammatory response by regulating the PPARγ/NF-κB pathways in primary bovine mammary epithelial cells.Res Vet Sci. 2017 Jun;112:7-12. doi: 10.1016/j.rvsc.2016.12.011. Epub 2017 Jan 5. Res Vet Sci. 2017. PMID: 28095338 Review.
Cited by
-
Alcohol Use Disorder and the Gut-Brain Axis: A Narrative Review of the Role of Gut Microbiota and Implications for Treatment.Microorganisms. 2025 Jan 2;13(1):67. doi: 10.3390/microorganisms13010067. Microorganisms. 2025. PMID: 39858835 Free PMC article. Review.
-
Qing-Luo-Yin Eases T Cells-Mediated Angiogenesis in Adjuvant-Induced Arthritis Rats by Activating PPARγ.J Inflamm Res. 2025 Mar 10;18:3469-3484. doi: 10.2147/JIR.S508316. eCollection 2025. J Inflamm Res. 2025. PMID: 40093952 Free PMC article.
-
Beta-Caryophyllene Modifies Intracellular Lipid Composition in a Cell Model of Hepatic Steatosis by Acting through CB2 and PPAR Receptors.Int J Mol Sci. 2023 Mar 23;24(7):6060. doi: 10.3390/ijms24076060. Int J Mol Sci. 2023. PMID: 37047034 Free PMC article.
-
Therapeutic Targeting of PPARγ in Nonalcoholic Fatty Liver Disease: Efficacy, Safety, and Drug Development.Drug Des Devel Ther. 2025 Aug 22;19:7293-7319. doi: 10.2147/DDDT.S524893. eCollection 2025. Drug Des Devel Ther. 2025. PMID: 40873855 Free PMC article. Review.
References
-
- Lim H. X. Jung H. J. Lee A. Park S. H. Han B. W. Cho D. Kim T. S. Lysyl-transfer RNA synthetase induces the maturation of dendritic cells through MAPK and NF-κB pathways, strongly contributing to enhanced Th1 cell responses. J. Immunol. 2018;201:2832–2841. doi: 10.4049/jimmunol.1800386. - DOI - PubMed
LinkOut - more resources
Full Text Sources
Miscellaneous