

A network model of glymphatic flow under different experimentally-motivated parametric scenarios
- PMID: 35521514
- PMCID: PMC9062681
- DOI: 10.1016/j.isci.2022.104258
A network model of glymphatic flow under different experimentally-motivated parametric scenarios
Abstract
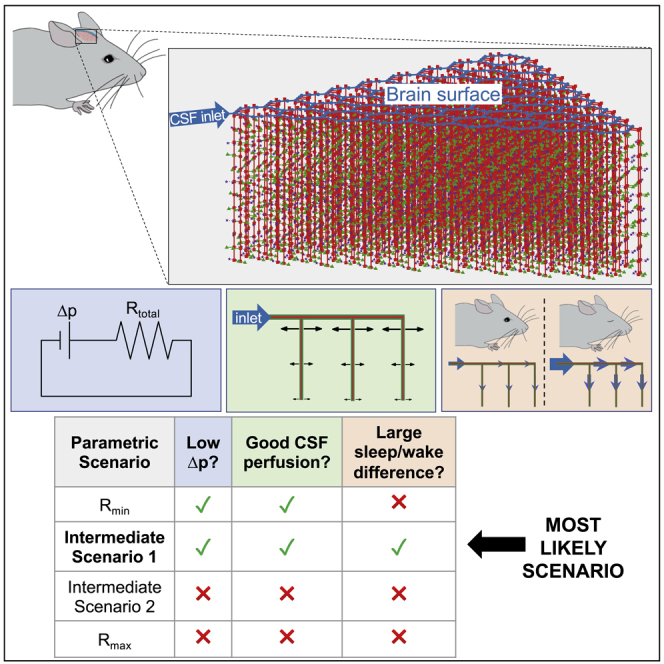
Flow of cerebrospinal fluid (CSF) through perivascular spaces (PVSs) in the brain delivers nutrients, clears metabolic waste, and causes edema formation. Brain-wide imaging cannot resolve PVSs, and high-resolution methods cannot access deep tissue. However, theoretical models provide valuable insight. We model the CSF pathway as a network of hydraulic resistances, using published parameter values. A few parameters (permeability of PVSs and the parenchyma, and dimensions of PVSs and astrocyte endfoot gaps) have wide uncertainties, so we focus on the limits of their ranges by analyzing different parametric scenarios. We identify low-resistance PVSs and high-resistance parenchyma as the only scenario that satisfies three essential criteria: that the flow be driven by a small pressure drop, exhibit good CSF perfusion throughout the cortex, and exhibit a substantial increase in flow during sleep. Our results point to the most important parameters, such as astrocyte endfoot gap dimensions, to be measured in future experiments.
Keywords: In silico biology; Neuroscience; Systems neuroscience.
© 2022 The Author(s).
Conflict of interest statement
The authors declare no competing interests.
Figures


Similar articles
-
Gaps in the wall of a perivascular space act as valves to produce a directed flow of cerebrospinal fluid: a hoop-stress model.J R Soc Interface. 2024 Apr;21(213):20230659. doi: 10.1098/rsif.2023.0659. Epub 2024 Apr 3. J R Soc Interface. 2024. PMID: 38565158 Free PMC article.
-
Sensitivity analysis on a network model of glymphatic flow.J R Soc Interface. 2022 Jun;19(191):20220257. doi: 10.1098/rsif.2022.0257. Epub 2022 Jun 1. J R Soc Interface. 2022. PMID: 35642425 Free PMC article.
-
Sizes and shapes of perivascular spaces surrounding murine pial arteries.Fluids Barriers CNS. 2023 Jul 17;20(1):56. doi: 10.1186/s12987-023-00454-z. Fluids Barriers CNS. 2023. PMID: 37461047 Free PMC article.
-
The Glymphatic System in Central Nervous System Health and Disease: Past, Present, and Future.Annu Rev Pathol. 2018 Jan 24;13:379-394. doi: 10.1146/annurev-pathol-051217-111018. Annu Rev Pathol. 2018. PMID: 29195051 Free PMC article. Review.
-
Perivascular spaces, glymphatic dysfunction, and small vessel disease.Clin Sci (Lond). 2017 Aug 10;131(17):2257-2274. doi: 10.1042/CS20160381. Print 2017 Sep 1. Clin Sci (Lond). 2017. PMID: 28798076 Free PMC article. Review.
Cited by
-
Artificial intelligence velocimetry reveals in vivo flow rates, pressure gradients, and shear stresses in murine perivascular flows.Proc Natl Acad Sci U S A. 2023 Apr 4;120(14):e2217744120. doi: 10.1073/pnas.2217744120. Epub 2023 Mar 29. Proc Natl Acad Sci U S A. 2023. PMID: 36989300 Free PMC article.
-
Could Sleep Be an Antidote to Optic Disc Edema in Astronauts?Life (Basel). 2025 Jan 26;15(2):183. doi: 10.3390/life15020183. Life (Basel). 2025. PMID: 40003591 Free PMC article.
-
Arterial pulsations and transmantle pressure synergetically drive glymphatic flow.Sci Rep. 2025 Apr 21;15(1):13798. doi: 10.1038/s41598-025-97631-x. Sci Rep. 2025. PMID: 40258946 Free PMC article.
-
The glymphatic system: Current understanding and modeling.iScience. 2022 Aug 20;25(9):104987. doi: 10.1016/j.isci.2022.104987. eCollection 2022 Sep 16. iScience. 2022. PMID: 36093063 Free PMC article. Review.
-
Theoretical analysis of wake/sleep changes in brain solute transport suggests a flow of interstitial fluid.Fluids Barriers CNS. 2022 Apr 13;19(1):30. doi: 10.1186/s12987-022-00325-z. Fluids Barriers CNS. 2022. PMID: 35418142 Free PMC article.
References
Grants and funding
LinkOut - more resources
Full Text Sources
Miscellaneous
