. 2022 Apr 14;25(5):104250.
doi: 10.1016/j.isci.2022.104250. eCollection 2022 May 20.

Rab33b-exocyst interaction mediates localized secretion for focal adhesion turnover and cell migration

Affiliations

Rab33b-exocyst interaction mediates localized secretion for focal adhesion turnover and cell migration

Synne Arstad Bjørnestad et al. iScience. .

Abstract

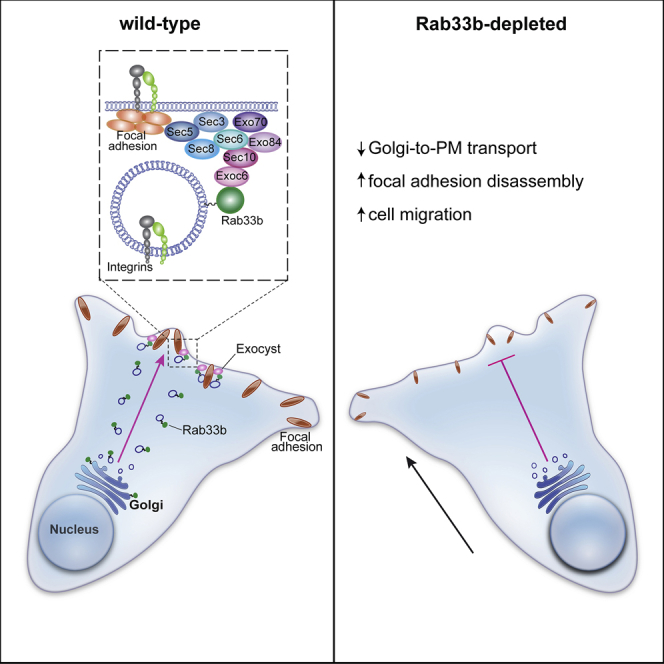
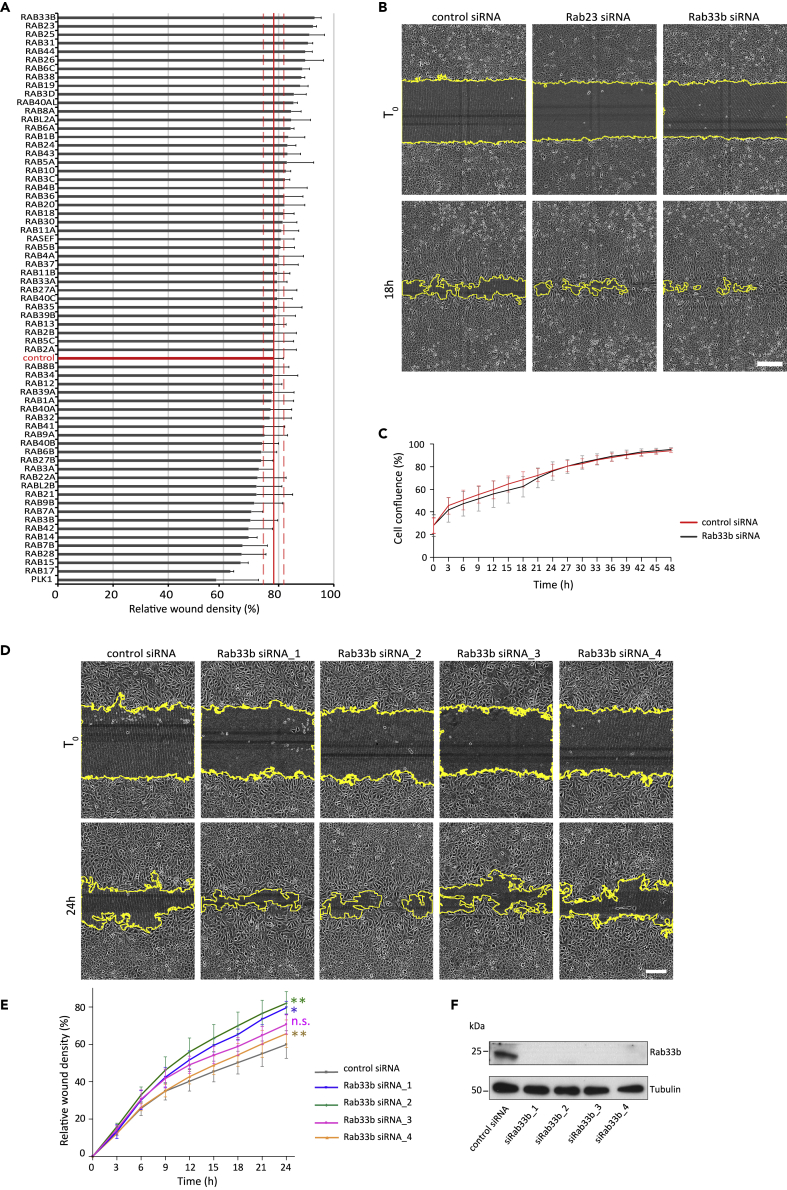
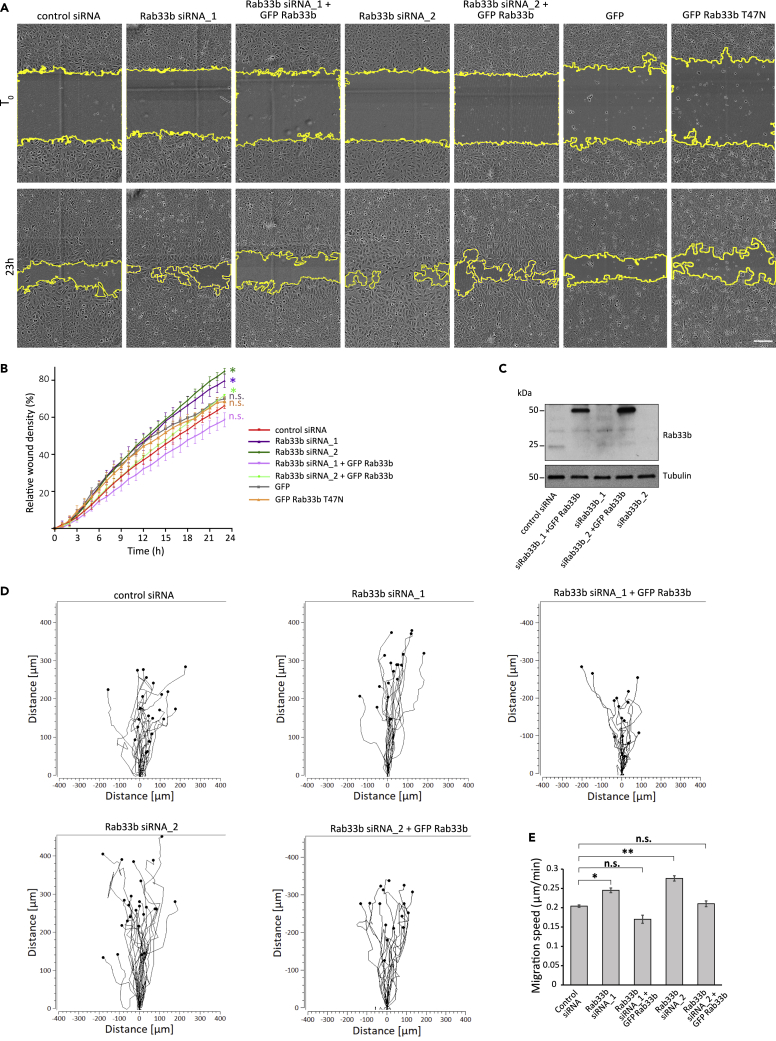
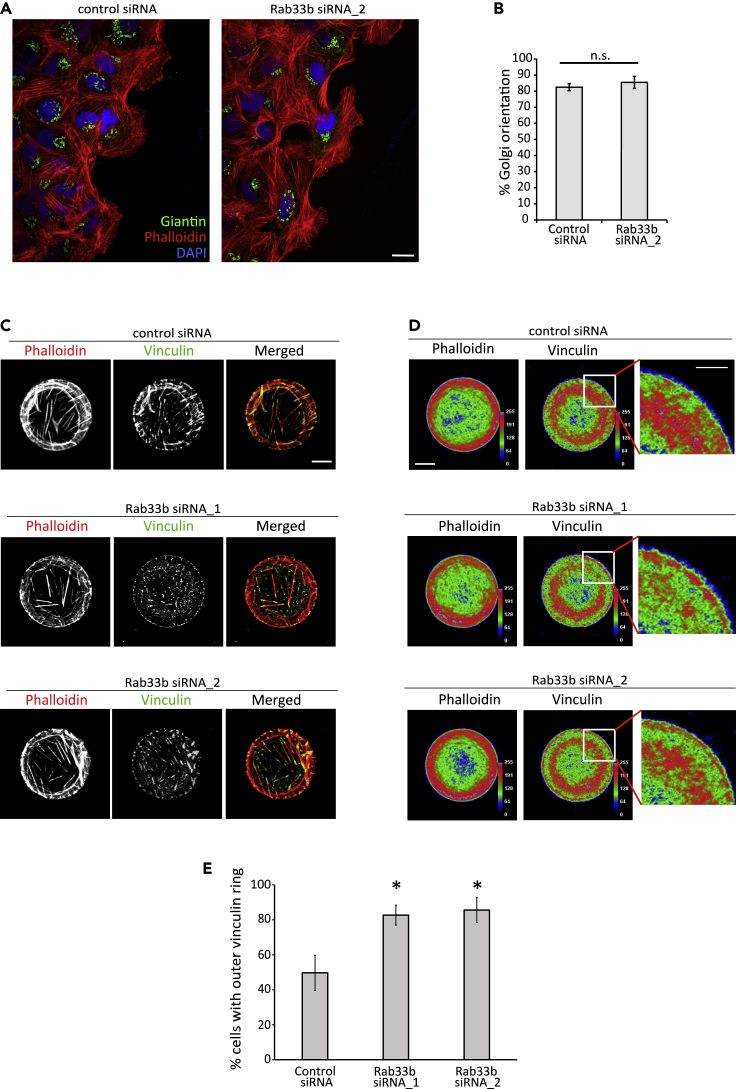
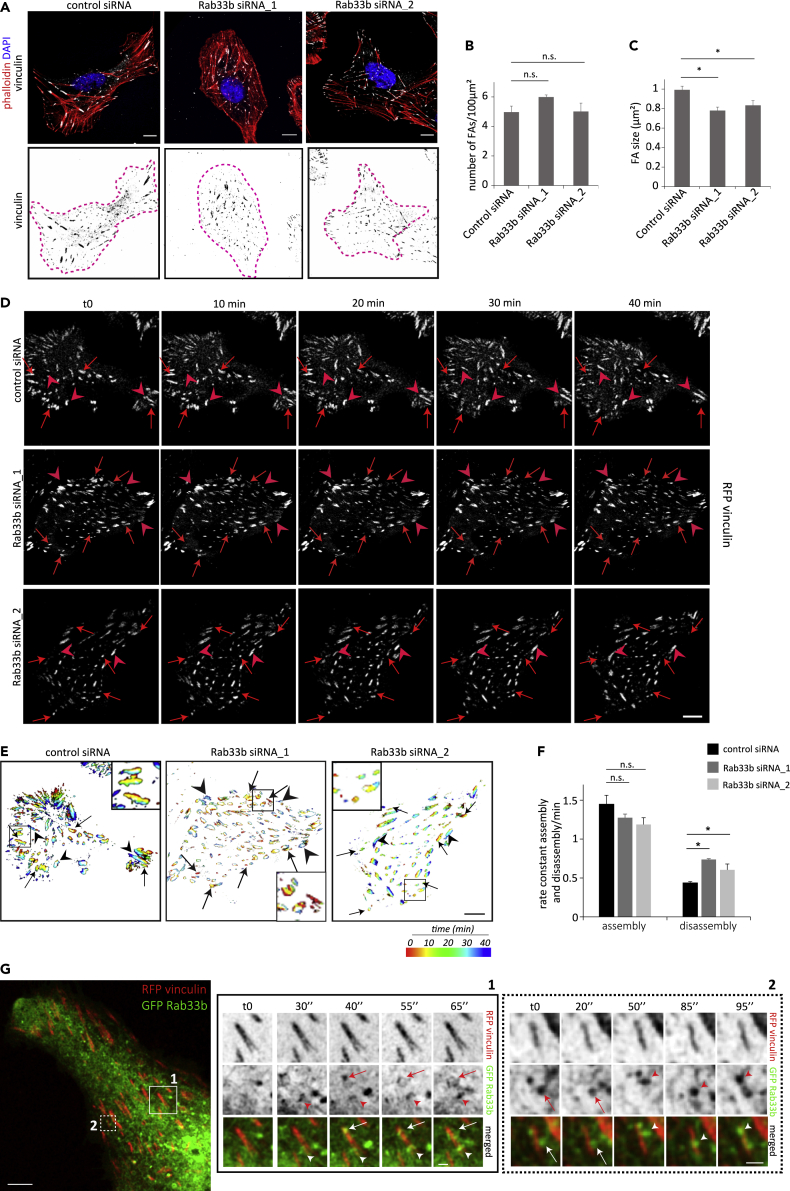
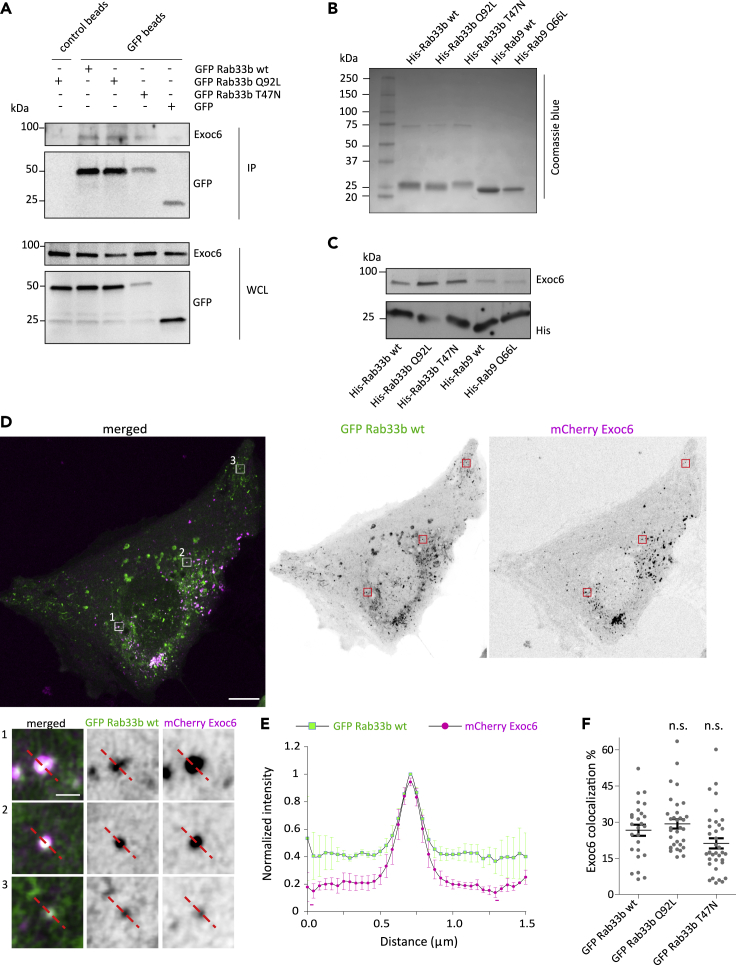
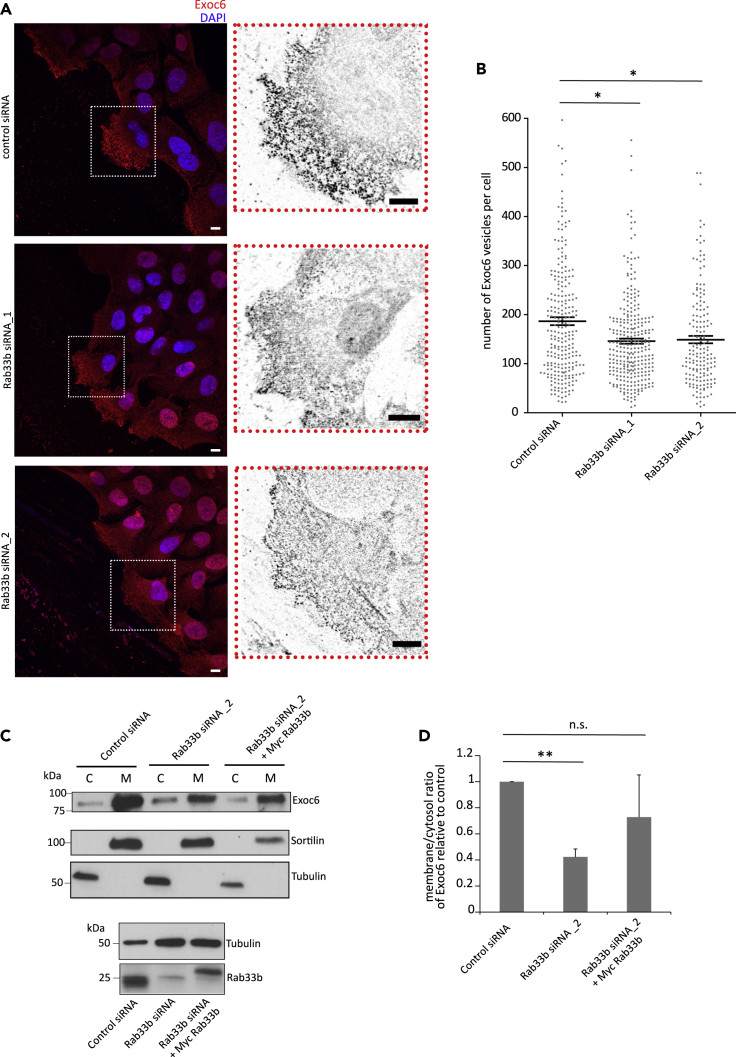
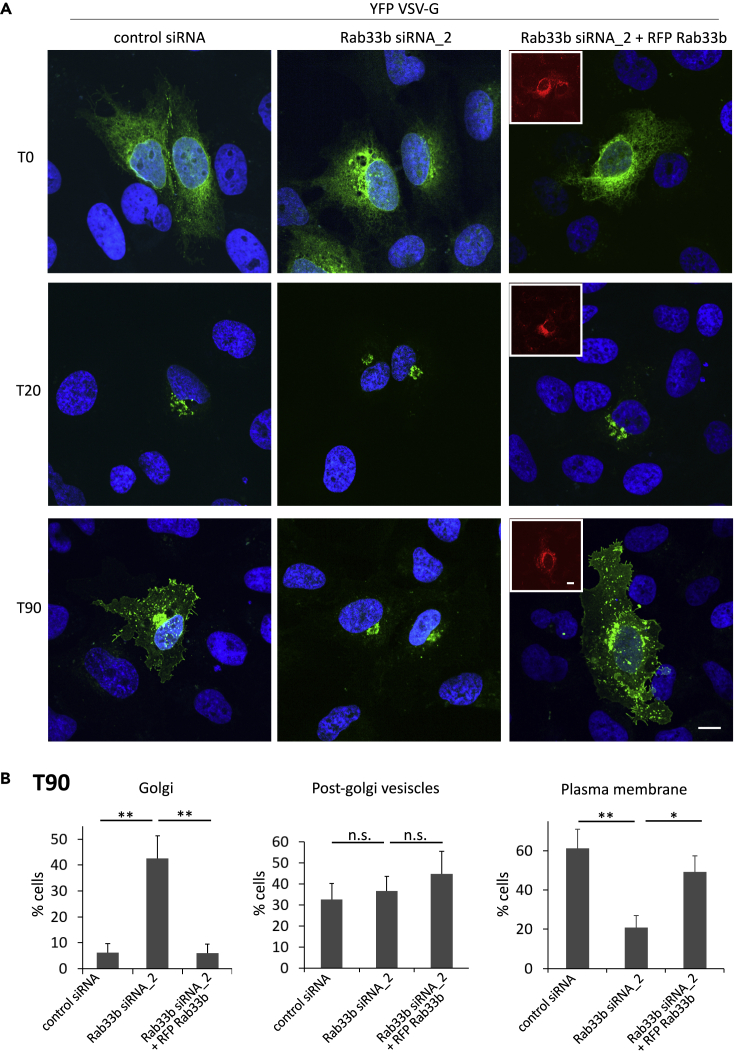
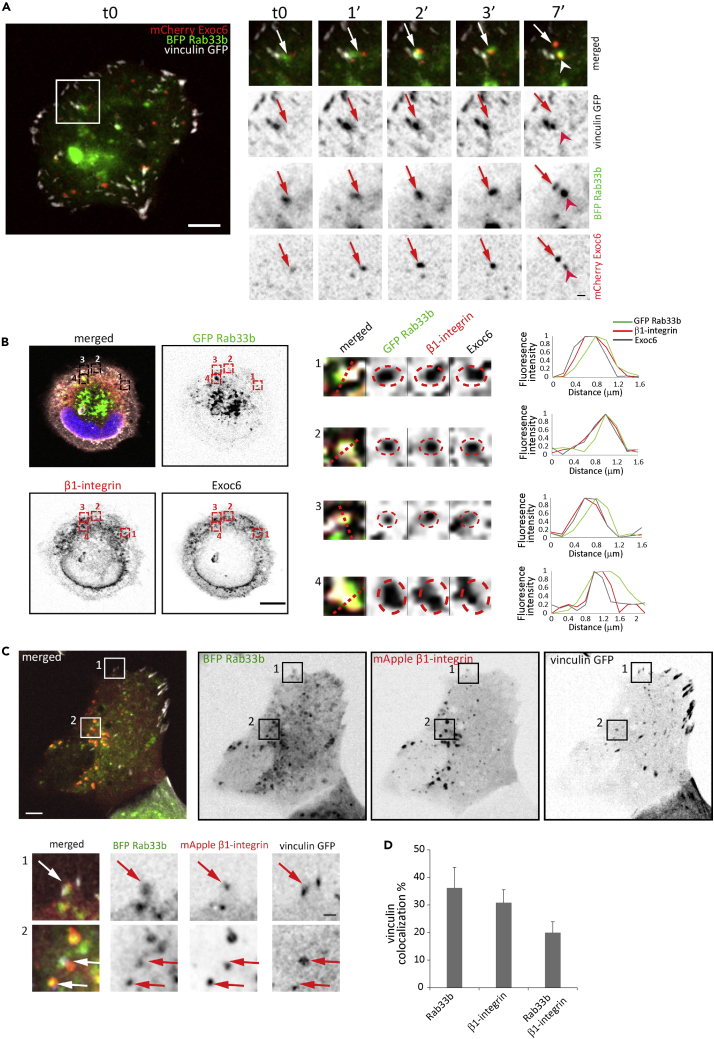
Rab proteins are well known regulators of intracellular trafficking; however, more and more studies point to their function also in other cellular processes, including cell migration. In this work, we have performed an siRNA screen to identify Rab proteins that influence cell migration. The screen revealed Rab33b as the strongest candidate that affected cell motility. Rab33b has been previously reported to localize at the Golgi apparatus to regulate Golgi-to-ER retrograde trafficking and Golgi homeostasis. We revealed that Rab33b also mediates post-Golgi transport to the plasma membrane. We further identified Exoc6, a subunit of the exocyst complex, as an interactor of Rab33b. Moreover, our data indicate that Rab33b regulates focal adhesion dynamics by modulating the delivery of cargo such as integrins to focal adhesions. Altogether, our results demonstrate a role for Rab33b in cell migration by regulating the delivery of integrins to focal adhesions through the interaction with Exoc6.

Keywords: Cell biology; Functional aspects of cell biology; Organizational aspects of cell biology.


Conflict of interest statement

N.A.G. is now under paid employment by the company Thermo Fisher Scientific. Other authors declare no competing interests.

Figures

None
Graphical abstract
Figure 1
Figure 1
siRNA screen to identify Rab proteins affecting cell migration (A) U2OS cells transfected with control siRNA or pools of four different siRNAs against human Rabs were grown to confluency, scratch-wounded, and imaged every 3 h. The graph shows the relative wound density at 18 h after wounding represented as mean ± SEM of four independent experiments. The red solid line indicates the relative wound density (%) and the dashed red lines the boundaries of the SEM for cells transfected with control siRNA. (B) Representative images are shown for time 0 and 18 h after wounding for the two Rabs whose depletion had the strongest effect on wound closure. Scale bar: 200 μm. (C) U2OS cells transfected with control siRNA or a pool of four different siRNAs targeting Rab33b were imaged for 48 h. The rate of proliferation (measured as percentage of cell confluence) over time is shown as mean ± SEM of three independent experiments. (D) U2OS cells were transfected with control siRNA or each of the different individual four siRNAs present in the pool targeting Rab33b (Rab33b siRNA_1, siRNA_2, siRNA_3, or siRNA_4), grown to confluency, scratch-wounded, and imaged every 3 h. Representative images for time 0 and 24 h after wounding are shown. Scale bar: 200 μm. (E) Graph showing the relative wound density (%) over time for each sample in (d). The graph represents the mean ± SEM of a minimum of three independent experiments. ∗p < 0.05, ∗∗p < 0.01, n.s. not significant, for t = 24h (two-tailed paired Student′s t-test). (F) Lysates from U2OS cells transfected with control siRNA, or with each of the different individual four siRNAs present in the pool targeting Rab33b were subjected to Western blot analysis with the indicated antibodies.
Figure 2
Figure 2
Rab33b depletion promotes cell migration (A) U2OS cells transfected with either control siRNA, Rab33b siRNA_1, Rab33b siRNA_2, treated with the same siRNAs against Rab33b and afterwards transfected with GFP-Rab33b or transiently transfected with GFP, or GFP-Rab33b T47N, were scratch-wounded and imaged every 3 h. Representative images for time 0 and 23 h after wounding are shown. Scale bar: 200 μm. (B) Graph showing relative wound density (%) for each sample in (a) over time. The graph represents the mean ± SEM of a minimum of three independent experiments. ∗p < 0.05, n.s., not significant, for t = 24h (two-tailed paired Student′s t-test). (C) Cell lysates from cells treated with control siRNA, Rab33b siRNA_1, Rab33b siRNA_2, or treated with the same siRNAs against Rab33b and afterwards transfected with GFP-Rab33b were subjected to Western blot analysis with antibodies against Rab33b and tubulin (as loading control). (D) Representative track plots of the single-cell distances of migration for cells transfected with control siRNA, Rab33b siRNA_1, Rab33b siRNA_2, or treated with the same siRNAs against Rab33b and afterwards transfected with GFP-Rab33b. Individual tracks are shown so that each starts at the origin (distance 0). (E) Quantification of the mean ± SEM of the single cell speed from at least three independent experiments. n > 30 cells per condition and per experiment. ∗p < 0.05, ∗∗p < 0.01, n.s., not significant (two-tailed paired Student′s t-test). See also Figures S1A–S1B
Figure 3
Figure 3
Silencing of Rab33b influences focal adhesions but not Golgi orientation (A) U2OS cells treated with siRNA control or Rab33b siRNA_2 were grown to confluency, scratch-wounded, and fixed after 6 h. Cells were immunostained with an antibody against giantin. Actin cytoskeleton was labeled with rhodamine-conjugated phalloidin and nuclei with DAPI. Scale bar: 10 μm. (B) Quantification of the percentage of cells having the Golgi apparatus located between the nucleus and the leading edge. The graph shows the mean ± SEM; n > 164 cells from four independent experiments. n.s., not significant (two-tailed paired Student′s t-test). (C) U2OS cells treated with siRNA control, Rab33b siRNA_1, or Rab33b siRNA_2, were plated onto fibronectin-coated disc-shaped micropatterns and left to adhere for 3.5 h before fixation and staining with rhodamine-conjugated phalloidin and an antibody against vinculin. Scale bar: 10 μm. (D) Color-coded map of the actin and vinculin distribution for U2OS cells treated with siRNA control or Rab33b siRNAs. The images were obtained by using the CellRef macro on averaged Z-projection images from aligned single stacks. The color scale is a color map of intensity generated by applying the Rainbow RGB LUT to the normalized mean cell (8-bit image). The color “red” indicates high intensity and the color “blue” indicates low intensity. Scale bar: 10 μm; inset: 5 μm. (E) Quantification of the percentage of cells having a vinculin ring at the cell periphery. The graph shows the mean ± SEM; n > 150 cells from three independent experiments. ∗p < 0.05 (two-tailed paired Student′s t-test). See also Figures S1C–S1D.
Figure 4
Figure 4
Rab33b is involved in the regulation of focal adhesion dynamics (A) U2OS cells silenced with control siRNA, Rab33b siRNA_1, or Rab33b siRNA_2, were fixed and stained with DAPI, rhodamine-conjugated phalloidin, and an antibody against vinculin. Scale bar: 5 μm. (B–C) Quantification of FA number per 100 μm2 cell area (b) and size (c). The graphs represent the mean ± SEM for three independent experiments (n > 90 cells). ∗p < 0.05, n.s., not significant (two-tailed paired Student′s t-test). (D) Control or Rab33b-depleted cells transfected with RFP-vinculin were imaged every 10 min for 40 min. Arrows show FA disassembly, and arrowheads show FA assembly. Scale bar: 10 μm. (E) Rainbow color representation of FA assembly and disassembly over time from cells shown in panel (d). Each time point is shown in a different color, as indicated in the bar. Insets show magnifications of the boxed areas. Scale bar: 10 μm. (F) Quantification of assembly and disassembly rates of FAs. The assembly and disassembly rate is shown as percentage of focal adhesion formation or disassembly per minute. The values represent the mean ± SEM from three independent experiments, in which 15 FAs were analyzed per cell (n > 5), per condition, and per experiment. ∗p < 0.05, n.s., not significant (two-tailed paired Student′s t-test). (G) Live-cell imaging of U2OS cells co-transfected with GFP-Rab33b (green) and RFP-vinculin (red). Cells were imaged every 5 s with a Zeiss LSM880 confocal microscope. Magnifications of the boxed areas in the side panels show Rab33b-positive vesicles moving to focal adhesion sites. Scale bar: 5μm, inset: 1μm. See also Figure S2 and Video S1. Rab33b-positive vesicles are delivered to FAs, Live-cell imaging of U2OS cells co-transfected with GFP-Rab33b (green) and vinculin-RFP (red). Magnification of the boxed area 1 in Figure 4g is shown and illustrates two examples of Rab33b-positive vesicles contacting focal adhesions. Cells were imaged every 5 s using a spinning disk confocal microscope. Related to Figure 4., Video S2. Rab33b-positive vesicles are delivered to FAs,Live-cell imaging of U2OS cells co-transfected with GFP-Rab33b (green) and vinculin-RFP (red). Magnifications of the boxed area 2 in Figure 4g is shown and illustrate two examples of Rab33b-positive vesicles contacting focal adhesions. Cells were imaged every 5 s using a spinning disk confocal microscope. Related to Figure 4., Video S3. Rab33b-positive vesicles are delivered to growing FAs during membrane protrusion,U2OS cells transiently transfected with GFP-Rab33b (green) and vinculin-RFP (red) were imaged every 30 s using a TIRF microscope with a penetration depth of 90 nm. The movie shows the recruitment of GFP-Rab33b-positive vesicles during membrane protrusion. Related to Figure 4..
Figure 5
Figure 5
Exoc6 is a Rab33b interactor (A) U2OS cells were transiently transfected with GFP, GFP-Rab33b wt, GFP-Rab33b Q92L, or GFP-Rab33b T47N, lysed, and subjected to IP with GFP or control magnetic agarose beads. Whole-cell lysates (WCL) and immunoprecipitates (IP) were subjected to Western blot analysis using the indicated antibodies. (B) Coomassie blue staining of bacterially expressed His-Rab33b wt, His-Rab33b Q92L, His-Rab33b T47N, His-Rab9 wt, and His-Rab9 Q66L purified by using nickel-nitrilotriacetic acid (Ni-NTA) columns. (C) His-Rab33b wt, His-Rab33b Q92L, His-Rab33b T47N, His-Rab9 wt, and His-Rab9 Q66L were immobilized onto His-dynabeads® and incubated with cell lysate from U2OS cells to allow the binding of interactors. The samples were subjected to Western blot analysis using the indicated antibodies. (D) Representative image of a U2OS cell transfected with GFP-Rab33b wt and mCherry-Exoc6. Magnifications of the boxed areas show colocalization of Rab33b wt (green) and Exoc6 (magenta) on vesicles. Scale bar: 10 μm; insets: 1 μm. (E) The graph shows the normalized fluorescence intensity profile relative to Rab33b and Exoc6 along the lines as illustrated in the insets in (d), represented as mean ± SEM from 3 independent experiments. n = 119 vesicles from 15 cells. (F) The percentage of Exoc6 vesicles positive for Rab33b was calculated by using an object-based colocalization analysis with ImageJ software. The values represent the mean ± SEM from three independent experiments. n ≥ 30 cells. n.s., not significant (two-tailed paired Student′s t-test). See also Figure S3.
Figure 6
Figure 6
Membrane recruitment of Exoc6 is dependent on Rab33b (A) U2OS cells treated with siRNA control or Rab33b siRNA were grown to confluency, scratched with a pipet tip, and fixed after 6 h. Cells were immunostained with an antibody against Exoc6 and the nuclei labeled with DAPI. The insets show magnifications of the boxed areas. Scale bars: 10 μm. (B) Quantification of the number of Exoc6-positive vesicles per cell. The graph shows the mean ± SEM of a minimum of three independent experiments; n > 160 cells. ∗p < 0.05 (two-tailed paired Student′s t-test). (C) Upper panel: U2OS cells treated with siRNA control, Rab33b siRNA, or Rab33b siRNA and then transfected with Myc-Rab33b were subjected to ultracentrifugation to separate membrane (M) and cytosolic (C) fractions. The separated fractions were further analyzed by Western blot using an antibody against Exoc6. Antibodies against tubulin and sortilin were used as cytoplasmic and membrane-bound markers, respectively, to control separation between membrane and cytosolic fractions. Lower panel: Lysates from U2OS cells treated with siRNA control, Rab33b siRNA, or Rab33b siRNA and then transiently transfected with Myc-Rab33b were analyzed by Western blot using antibodies against Rab33b and tubulin as a loading control. (D) Quantification of the ratio between membrane-associated and cytosolic Exoc6 in U2OS cells treated with either Rab33b siRNA or Rab33b siRNA and then transiently transfected with Myc-Rab33b relative to the normalized siRNA control sample. The graph shows the mean ± SEM from four independent experiments. ∗∗p < 0.01, n.s., not significant (two-tailed paired Student′s t-test).
Figure 7
Figure 7
VSV-G transport to the cell surface is inhibited by Rab33b depletion (A) U2OS cells silenced with control siRNA, siRNA against Rab33b, or silenced with Rab33b siRNA and transfected with RFP-Rab33b (red), were transfected with YFP-VSV-G (green) and incubated at 39°C for 16 h. Cells were then fixed either immediately (T0), 20 min (T20), or 90 min (T90) after a shift to 32°C. Scale bar: 10 μm. (B) Quantification of the VSV-G distribution 90 min after the shift to 32°C. 200 cells were analyzed from three independent experiments and the percentage of cells in which YFP-VSV-G was located at the Golgi, post-Golgi vesicles, and plasma membrane was determined. The graph shows the mean ± SEM ∗p < 0.05, ∗∗p < 0.01, n.s., not significant (two-tailed paired Student′s t-test). See also Figure S4.
Figure 8
Figure 8
Rab33b and Exoc6 transport β1 integrin to FAs (A) U2OS cell transfected with BFP-Rab33b, mCherry-Exoc6, and vinculin-GFP were seeded on fibronectin-coated coverslips for 1 h. Cells were imaged every minute with a spinning disk confocal microscope. Magnifications of the boxed area in the right panels show Exoc6 together with Rab33b at FAs. Scale bars: 5 μm; insets: 1 μm. (B) U2OS cells transfected with GFP-Rab33b were seeded on fibronectin-coated coverslips for 1 h, fixed and then immunostained with antibodies against β1-integrin and Exoc6. DAPI was used to stain the nuclei. The insets show magnifications of the boxed areas. Red circles are drawn around Rab33b-positive vesicles and superimposed in the β1-integrin and Exoc6 channels. Normalized fluorescence intensity profiles along the straight red lines are shown on the right for each channel. Scale bar: 10 μm. (C) U2OS cells transfected with BFP-Rab33b, mApple-β1 integrin, and vinculin-GFP were seeded on fibronectin-coated coverslips for 1 h. Cells were imaged with a spinning disk confocal microscope. The insets show Rab33b (green) and β1 integrin (red) co-localizing on vesicles in proximity of FAs (white). Scale bars: 5 μm; insets: 1 μm. (D) The percentage of vinculin-GFP-positive focal adhesions co-localizing with BFP-Rab33b, mApple-β1 integrin, or both, was calculated by using an object-based colocalization analysis with ImageJ software. The graph shows the mean ± SEM from three independent experiments. n = 9. See also Video S4.

Similar articles

Cited by

References

    1. Ahmed S.M., Nishida-Fukuda H., Li Y., McDonald W.H., Gradinaru C.C., Macara I.G. Exocyst dynamics during vesicle tethering and fusion. Nat. Commun. 2018;9:5140. - PMC - PubMed
    1. Ao X., Zou L., Wu Y. Regulation of autophagy by the Rab GTPase network. Cell Death Differ. 2014;21:348–358. - PMC - PubMed
    1. Bartha A., Gyorffy B. TNMplot.com: a web tool for the comparison of gene expression in normal, tumor and metastatic tissues. Int. J. Mol. Sci. 2021;22:2622. - PMC - PubMed
    1. Bijian K., Lougheed C., Su J., Xu B., Yu H., Wu J.H., Riccio K., Alaoui-Jamali M.A. Targeting focal adhesion turnover in invasive breast cancer cells by the purine derivative reversine. Br. J. Cancer. 2013;109:2810–2818. - PMC - PubMed
    1. Bisel B., Wang Y., Wei J.H., Xiang Y., Tang D., Miron-Mendoza M., Yoshimura S., Nakamura N., Seemann J. ERK regulates Golgi and centrosome orientation towards the leading edge through GRASP65. J. Cel. Biol. 2008;182:837–843. - PMC - PubMed