. 2022 Apr 12;25(5):104236.
doi: 10.1016/j.isci.2022.104236. eCollection 2022 May 20.

Encapsulated actomyosin patterns drive cell-like membrane shape changes

Affiliations

Encapsulated actomyosin patterns drive cell-like membrane shape changes

Yashar Bashirzadeh et al. iScience. .

Abstract

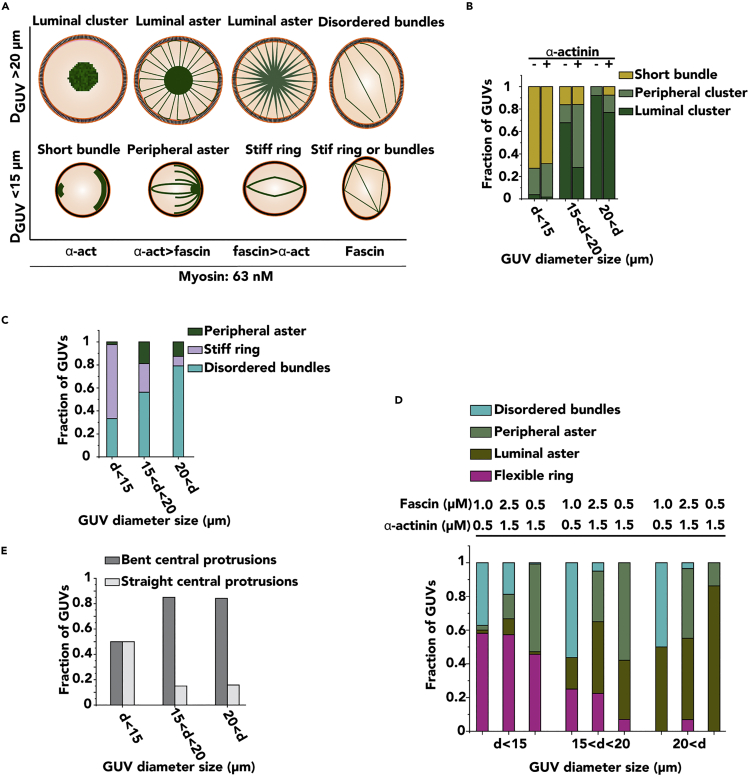
Cell shape changes from locomotion to cytokinesis are, to a large extent, driven by myosin-driven remodeling of cortical actin patterns. Passive crosslinkers such as α-actinin and fascin as well as actin nucleator Arp2/3 complex largely determine actin network architecture and, consequently, membrane shape changes. Here we reconstitute actomyosin networks inside cell-sized lipid bilayer vesicles and show that depending on vesicle size and concentrations of α-actinin and fascin actomyosin networks assemble into ring and aster-like patterns. Anchoring actin to the membrane does not change actin network architecture yet exerts forces and deforms the membrane when assembled in the form of a contractile ring. In the presence of α-actinin and fascin, an Arp2/3 complex-mediated actomyosin cortex is shown to assemble a ring-like pattern at the equatorial cortex followed by myosin-driven clustering and consequently blebbing. An active gel theory unifies a model for the observed membrane shape changes induced by the contractile cortex.

Keywords: Biological sciences; Cell biology; Mechanobiology.


Conflict of interest statement

The authors declare no competing interests.

Figures

None
Graphical abstract
Figure 1
Figure 1
Diverse actomyosin network patterns emerge in confinement (A-F) Representative z-projected confocal images of actin networks in the presence of myosin, α-actinin, and/or fascin at the indicated concentrations. Actin, 5 μM. Scale bars, 10 μm. n = 2 experiments per condition. (D) Green arrows represent actin bundle rings in small GUVs. Red arrow points to a large GUV with encapsulated actin aster and ring. (F) Yellow arrows show actin aster with long actin bundles bent at the GUV periphery. These actin bundles turned and elongated toward GUV lumen and may appear as axially symmetric structures in 2D (green arrow). Cyan arrow shows an actin aster pattern with bundle length shorter or equal to GUV radius. Pink arrow points to two peripheral actin asters formed at two poles of a GUV. Also see Figures S2–S4.
Figure 2
Figure 2
Phase diagram and analysis of actomyosin pattern formation as a function of GUV size and concentration of α-actinin and fascin (A) Phase diagram of encapsulated actomyosin patterns that are likely to form as a function of GUV size and relative concentration of actin crosslinkers. (B-E) Bar graphs of the frequency of actomyosin phenotypes depicted in Figure 1. Actin, 5 μM. Myosin, 63 nM. (B) Fraction of GUVs with size-dependent actomyosin network phenotypes in the presence (0.5 μM) or absence of α-actinin. (C) Fraction of GUVs with size-dependent actomyosin network phenotypes in the presence of 1 μM fascin. (D) Bar graphs demonstrating quantification of different GUV size-dependent phenotypes in the presence of α-actinin and fascin at the indicated concentrations. (E) Fraction of GUVs of either kinked or straight actomyosin asters in the presence of α-actinin (1.5 μM) and fascin (0.5 μM). For bar graphs, n = 2 experiments per condition. Number of analyzed GUVs >42 per experiment per condition.
Figure 3
Figure 3
Enhanced actin-membrane interaction does not change the architecture of contractile actin patterns but suppresses actin bundle protrusion (A) Representative z-projected confocal images of membrane-bound actin bundles in the presence of α-actinin at concentrations indicated. Actin, 5 μM. Scale bars, 10 μm n = 2 experiments. (B) Representative z-projected confocal images of short peripheral actin asters formed in the presence of myosin and α-actinin at concentrations indicated. Actin, 5 μM. Scale bar, 10 μm. n = 2 experiments. (C) Representative z-projected confocal images of membrane-bound actin in the presence of myosin, α-actinin, and fascin at concentrations indicated. White arrows show aggregated actin-streptavidin linkages at the site of actin cluster. Actin, 5 μM. Scale bar, 10 μm. n = 2 experiments. (D) Schematic illustration of clustering of membrane-bound actin networks and the emergence of short actin asters (left) and normalized frequency of GUV size-dependent appearance of different actomyosin network phenotypes (right) in the presence of myosin and α-actinin under the conditions in (b). (E) Schematic illustration of the effect of fascin on the architecture of cortical actomyosin patterns in large GUVs (diameter >20 μm). Although attachment to GUV membrane suppresses protrusion, α-actinin and fascin together form aster structures elongating into the lumen of GUVs (left). Normalized frequency of GUV size-dependent appearance of different actomyosin network phenotypes under this condition (c) is shown on the right. For bar graphs, n = 2 experiments per condition. Number of analyzed GUVs >33 per experiment per condition. Also see Figures S5 and S6.
Figure 4
Figure 4
Membrane-bound contractile ring patterns deform GUV membrane (A) Representative fluorescence confocal actin images showing a time-lapse of contractile ring assembly in the presence of myosin, fascin, and α-actinin as well as z-projected confocal images of α-actinin, myosin, and merged images of the ring at the last time point (38 min). At the first two time points, actin images were captured as single 2D images before GUV settlement. The red arrow shows the region where maximum ring constriction occurs. Dashed lines show the line along which actin, myosin, and α-actinin intensities were quantified. Actin 5 μM. Myosin, 63 nM α-Actinin, 1.5 μM. Fascin, 2.5 μM. Scale bar, 10 μm. (B) Schematic illustration of parameters used to calculate contractile force (Fc) as a function of membrane tensions (σ1,σ2). (C) Average values of maximum actin intensity along the three white dashed lines in (a). Intensity values were normalized to average intensity along each line. (D) Schematic illustration of myosin-induced clustering and contractile ring assembly in a GUV.
Figure 5
Figure 5
Dendritic actomyosin networks in the presence of actin crosslinkers self-assemble into a ring-like equatorial cortex (A) Representative fluorescence confocal actin images of a crosslinked actomyosin cortex 0 and 10 min after imaging. Representative 3D reconstructed fluorescence confocal images of a membrane-bound actomyosin cortex in the presence of VCA, Arp2/3 complex, α-actinin, and fascin at different time points. (B) Color map of actin intensities in (A). (C) Representative z-projected confocal actin images of a crosslinked actomyosin cortex 0 and 70 min after imaging. (D) Another example of a 3D reconstructed fluorescence confocal actin images of a crosslinked actomyosin cortex 0 and 70 min after imaging. White arrow points at the ring-like cluster around the neck of the deformed membrane. (E) Schematic representation of 2D top view (left) and 3D side view (right) of an encapsulated actin cortex with highly enriched actin at its mid plane. The red dashed lines represent radial lines along which maximum actin intensities are plotted in (F). (F) Actin cortex intensity around equally spaced circular z-planes from the top plane to mid plane of the GUV in (D). Actin intensity (y axis) at each plane (color map) was measured by detecting maximum intensity along 30 radial lines (red dashed lines in (E) drawn with an equal angular interval (x-axis). Red arrows point at the intensity of actin clusters at the GUV equatorial plane. (G) The mean value of normalized actin cortex intensity from top plane to mid plane of six GUVs. Normalized mean intensity (y axis) for each cortex was measured by taking the mean value of maximum intensities along 30 radial lines (red dashed lines in (E)) from top plane to mid plane of each GUV (x-axis) with z-interval of 2.4 μm averaged over the mean value at each z-plane. (H) Representative fluorescence confocal images of actin, lipid, and merged lipid-actin for a GUV with a bleb-like protrusion. Actin: 5 μM, Arp2/3 complex: 1 μM; His6-tagged VCA: 0.5 μM, α-actinin: 0.5 μM, and fascin: 1 μM for all panels. All scale bars are 10 μm. n = 2 experiments. Also see Figures S7 and S8.
Figure 6
Figure 6
A physical model explains how cortex tension and clustering induce GUV deformation The schematic illustrates parameters used for modeling membrane deformation and bleb formation induced by actin cortex contraction and clustering.

Similar articles

Cited by

References

    1. Backouche F., Haviv L., Groswasser D., Bernheim-Groswasser A. Active gels: dynamics of patterning and self-organization. Phys. Biol. 2006;3:264. doi: 10.1088/1478-3975/3/4/004. - DOI - PubMed
    1. Bashirzadeh Y., Chatterji S., Palmer D., Dumbali S., Qian S., Maruthamuthu V. Stiffness measurement of soft silicone substrates for mechanobiology studies using a widefield fluorescence microscope. J. Visualized Experiments. 2018:57797. doi: 10.3791/57797. - DOI - PMC - PubMed
    1. Bashirzadeh Y., Dumbali S., Qian S., Maruthamuthu V. Mechanical response of an epithelial island subject to uniaxial stretch on a hybrid silicone substrate. Cell Mol. Bioeng. 2019;12:33–40. doi: 10.1007/s12195-018-00560-1. - DOI - PMC - PubMed
    1. Bashirzadeh Y., Liu A.P. Encapsulation of the cytoskeleton: towards mimicking the mechanics of a cell. Soft Matter. 2019;15:8425–8436. - PubMed
    1. Bashirzadeh Y., Qian S., Maruthamuthu V. Non-intrusive measurement of wall shear stress in flow channels. Sensors Actuators A: Phys. 2018;271:118–123. doi: 10.1016/J.SNA.2018.01.012. - DOI

LinkOut - more resources