. 2022 Apr 13;25(5):104249.
doi: 10.1016/j.isci.2022.104249. eCollection 2022 May 20.

L3MBTL2-mediated CGA transcriptional suppression promotes pancreatic cancer progression through modulating autophagy

Affiliations

L3MBTL2-mediated CGA transcriptional suppression promotes pancreatic cancer progression through modulating autophagy

Hua Huang et al. iScience. .

Abstract

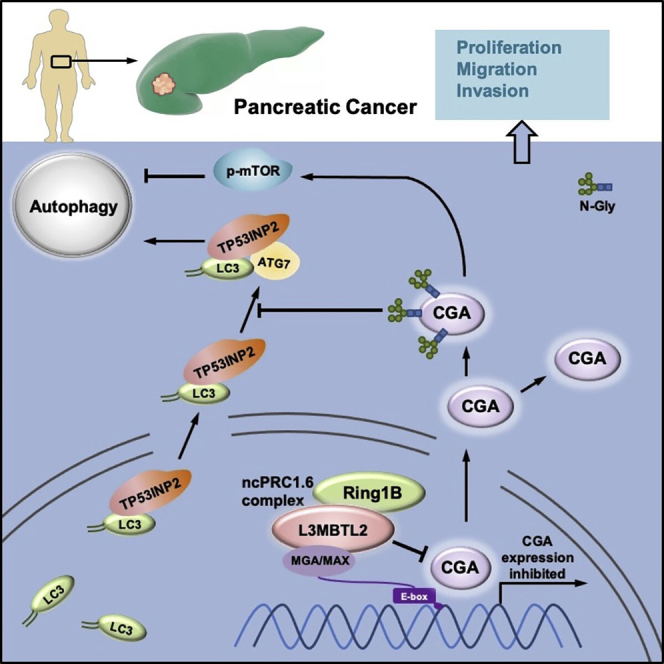
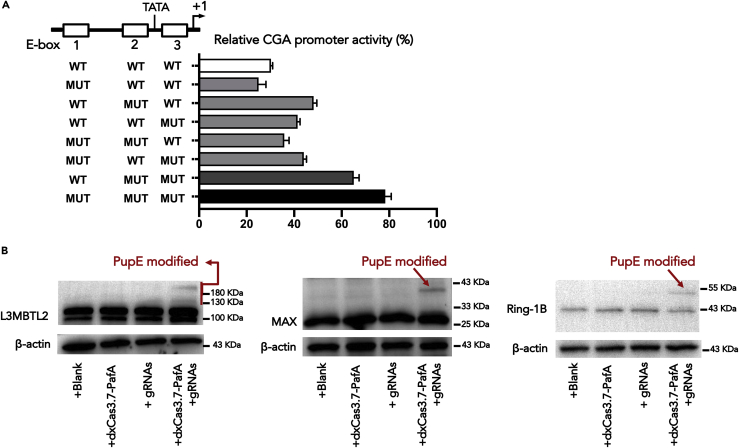
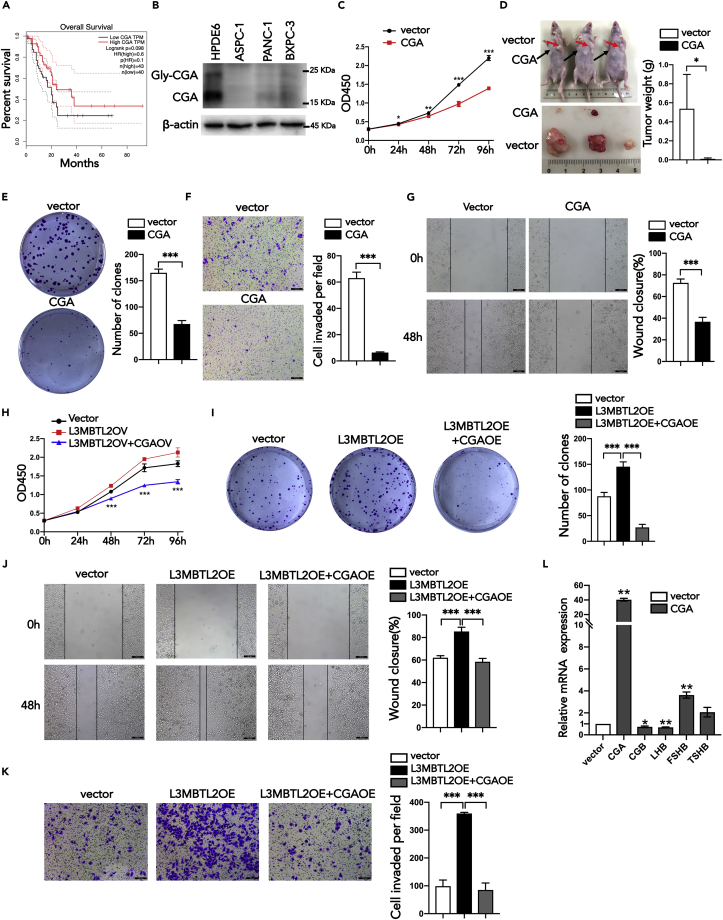
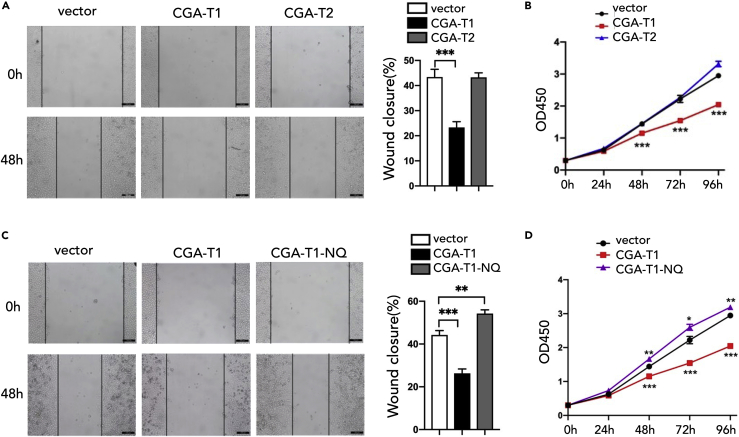
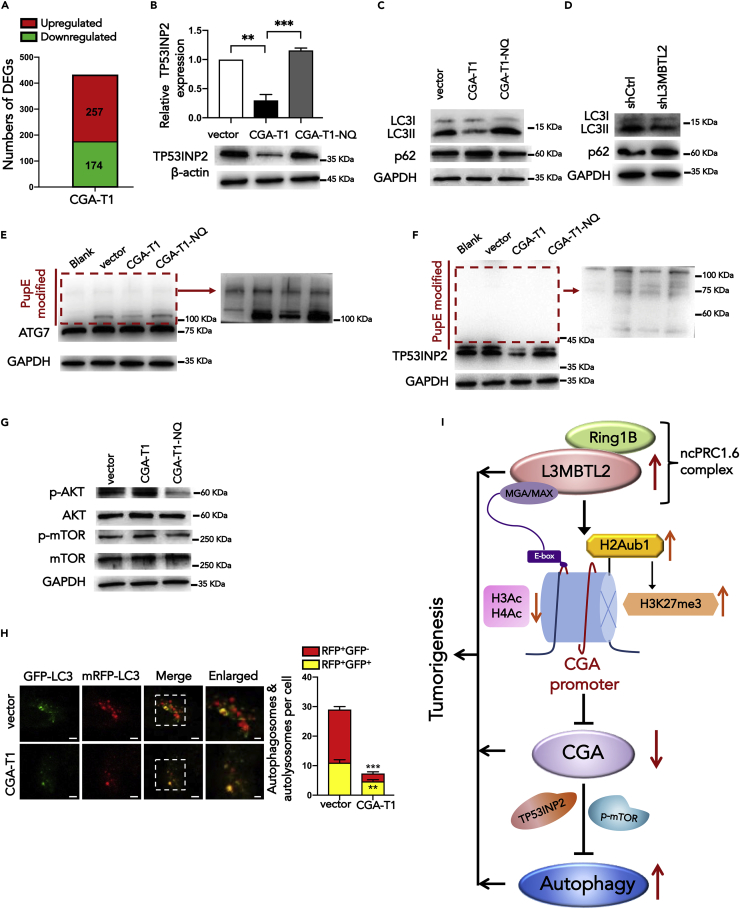
L3MBTL2 is a crucial component of ncPRC1.6 and has been implicated in transcriptional repression and chromatin compaction. However, the repression mechanism of L3MBTL2 and its biological functions are largely undefined. Here, we found that L3MBTL2 plays a distinct oncogenic role in tumor development. We demonstrated that L3MBTL2 repressed downstream CGA through an H2AK119ub1-dependent mechanism. Importantly, the binding of the MGA/MAX heterodimer to the E-box on the CGA promoter enhanced the specific selective repression of CGA by L3MBTL2. CGA encodes the alpha subunit of glycoprotein hormones; however, we showed that CGA plays an individual tumor suppressor role in PDAC. Moreover, CGA-transcript1 (T1) was identified as the major transcript, and the tumor suppression function of CGA-T1 depends on its own glycosylation. Furthermore, glycosylated CGA-T1 inhibited PDAC, partly by repression of autophagy through multiple pathways, including PI3K/Akt/mTOR and TP53INP2 pathways. These findings reveal the important roles of L3MBTL2 and CGA in tumor development.

Keywords: Biological sciences; Cancer; Cell biology.


Conflict of interest statement

The authors declare no competing interests

Figures

None
Graphical abstract
Figure 1
Figure 1
L3MBTL2 is required for the tumorigenesis and metastasis of PDAC cells (A) Box plot showing the relative mRNA levels of L3MBTL2 in pancreatic cancer tissues (n = 179) and nontumor tissues (n = 171) according to the TCGA and GTEX database. (B) The relative mRNA and protein levels of L3MBTL2 in pancreatic cancer cells and pancreatic ductal epithelial cells. (C) The overexpression and knockdown of L3MBTL2 in PANC-1 cells were confirmed by qPCR and western blotting. (D) Proliferation of PANC-1 cells expressing exogenous L3MBTL2, vector, shL3MBTL2(1,2), and shCtrl. (E) Representative images of the clone forming an assay of the indicated cells. (F and G), wound healing assays (F), Transwell assays (G) of PANC-1 cells expressing exogenous L3MBTL2, vector, shL3MBTL2(1,2), and shCtrl. Scale bars, 100 μm (H and I), the volumes and weight of subcutaneous tumors from the indicated groups. Data are presented as means ± SD (n = 3). ∗p < 0.05, ∗∗p < 0.01, ∗∗∗p < 0.001, t-tests.
Figure 2
Figure 2
CGA is a downstream target of L3MBTL2 (A) RNA-seq were used to identify differentially expressed genes in L3MBTL2 stably knockdown cells when compared with their corresponding controls (fold change >2 or 2.0, p < 0.05). (B) The relative mRNA levels of CGA, CDKN1A, FN1, S100P, and CLIC3 in RNA-seq of PANC-1 cells after L3MBTL2 knockdown. (C) KEGG pathway enrichment analysis of DEGs was performed to identify functionally related gene pathways. The top 10 enriched signaling pathways are shown and are ranked on the basis of log10(P-value). (D) qPCR and western blotting were performed to determine the mRNA and protein levels of CGA in shL3MBTL2 and shCtrl cells. (E) Western blotting analysis of CGA in PANC-1 cells expressing exogenous CGA-T1, CGA-T1-NQ, CGA-T2, CGA-T2-NQ, shCtrl, and shL3MBTL2. (F) A luciferase reporter assay evaluated the effect of L3MBTL2 overexpression and knockdown on the transcriptional activity of CGA in PANC-1 cells. Firefly luciferase activity was normalized to Renilla luciferase activity and expressed as the mean ± SD. Data are presented as means ± SD (n = 3). ∗p < 0.05, ∗∗p < 0.01, ∗∗∗p < 0.001, t-tests.
Figure 3
Figure 3
L3MBTL2 represses CGA by mediating histone modifications (A) Overexpression of L3MBTL2 correlates with increased H2AK119ub1, HDAC1, and H3K27me3 at the CGA promoter but does not affect H3K9me3 and H3K36me3. ChIP of IgG control antiserum, HDAC1, H3Ac, H3K27me3, H3K9me3, and H3K36me3 (left to right) followed by qPCR analysis of CGA in PANC-1 cells. (B) Schematic of dCas9 fusion constructs, dCas9-USP16, dCas9-EP300, dCas9-HDAC3, dCas9-KDM6B, and different gRNA constructs. (C, D, and F), Relative mRNA levels of CGA in L3MBTL2-overexpressing PANC-1 cells co-transfected with either dCas9 fusion proteins (dCas9-USP16 (C), dCas9-EP300 (D), and dCas9-KDM6B (F)) or dCas9 empty vector and the indicated gRNAs. (E) Relative mRNA levels of CGA in L3MBTL2 knockdown PANC-1 cells co-transfected with either dCas9-HDAC3 or dCas9 empty vector and the indicated gRNAs. Data are presented as means ± SD (n = 3). ∗p < 0.05, ∗∗p < 0.01, ∗∗∗p < 0.001, t-tests.
Figure 4
Figure 4
L3MBTL2, MAX, and RING1B synergistically inhibit CGA expression (A) The proximal CGA promoter contains three E-box elements. The plasmid containing the wild-type sequence of the CGA promoter (WT) or mutations in different E-boxes (MUT) was co-transfected with either the pcDNA3.1-L3MBTL2 plasmid or the pcDNA3.1 empty vector. Data are presented as the relative Luc activity of CGA promoters in the presence of exogenous L3MBTL2 as a percentage of the activity of the same reporter in transfections with the control vector. Data are presented as means ± SD (n = 3). (B) In vitro Pup(E) modification assay of L3MBTL2 overexpressed cells co-transfected with dxCas3.7-PafA and gRNAs. Western blots showed Pup(E) modification of L3MBTL2, MAX, and RING1B.
Figure 5
Figure 5
CGA inhibits pancreatic cancer progression (A) The correlations between the expression of CGA and patient survival rate. (B) The protein levels of CGA in pancreatic cancer cells and pancreatic ductal epithelial cells. (C) Cell proliferation of PANC-1 cells expressing exogenous CGA. (D) The volumes and weight of subcutaneous tumors formed by PANC-1 cells expressing exogenous CGA and vectors. (E) Clone forming assay of CGA-overexpressing PANC-1 cells. (F and G) Transwell assays (F) and wound healing assays (G) of PANC-1 cells expressing exogenous CGA and vectors. (H–K) CGA overexpression abolished the promotion of cell proliferation (H), colony formation capacity (I), migration (J) and invasion (K) caused by overexpression of L3MBTL2 in PANC-1 cells. (L) The relative mRNA levels of CGA, CGB, LHB, FSHB, and TSHB in CGA-overexpressing PANC-1 cells. Data are presented as means ± SD (n = 3). ∗p < 0.05, ∗∗p < 0.01, ∗∗∗p < 0.001, t-tests. Scale bars, 100 μm (F, G, J and K).
Figure 6
Figure 6
Glycosylated CGA-T1 inhibits pancreatic cancer progression (A and B) wound healing (A) and proliferation assay (B) of PANC-1 cells expressing exogenous vector, CGA-T1, and CGA-T2. (C and D) wound healing (C) and proliferation (D) assays of PANC-1 cells expressing exogenous vector, CGA-T1, and CGA-T1-NQ. Data are presented as means ± SD (n = 3). ∗p < 0.05, ∗∗p < 0.01, ∗∗∗p < 0.001, t-tests. Scale bars, 100 μm (A and C).
Figure 7
Figure 7
Glycosylated CGA-T1 inhibits autophagy in PDAC (A) Differentially expressed genes with over 2-fold expression changes in PANC-1 cells expressing exogenous CGA-T1 compared with control cells, according to RNA-seq results. (B) The relative mRNA and protein levels of TP53INP2 in PANC-1 cells after CGA-T1 and CGA-T1-NQ overexpression. (C) Comparison of LC3II and P62 expression in PANC-1 cells overexpressed CGA-T1, CGA-T1-NQ, and control vector by Western blot analyses. (D) Western blotting analysis of LC3II and P62 expression in shL3MBTL2 cells. (E and F) In vitro PupE modification assay of PANC-1-vector, PANC-1-CGA-T1-OE, and PANC-1-CGA-T1-NQ-OE cells transfected with LC3B-PafA-IRES-PupE vector. PANC-1-vector cells transfected with the PafA-IRES-PupE vector were used as the blank group. Western blots showed PupE modification of ATG7 (E) and TP53INP2 (F), indicating interaction of LC3-ATG7 and LC3-TP53INP2. Because of the difference in protein content, the red box area developed separately and showed multiple modification bands. (G) Western blotting analysis of the p-AKT, AKT, p-mTOR, and mTOR protein expression in PANC-1 cells expressing exogenous vector, CGA-T1, and CGA-T1-NQ. GAPDH served as the internal control. (H) The autophagic flux was detected in indicated cells that were transfected with mRFP-GFP-LC3 plasmid. Scale bar, 5 μm, scale bar in enlarged image, 2 μm. The numbers of red puncta (RFP+GFP) versus yellow puncta (RFP+GFP+) per cell in each cell line were quantified. (I) A Schematic representation of L3MBTL2 interacting with PRC1.6 complexes to mediate the regulation of histone modifications (upregulated H2Aub1 and H3K27me3 and downregulated H3 and H4 acetylation), which synergistically repress CGA transcription. The MAX/MGA heterodimer is required for targeting PRC1.6 to the CGA promoter by binding to its E-boxes. CGA plays an individual tumor suppressor role in PDAC, which is associated with its negative regulation of autophagy through multiple pathways, including PI3K/Akt/mTOR and TP53INP2 pathways. The upregulation of L3MBTL2, L3MBTL2-mediated CGA repression, and suppressed CGA-mediated upregulation of autophagy promotes tumorigenesis in pancreatic cancer. Data are presented as means ± SD (n = 3). ∗p < 0.05, ∗∗p < 0.01, ∗∗∗p < 0.001, t-tests.

Similar articles

Cited by

References

    1. Bieche I., Latil A., Parfait B., Vidaud D., Laurendeau I., Lidereau R., Cussenot O., Vidaud M. CGA gene (coding for the alpha subunit of glycoprotein hormones) overexpression in ER alpha-positive prostate tumors. Eur. Urol. 2002;41:335–341. doi: 10.1016/s0302-2838(02)00020-9. - DOI - PubMed
    1. Bieche I., Parfait B., Le Doussal V., Olivi M., Rio M.C., Lidereau R., Vidaud M. Identification of CGA as a novel estrogen receptor-responsive gene in breast cancer: an outstanding candidate marker to predict the response to endocrine therapy. Cancer Res. 2001;61:1652–1658. - PubMed
    1. Blackledge N.P., Farcas A.M., Kondo T., King H.W., Mcgouran J.F., Hanssen L.L.P., Ito S., Cooper S., Kondo K., Koseki Y., et al. Variant PRC1 complex-dependent H2A ubiquitylation drives PRC2 recruitment and polycomb domain formation. Cell. 2014;157:1445–1459. doi: 10.1016/j.cell.2014.05.004. - DOI - PMC - PubMed
    1. Bonasio R., Lecona E., Reinberg D. MBT domain proteins in development and disease. Semin. Cell Dev. Biol. 2010;21:221–230. doi: 10.1016/j.semcdb.2009.09.010. - DOI - PMC - PubMed
    1. Chin W.W., Kronenberg H.M., Dee P.C., Maloof F., Habener J.F. Nucleotide sequence of the mRNA encoding the pre-alpha-subunit of mouse thyrotropin. Proc. Natl. Acad. Sci. U S A. 1981;78:5329–5333. doi: 10.1073/pnas.78.9.5329. - DOI - PMC - PubMed