. 2022 Apr 28;126(16):7143-7151.
doi: 10.1021/acs.jpcc.2c00779. Epub 2022 Apr 18.

Chasing Vibro-Polariton Fingerprints in Infrared and Raman Spectra Using Surface Lattice Resonances on Extended Metasurfaces

Affiliations

Chasing Vibro-Polariton Fingerprints in Infrared and Raman Spectra Using Surface Lattice Resonances on Extended Metasurfaces

Francesco Verdelli et al. J Phys Chem C Nanomater Interfaces. .

Abstract

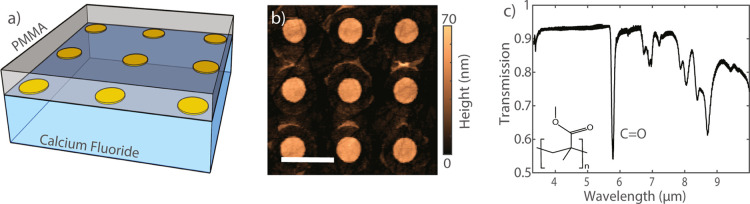
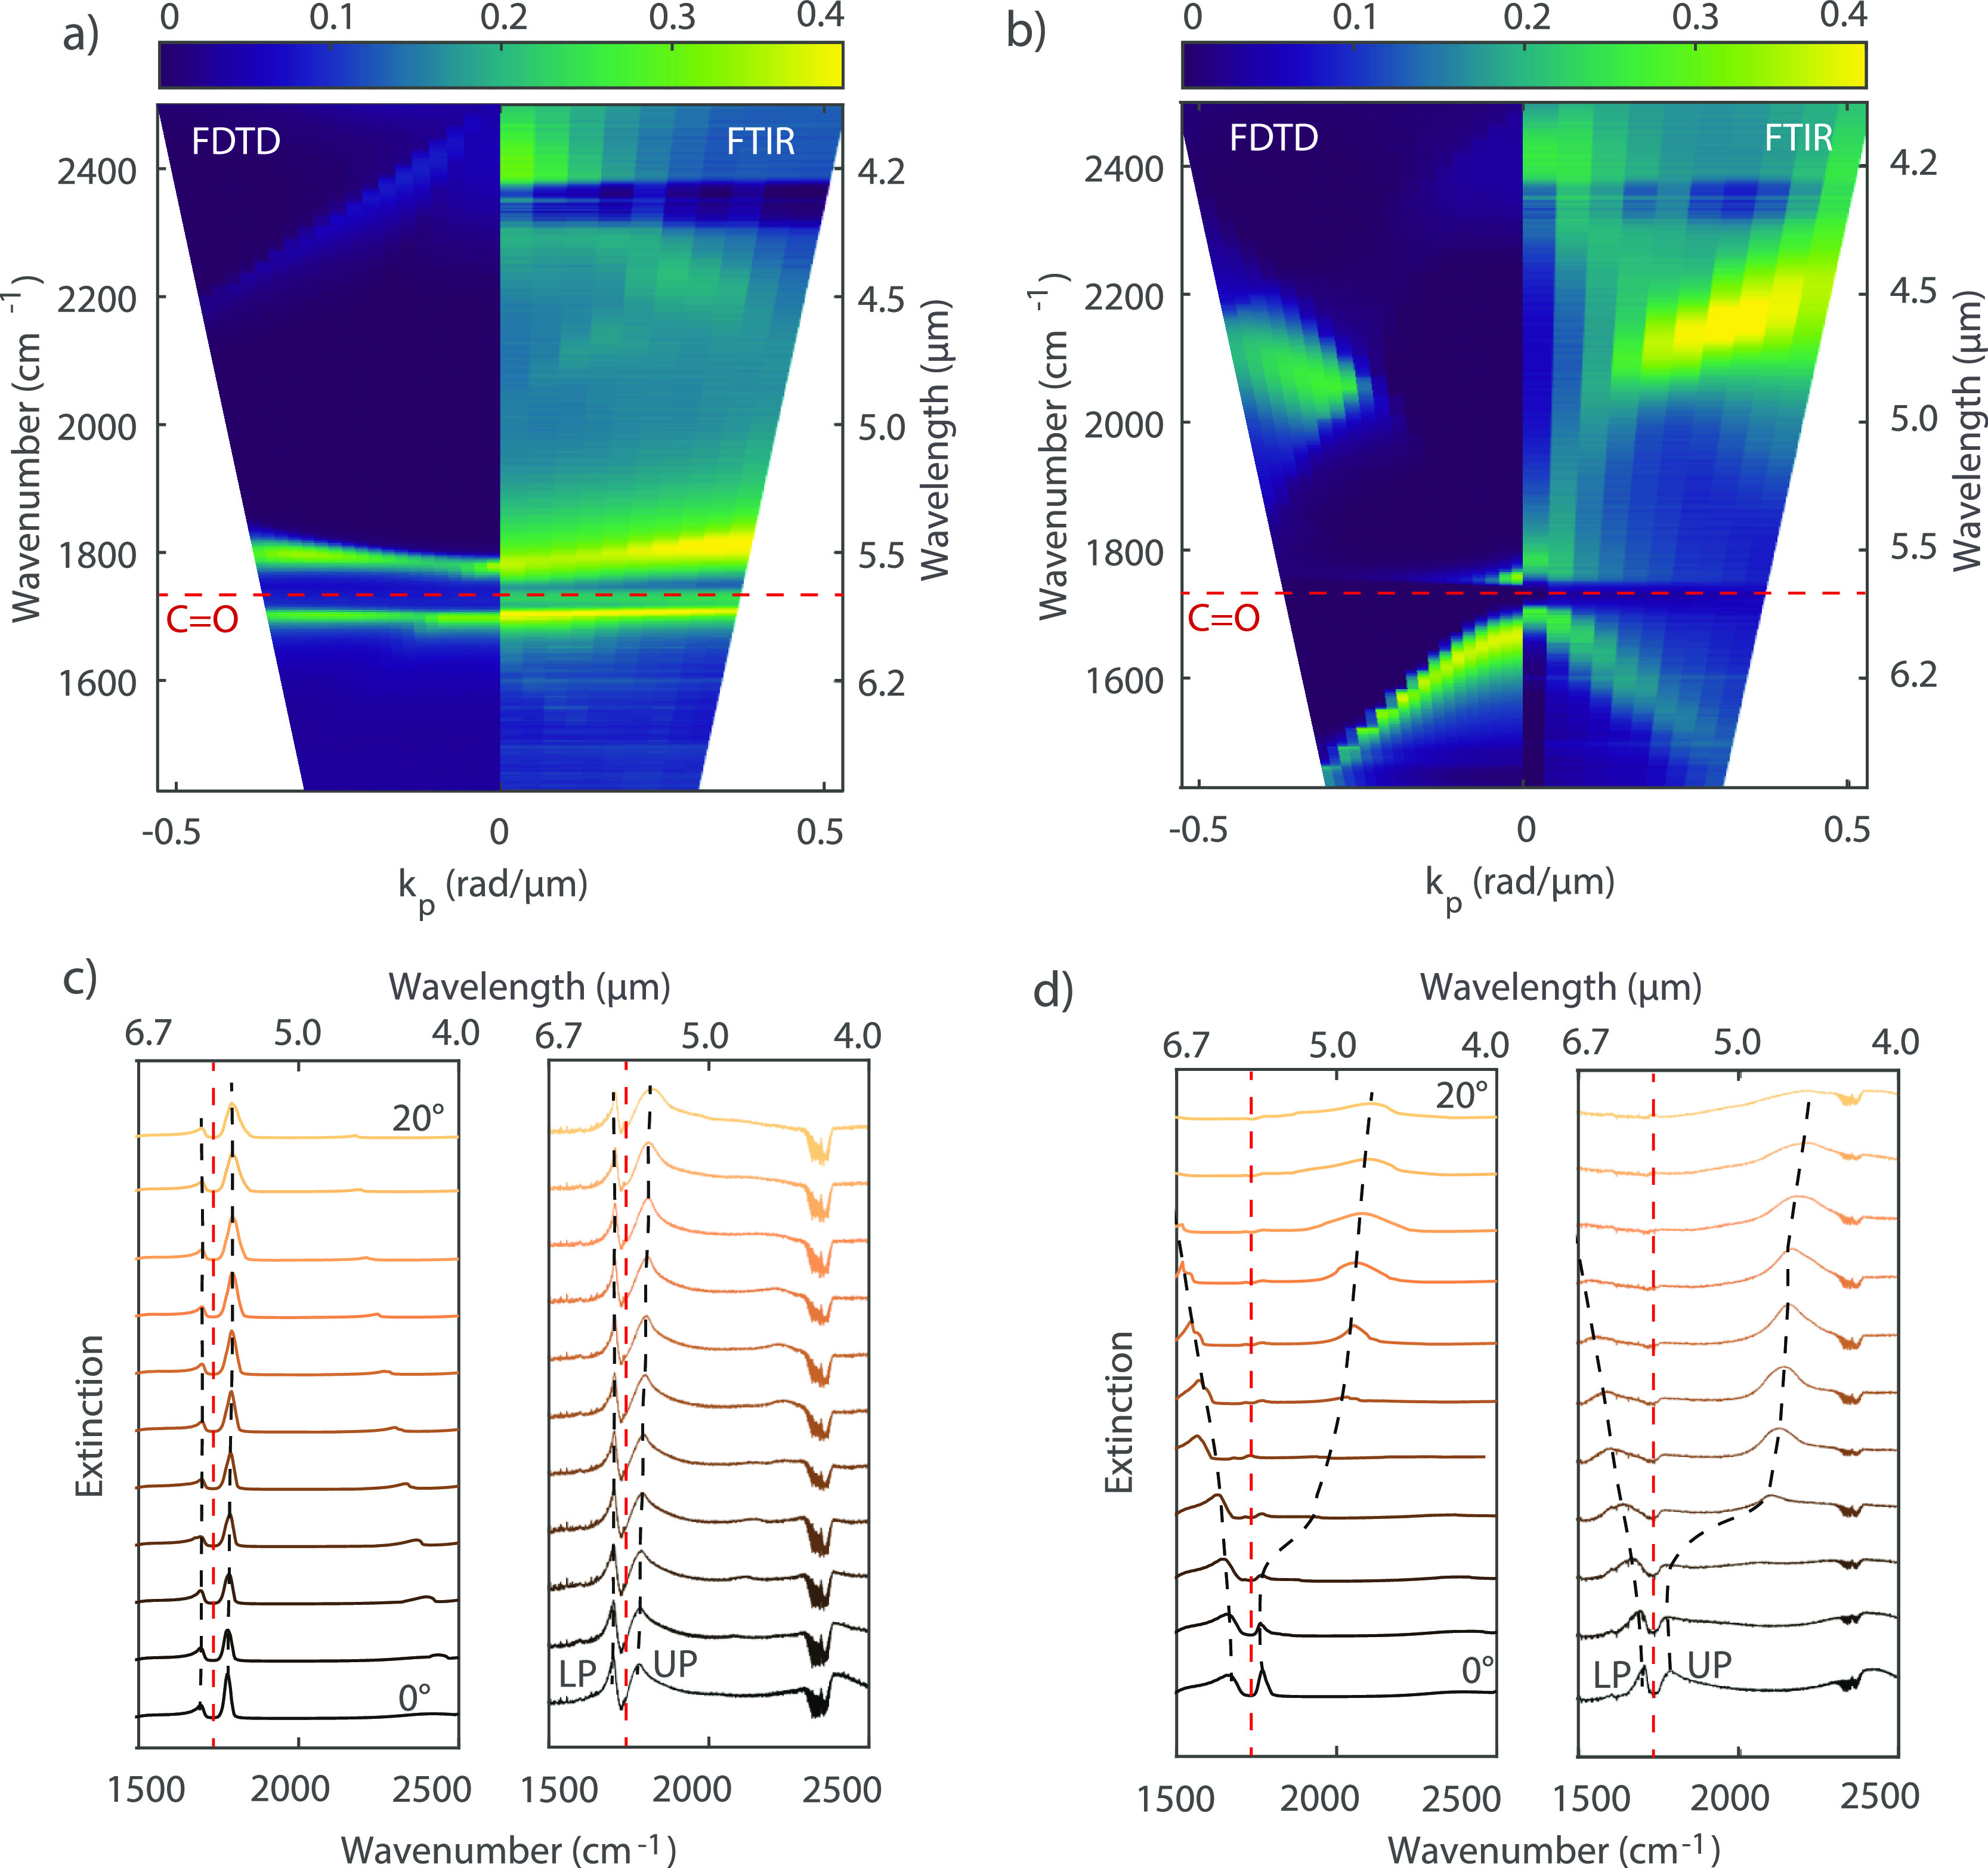
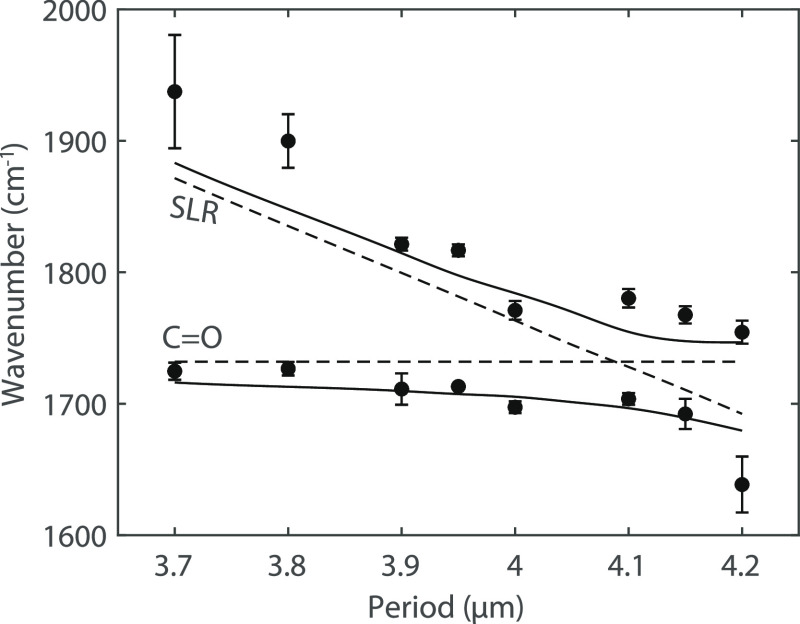
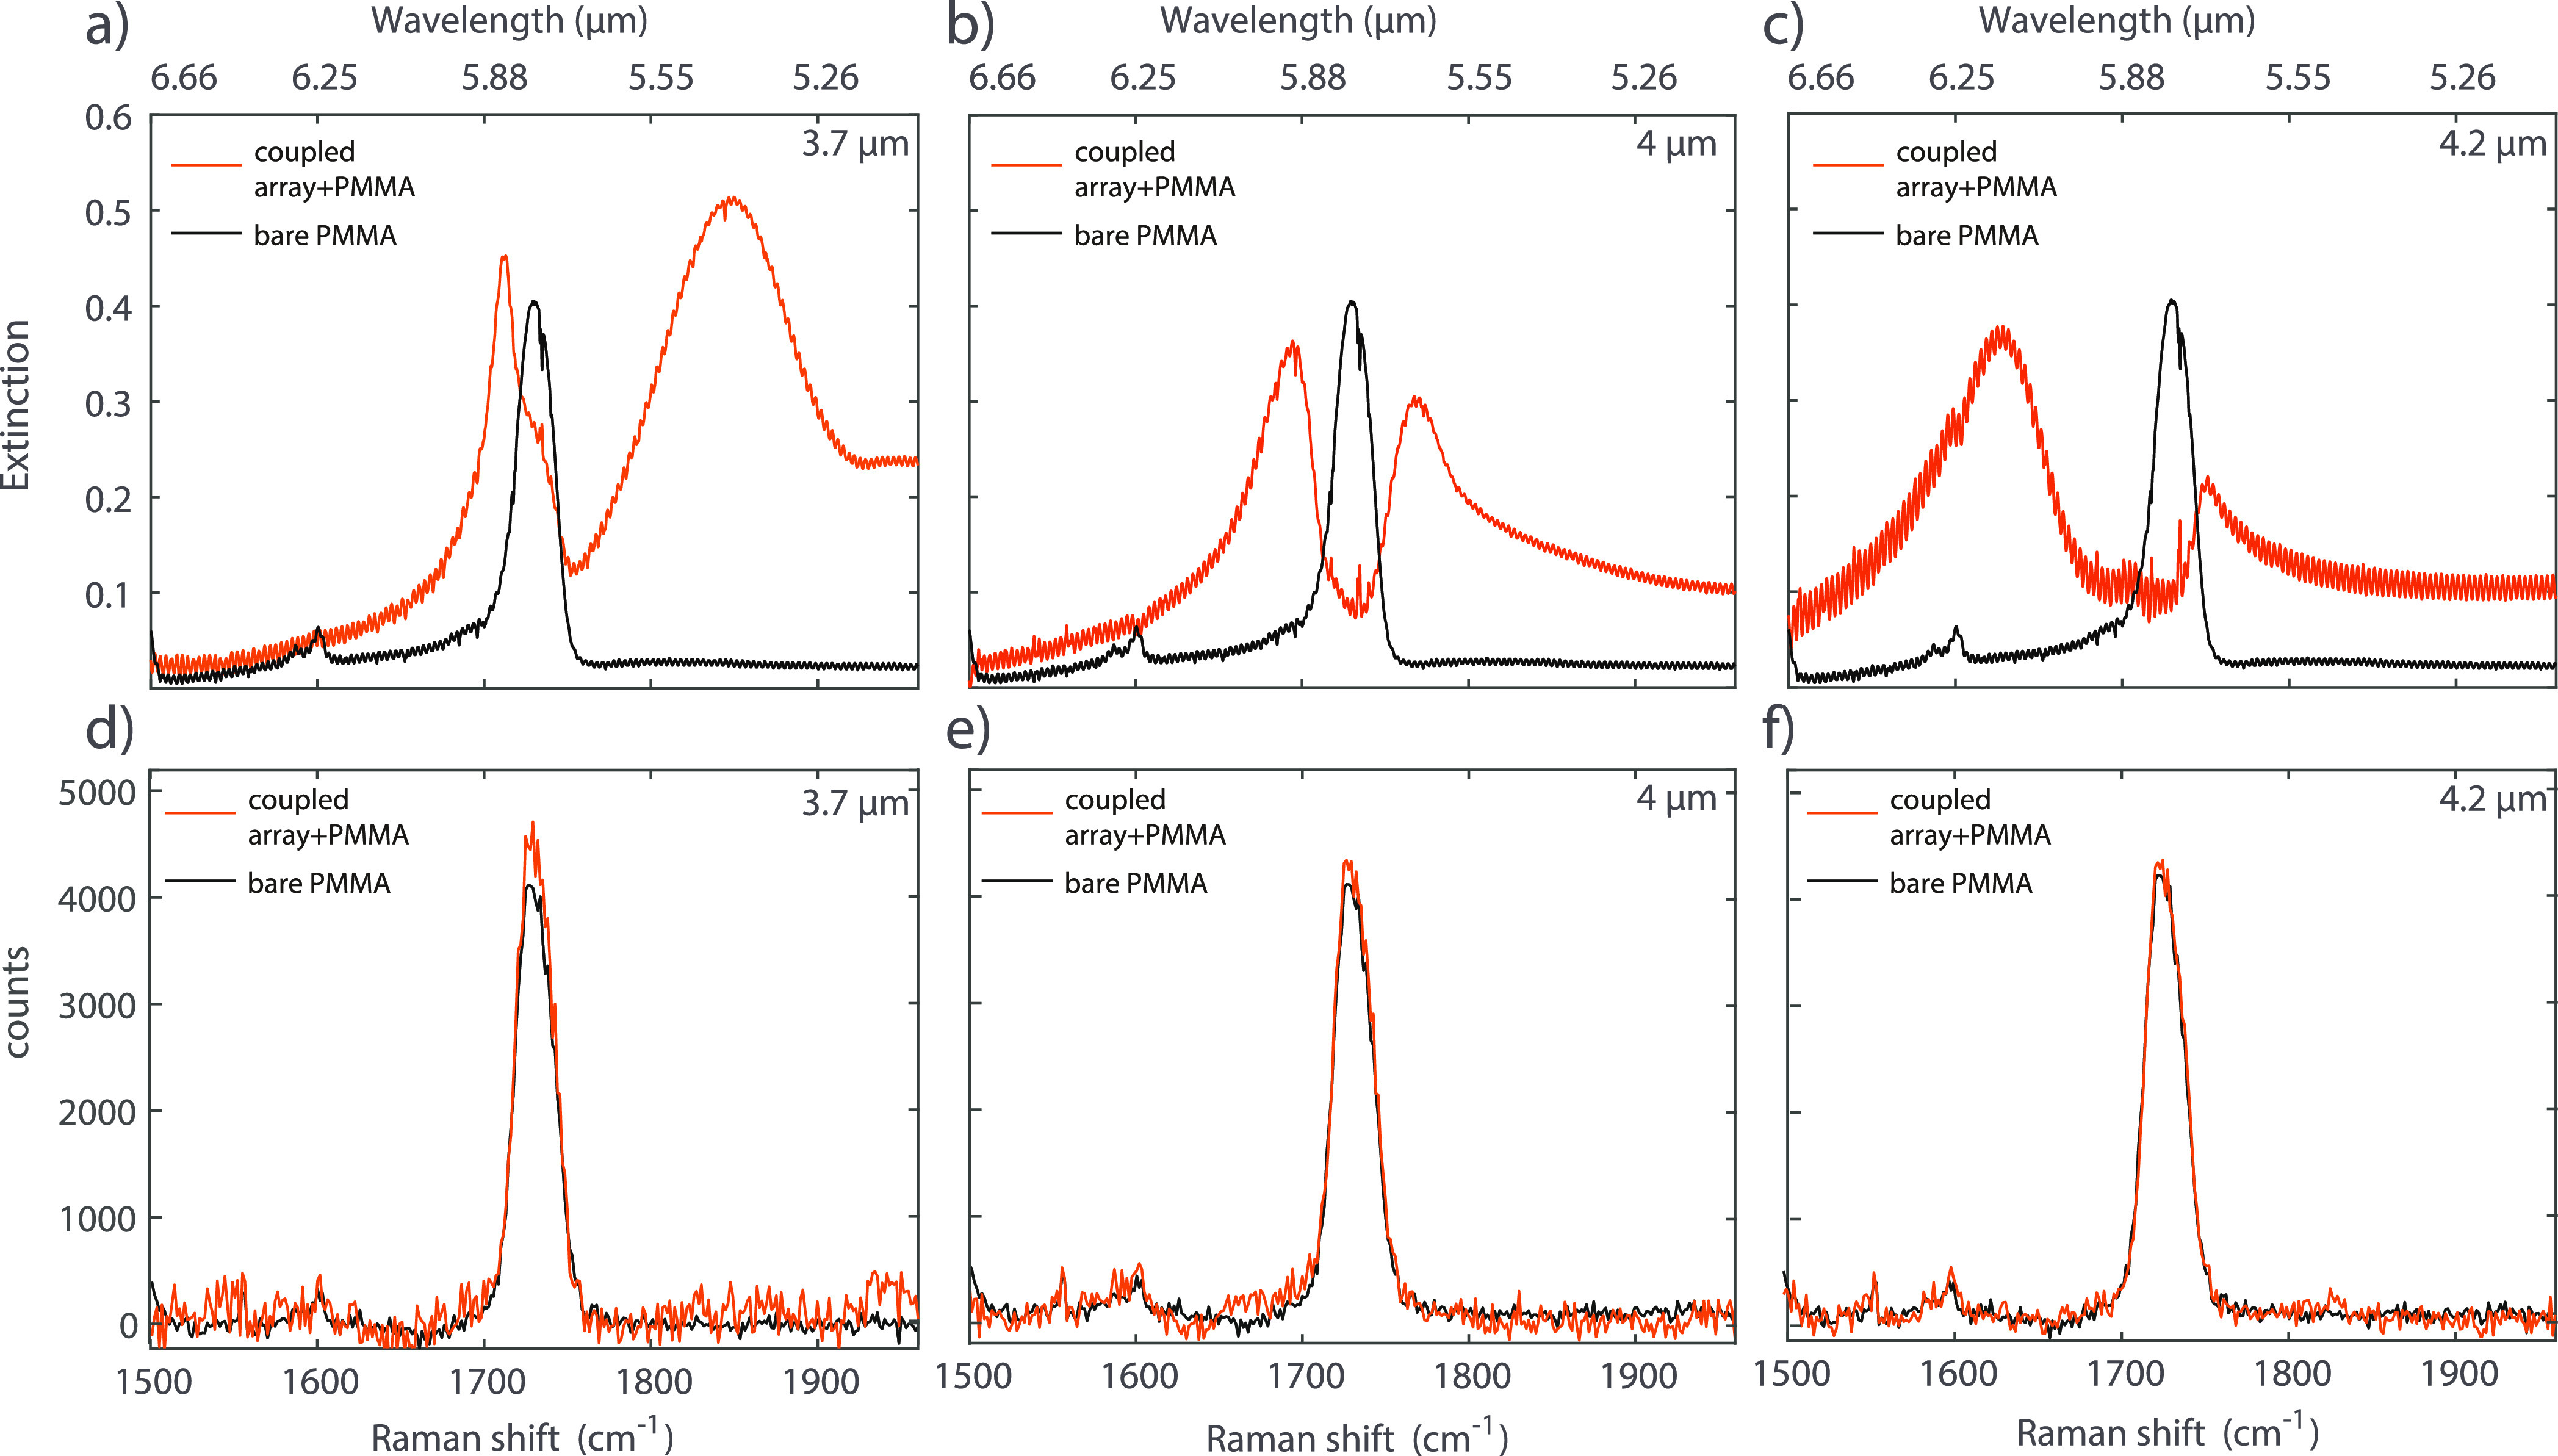
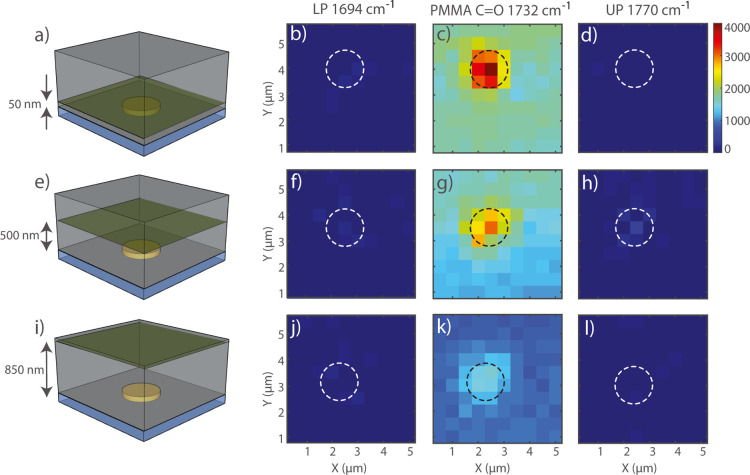
We present an experimental investigation of vibrational strong coupling of C=O bonds in poly(methyl methacrylate) to surface lattice resonances (SLRs) on arrays of gold particles in infrared and Raman spectra. SLRs are generated from the enhanced radiative coupling of localized resonances in single particles by diffraction in the array. Compared to previous studies in Fabry-Perot cavities, particle arrays provide a fully open system that easily couples with external radiation while having large field confinement close to the array. We control the coupling by tuning the period of the array, as evidenced by the splitting of the C=O vibration resonance in the lower and upper vibro-polaritons of the IR extinction spectra. Despite clear evidence of vibrational strong coupling in IR transmission spectra, both Raman spectroscopy and micro-Raman mapping do not show any polariton signatures. Our results suggest that the search for vibrational strong coupling in Raman spectra may need alternative cavity designs or a different experimental approach.


Conflict of interest statement

The authors declare no competing financial interest.

Figures

Figure 1
Figure 1
Gold microdisk arrays on a CaF2 substrate and PMMA characterization. (a) Schematic illustration of a sample consisting of a microdisk array on a calcium fluoride substrate and covered by a layer of PMMA. (b) Atomic force microscope image of a 3 × 3 particle region of one of the arrays. The scale bar indicates the length of the unit cell, which is 4 μm. The circle-like shadows around the disks are organic residues of the fabrication process that do not influence the array’s SLR. (c) FTIR transmission spectrum of a PMMA thin film. The C=O molecular resonance is indicated. The molecular structure of PMMA is shown as an inset.
Figure 2
Figure 2
FDTD simulations and IR extinction measured with an FTIR spectrometer by varying the angle of incidence from normal up to 20° for (a) p-polarized light and (b) s-polarized light. (c) FDTD simulations of the amplitude enhancement of the scattered electric field E/E0 at the height of 400 nm above the substrate and wavenumber of 1732 cm–1 (xy cross-section). The black dotted lines on the central particle show the position where the yz cross-section and the xz cross-section are investigated. Amplitude enhancement of the scattered electric field in (d) the yz and (e) xz planes at 1732 cm–1.
Figure 3
Figure 3
Extinction spectra of a strongly coupled array simulated and measured at different angles of incidence. The simulations are multiplied by 0.4 to facilitate the comparison. (a) Comparison between simulated and measured extinction for p-polarized light. (b) Comparison between simulated and measured extinction for s-polarized light. Polaritons are clearly visible for both polarizations around the C=O bond wavenumber (1732 cm–1) indicated by the red dashed line. (c) Simulated (left) and measured (right) spectra for different angles of incidence and p-polarized light. These spectra have been displaced vertically for clarity. The red dotted curve represents the spectral position of the C=O vibration. The black dotted lines are a guide to the eyes for the lower and upper polaritons. The feature in all spectra around 2400 cm–1 is the CO2 signature peak in the mIR. (d) Simulated (left) and measured (right) spectra for different angles of incidence and s-polarized light.
Figure 4
Figure 4
Polariton wavenumbers (solid circles) as a function of the period of the array defining the SLR detuning from the C=O bond. The dashed lines correspond to the C=O bond and the SLR energy. The solid curves represent the simulated upper and lower polariton energies.
Figure 5
Figure 5
FTIR and Raman spectra of the bare PMMA layer and the coupled systems with different SLR-C=O detunings. FTIR (a) and Raman (d) spectra for the array with a period of 3.7 μm; the black spectra are reference measurements on the bare PMMA layer, while the orange spectra are the measurements on the coupled array with PMMA. FTIR (b) and Raman (e) spectra for the array with a period of 4 μm. FTIR (c) and Raman (f) spectra for the array with a period of 4.2 μm.
Figure 6
Figure 6
Intensity maps of the Raman signal at the wavenumber 1694 cm–1 (LP), 1732 cm–1 (PMMA C=O), and 1770 cm–1 (UP) in the unit cell of the array. The measurements are performed on the array with a 4 μm period. The imaging is performed at heights of 50 nm (a), 500 nm (e), and 850 nm (i). (b) Shows the maps measured at the energy of the lower polariton and a height of 50 nm. (c) Shows the maps measured at the energy of the PMMA carbonyl peak and a height of 50 nm. (d) Shows the maps measured at the energy of the upper polariton and a height of 50 nm. (f–h) show the upper, the C=O bond, and the lower polariton (respectively) energy maps measured at 500 nm. (j–l) show the upper, the C=O bond, and the lower polariton (respectively) energy maps measured at 850 nm.

References

    1. Houdré R. Early stages of continuous wave experiments on cavity-polaritons. Phys. Status Solidi B 2005, 242, 2167–2196. 10.1002/pssb.200560966. - DOI
    1. Ebbesen T. W. Hybrid light–matter states in a molecular and material science perspective. Acc. Chem. Res. 2016, 49, 2403–2412. 10.1021/acs.accounts.6b00295. - DOI - PubMed
    1. Törmä P.; Barnes W. L. Strong coupling between surface plasmon polaritons and emitters: a review. Rep. Prog. Phys. 2014, 78, 013901.10.1088/0034-4885/78/1/013901. - DOI - PubMed
    1. Chen T.; Li S.; Sun H. Metamaterials application in sensing. Sensors 2012, 12, 2742–2765. 10.3390/s120302742. - DOI - PMC - PubMed
    1. Zhou W.; Dridi M.; Suh J. Y.; Kim C. H.; Co D. T.; Wasielewski M. R.; Schatz G. C.; Odom T. W. Lasing action in strongly coupled plasmonic nanocavity arrays. Nat. Nanotechnol. 2013, 8, 506–511. 10.1038/nnano.2013.99. - DOI - PubMed

LinkOut - more resources