

Distinct Urinary Metabolic Biomarkers of Human Colorectal Cancer
- PMID: 35521635
- PMCID: PMC9064491
- DOI: 10.1155/2022/1758113
Distinct Urinary Metabolic Biomarkers of Human Colorectal Cancer
Retraction in
-
Retracted: Distinct Urinary Metabolic Biomarkers of Human Colorectal Cancer.Dis Markers. 2023 Jul 12;2023:9873530. doi: 10.1155/2023/9873530. eCollection 2023. Dis Markers. 2023. PMID: 37476641 Free PMC article.
Abstract
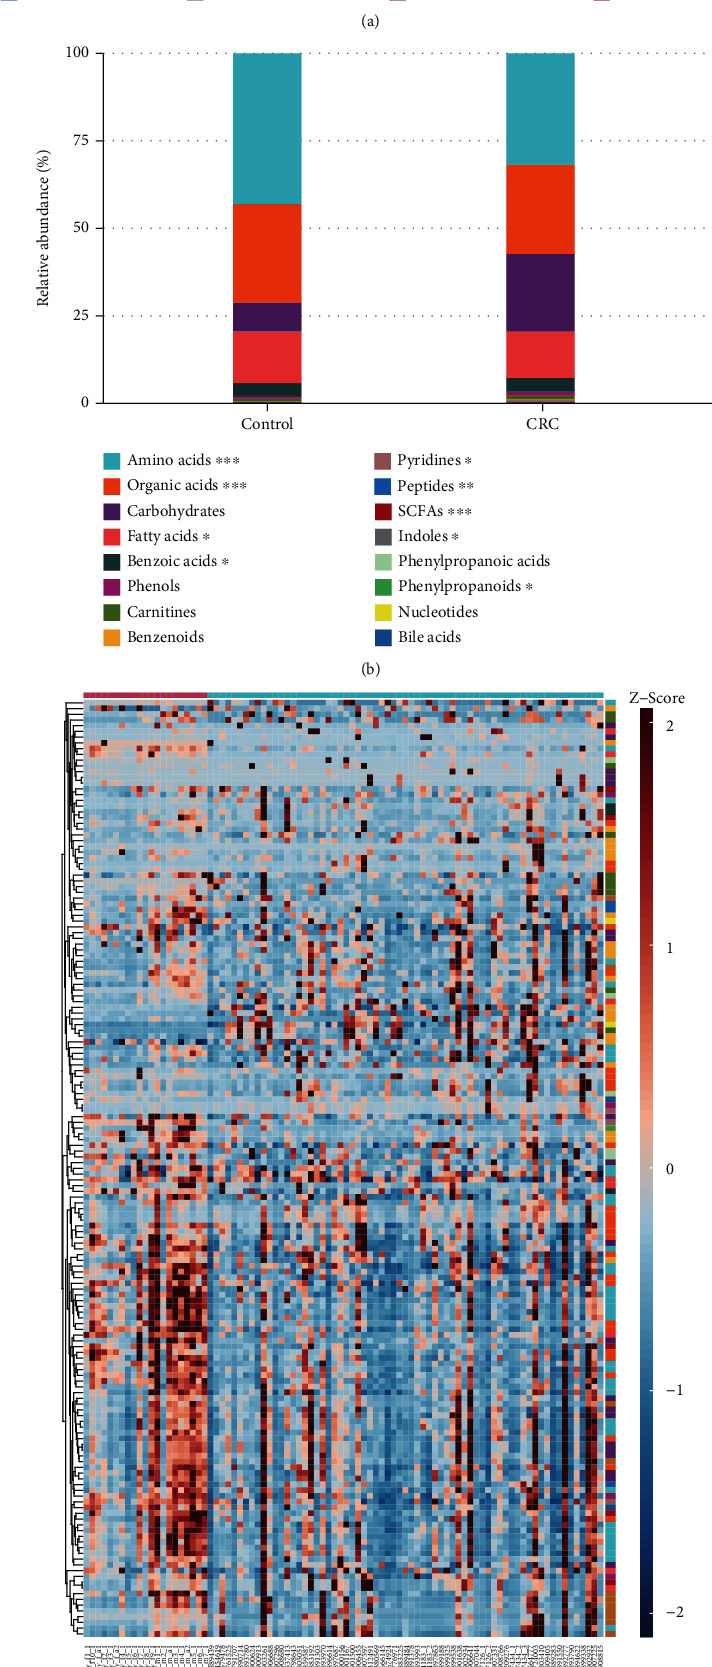
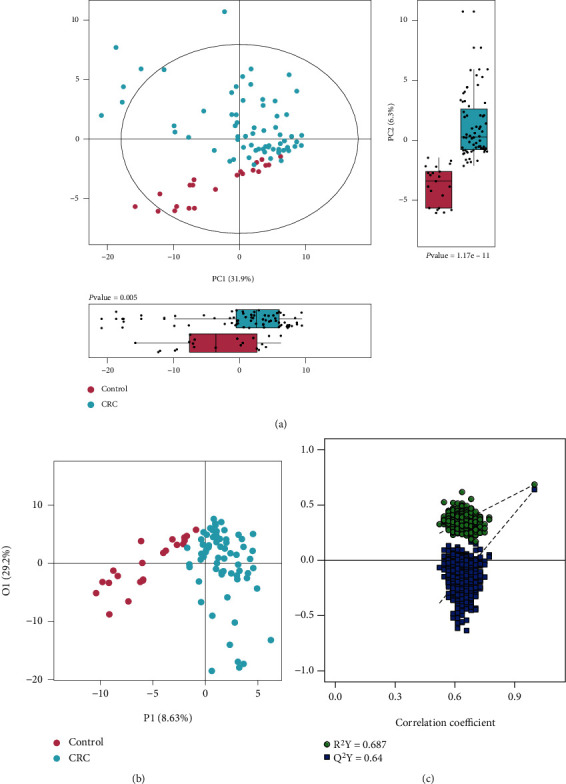
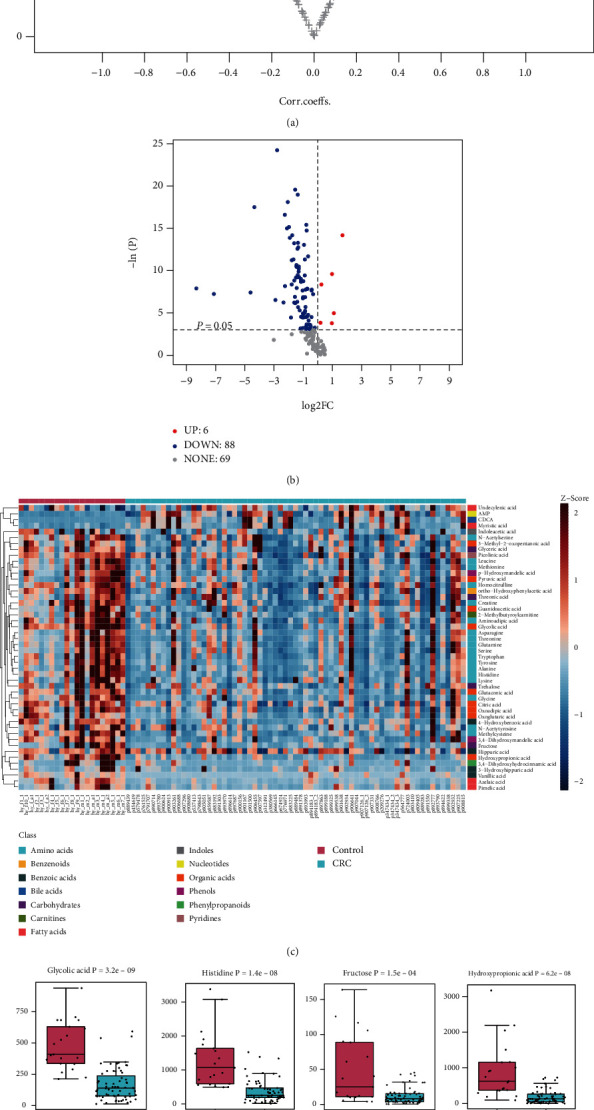
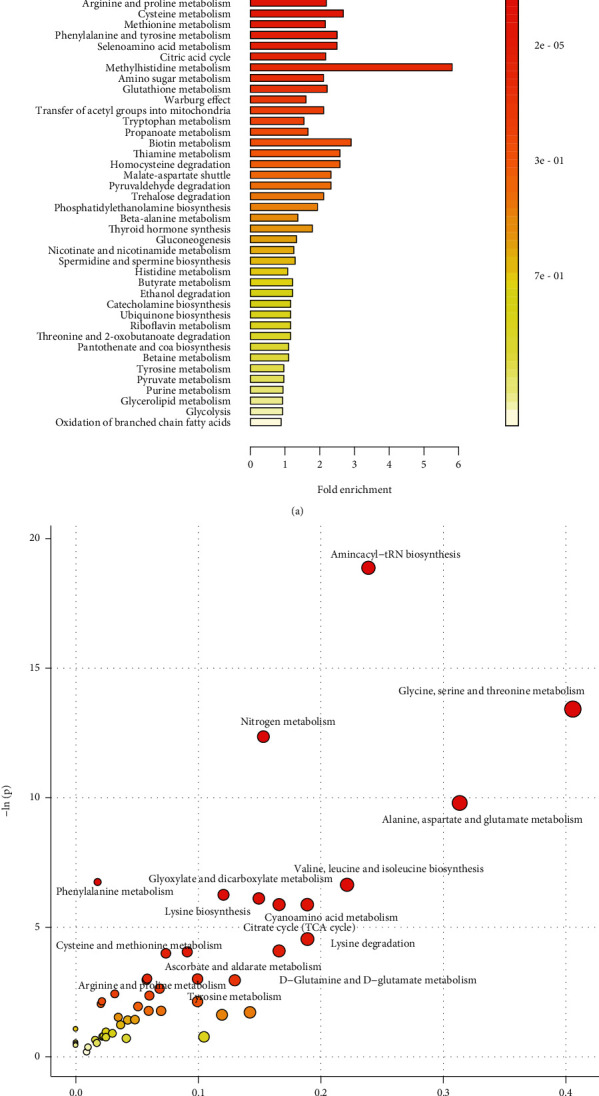
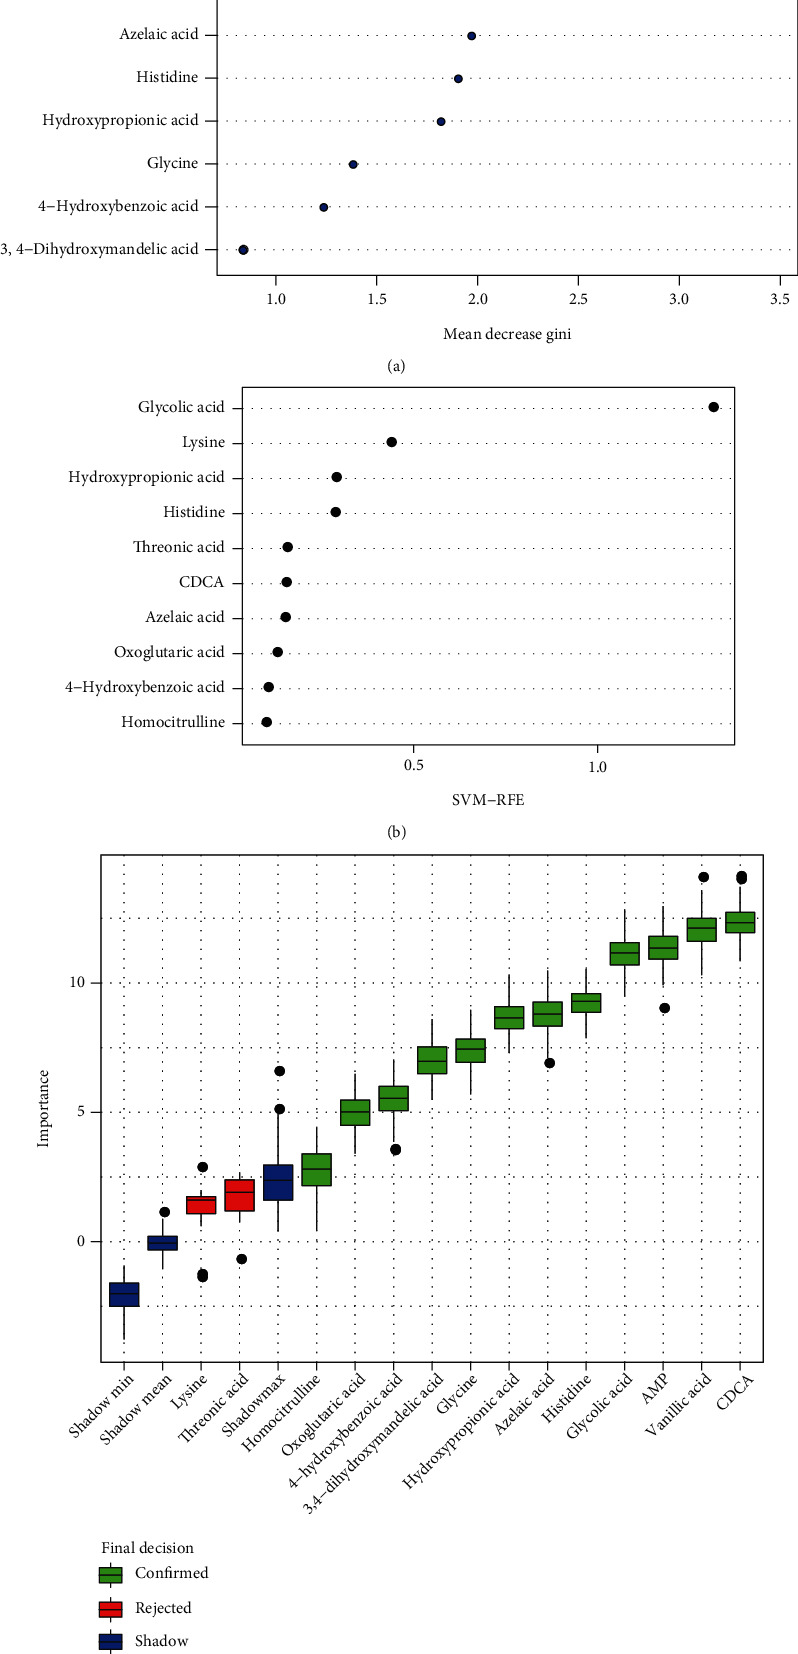
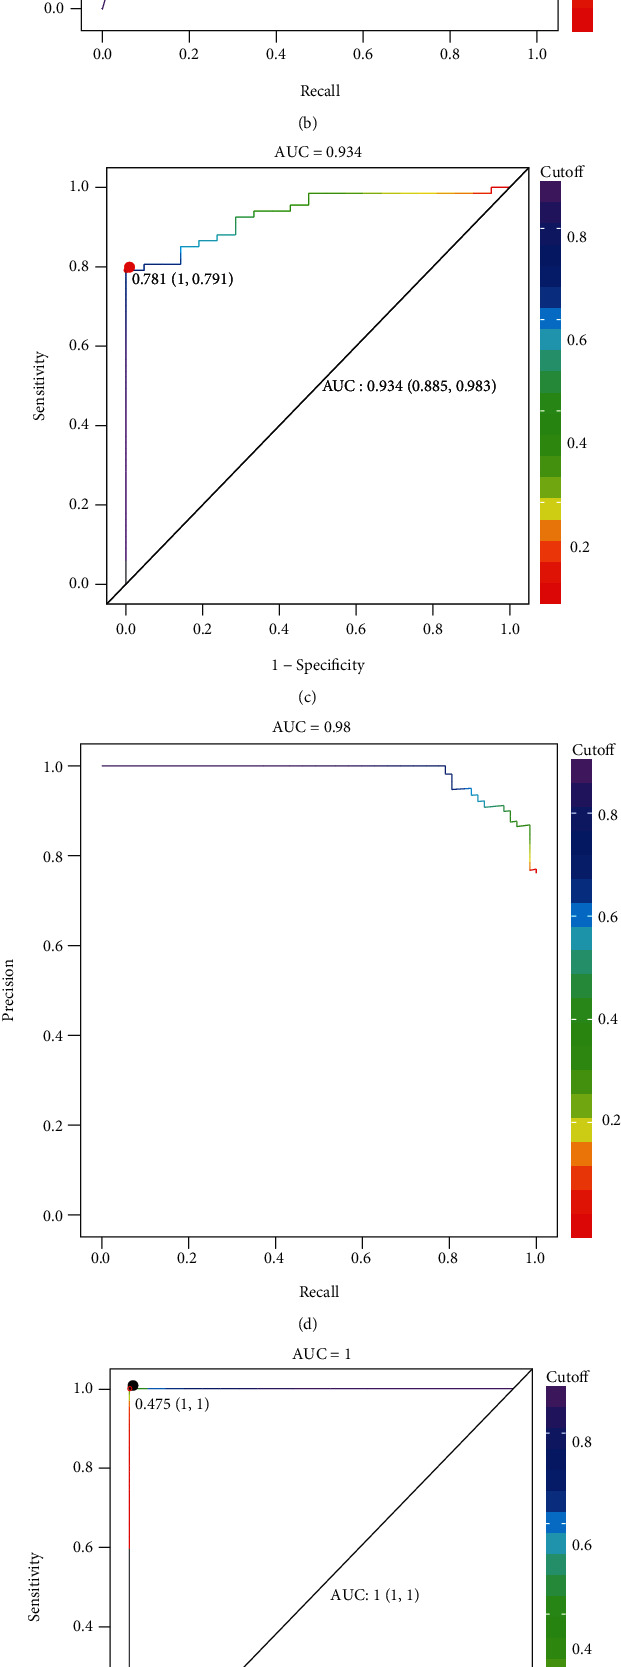
Colorectal cancer (CRC) is one of the most commonly diagnosed cancers with high mortality rate due to its poor diagnosis in the early stage. Here, we report a urinary metabolomic study on a cohort of CRC patients (n =67) and healthy controls (n =21) using ultraperformance liquid chromatography triple quadrupole mass spectrometry. Pathway analysis showed that a series of pathways that belong to amino acid metabolism, carbohydrate metabolism, and lipid metabolism were dysregulated, for instance the glycine, serine and threonine metabolism, alanine, aspartate and glutamate metabolism, glyoxylate and dicarboxylate metabolism, glycolysis, and TCA cycle. A total of 48 differential metabolites were identified in CRC compared to controls. A panel of 12 biomarkers composed of chenodeoxycholic acid, vanillic acid, adenosine monophosphate, glycolic acid, histidine, azelaic acid, hydroxypropionic acid, glycine, 3,4-dihydroxymandelic acid, 4-hydroxybenzoic acid, oxoglutaric acid, and homocitrulline were identified by Random Forest (RF), Support Vector Machine (SVM), and Boruta analysis classification model and validated by Gradient Boosting (GB), Logistic Regression (LR), and Random Forest diagnostic model, which were able to discriminate CRC subjects from healthy controls. These urinary metabolic biomarkers provided a novel and promising molecular approach for the early diagnosis of CRC.
Copyright © 2022 Chang Zhu et al.
Conflict of interest statement
The authors declare no competing financial interest.
Figures
Similar articles
-
Distinct urinary metabolic profile of human colorectal cancer.J Proteome Res. 2012 Feb 3;11(2):1354-63. doi: 10.1021/pr201001a. Epub 2011 Dec 28. J Proteome Res. 2012. PMID: 22148915
-
[Integrated analysis of serum untargeted metabolomics and targeted bile acid metabolomics for identification of diagnostic biomarkers for colorectal cancer].Nan Fang Yi Ke Da Xue Xue Bao. 2023 Mar 20;43(3):443-453. doi: 10.12122/j.issn.1673-4254.2023.03.15. Nan Fang Yi Ke Da Xue Xue Bao. 2023. PMID: 37087590 Free PMC article. Chinese.
-
Targeted metabolomics reveals novel diagnostic biomarkers for colorectal cancer.Mol Oncol. 2025 Jun;19(6):1737-1750. doi: 10.1002/1878-0261.13791. Epub 2025 Jan 3. Mol Oncol. 2025. PMID: 39753208 Free PMC article.
-
Diagnostic performance of serum metabolites biomarker associated with colorectal adenoma: a systematic review.PeerJ. 2024 Sep 20;12:e18043. doi: 10.7717/peerj.18043. eCollection 2024. PeerJ. 2024. PMID: 39314843 Free PMC article.
-
Urine NMR Metabolomics for Precision Oncology in Colorectal Cancer.Int J Mol Sci. 2022 Sep 22;23(19):11171. doi: 10.3390/ijms231911171. Int J Mol Sci. 2022. PMID: 36232473 Free PMC article. Review.
Cited by
-
Small molecule metabolites: discovery of biomarkers and therapeutic targets.Signal Transduct Target Ther. 2023 Mar 20;8(1):132. doi: 10.1038/s41392-023-01399-3. Signal Transduct Target Ther. 2023. PMID: 36941259 Free PMC article. Review.
-
Novel biomarkers used for early diagnosis and tyrosine kinase inhibitors as targeted therapies in colorectal cancer.Front Pharmacol. 2023 Sep 1;14:1189799. doi: 10.3389/fphar.2023.1189799. eCollection 2023. Front Pharmacol. 2023. PMID: 37719843 Free PMC article. Review.
-
Plasma metabolomic differences in early-onset compared to average-onset colorectal cancer.Sci Rep. 2024 Feb 21;14(1):4294. doi: 10.1038/s41598-024-54560-5. Sci Rep. 2024. PMID: 38383634 Free PMC article.
-
Untargeted urinary metabolomics for bladder cancer biomarker screening with ultrahigh-resolution mass spectrometry.Sci Rep. 2023 Jun 16;13(1):9802. doi: 10.1038/s41598-023-36874-y. Sci Rep. 2023. PMID: 37328580 Free PMC article.
-
Retracted: Distinct Urinary Metabolic Biomarkers of Human Colorectal Cancer.Dis Markers. 2023 Jul 12;2023:9873530. doi: 10.1155/2023/9873530. eCollection 2023. Dis Markers. 2023. PMID: 37476641 Free PMC article.
References
Publication types
MeSH terms
Substances
LinkOut - more resources
Full Text Sources
Medical
