. 2022 May 12;187(1):49-64.
doi: 10.1530/EJE-21-1183.

Single-cell RNA sequencing in silent corticotroph tumors confirms impaired POMC processing and provides new insights into their invasive behavior

Affiliations

Single-cell RNA sequencing in silent corticotroph tumors confirms impaired POMC processing and provides new insights into their invasive behavior

Dongyun Zhang et al. Eur J Endocrinol. .

Abstract

Objective: Provide insights into the defective POMC processing and invasive behavior in silent pituitary corticotroph tumors.

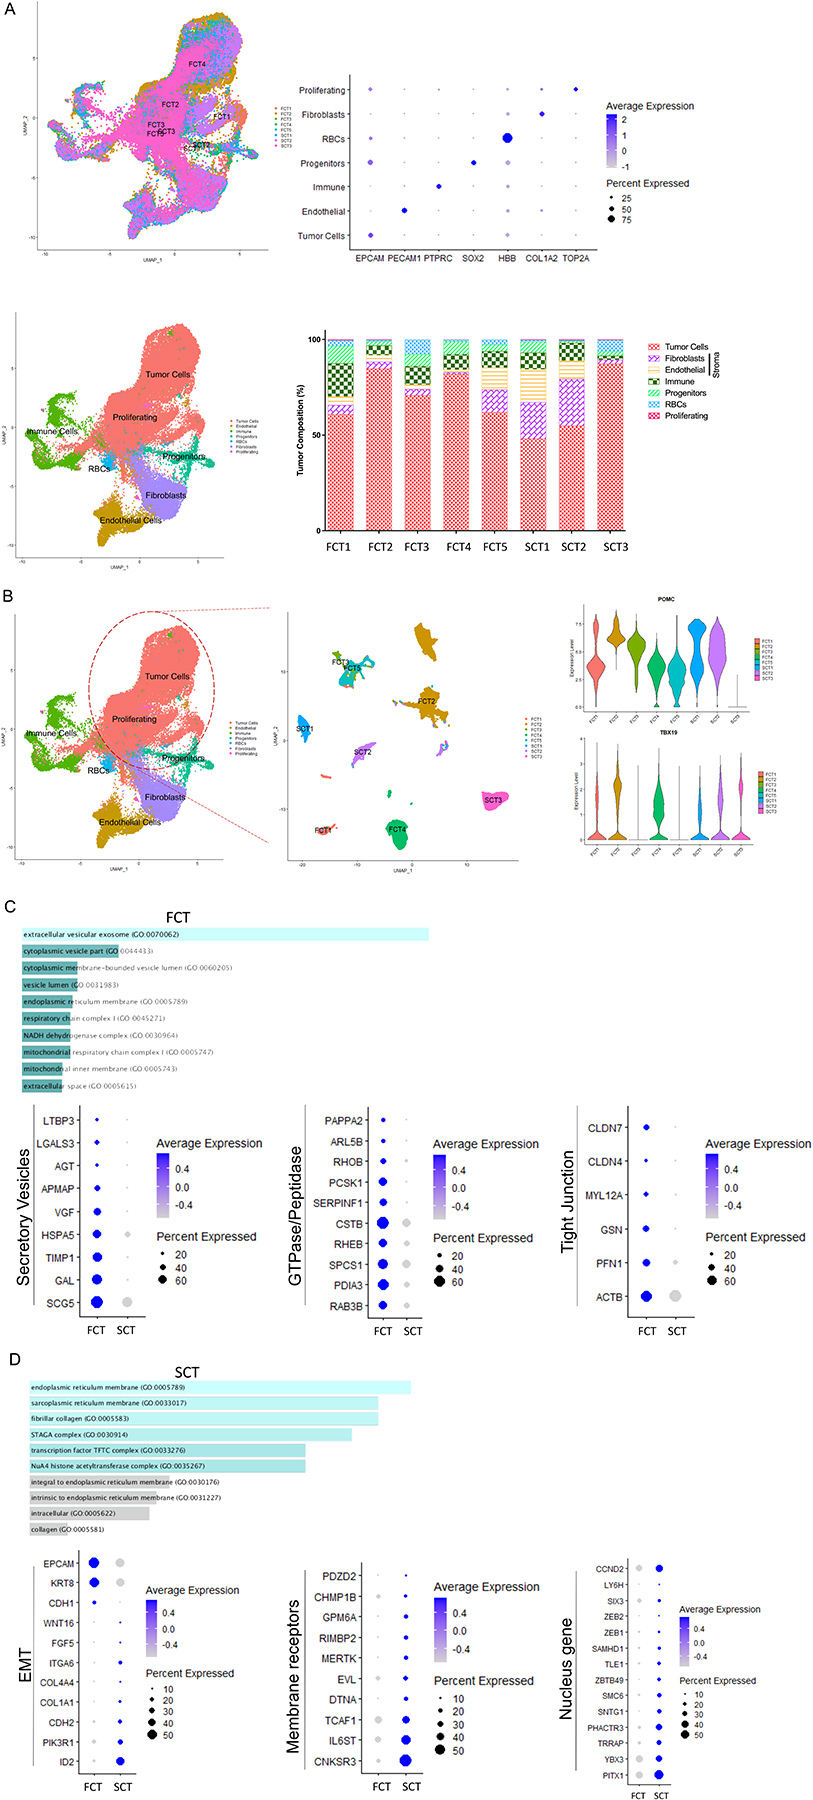
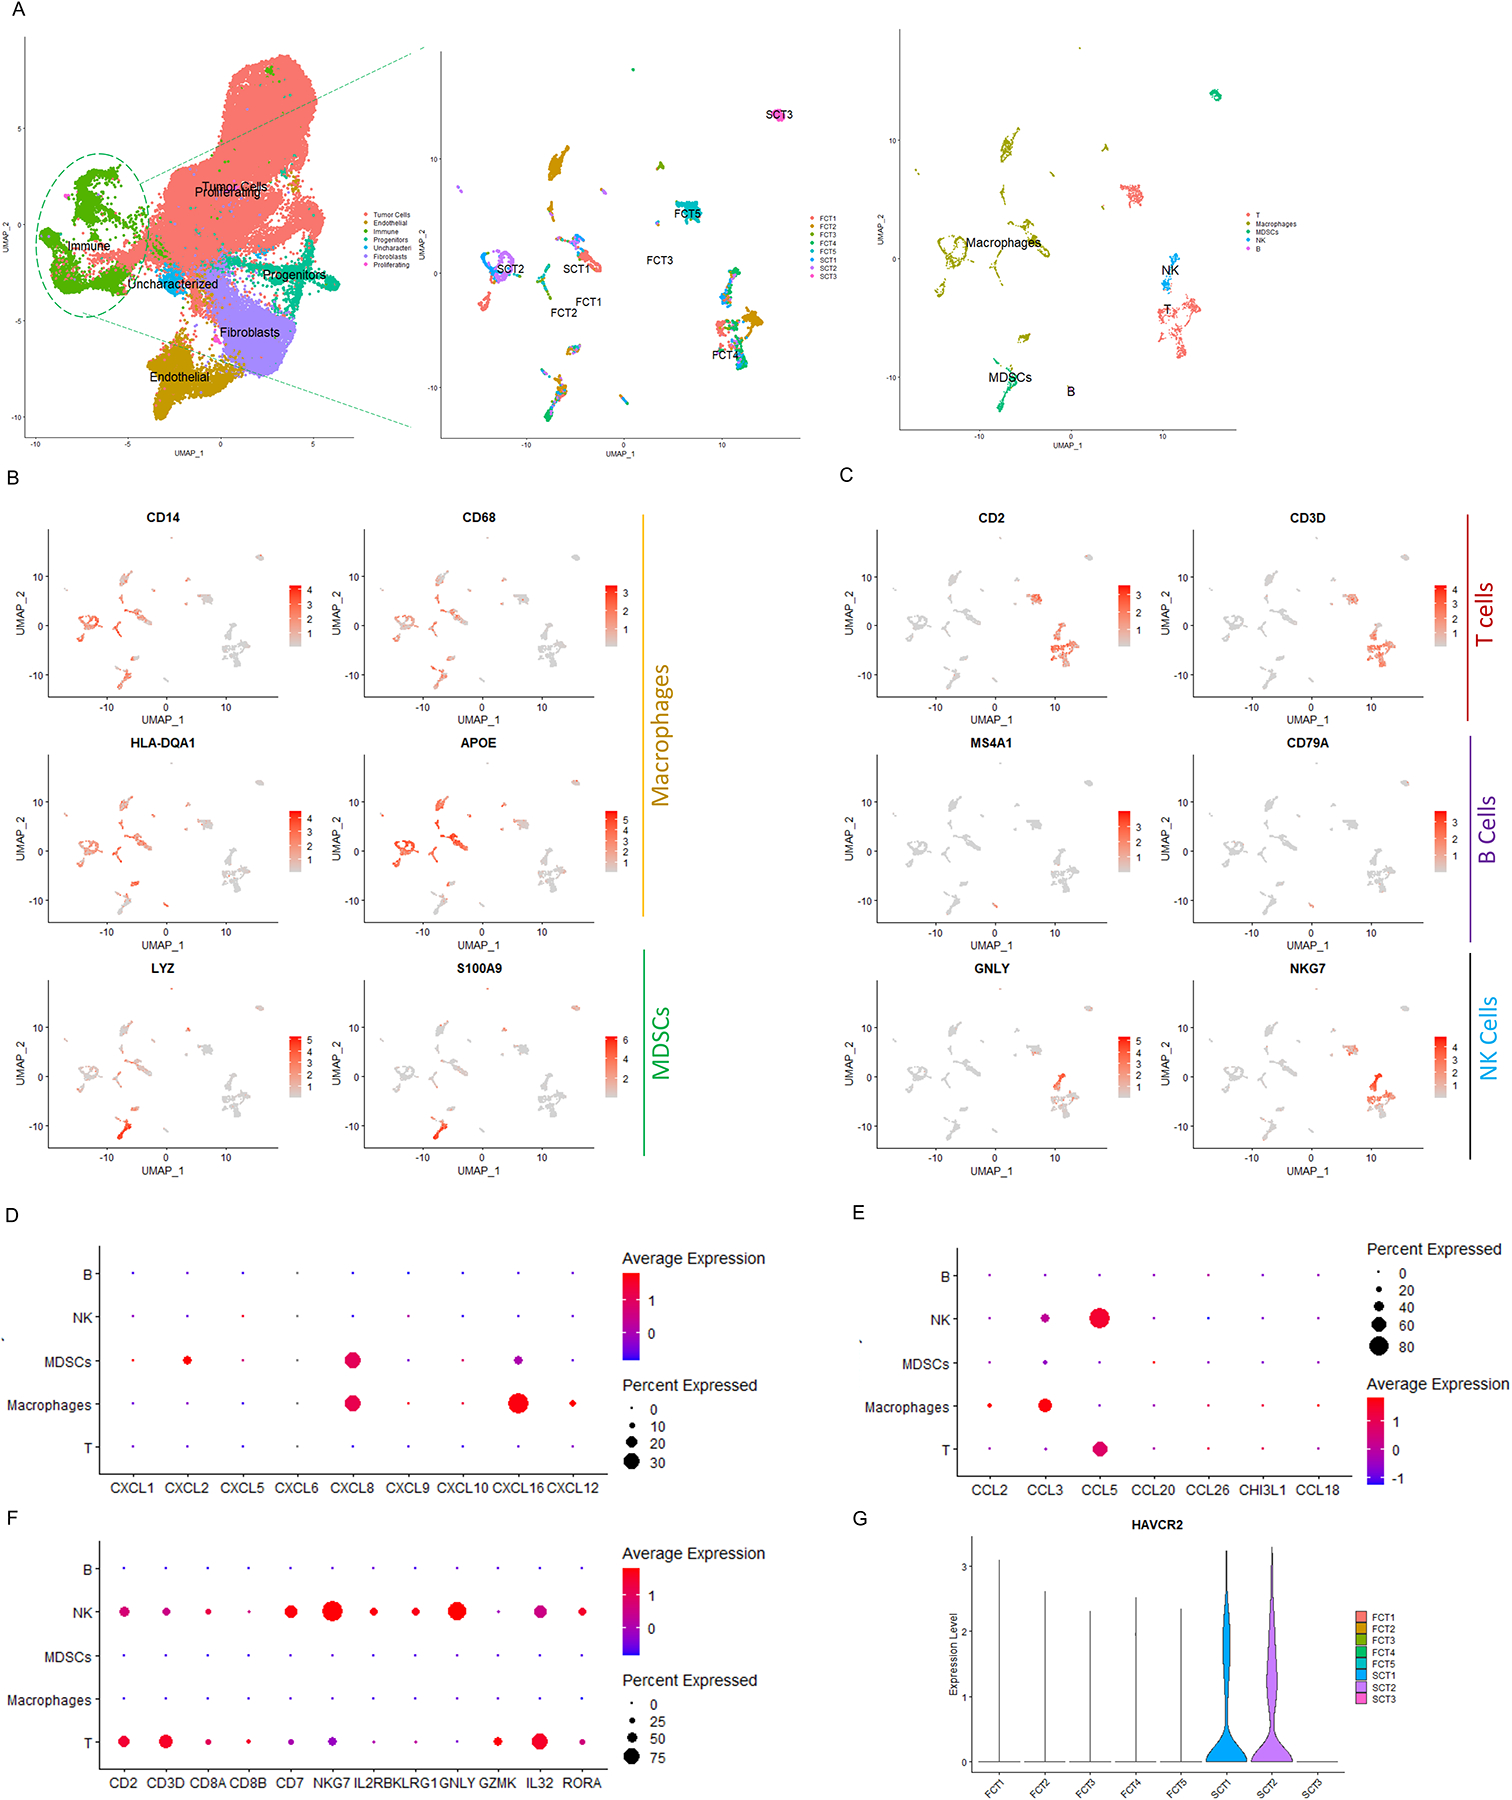
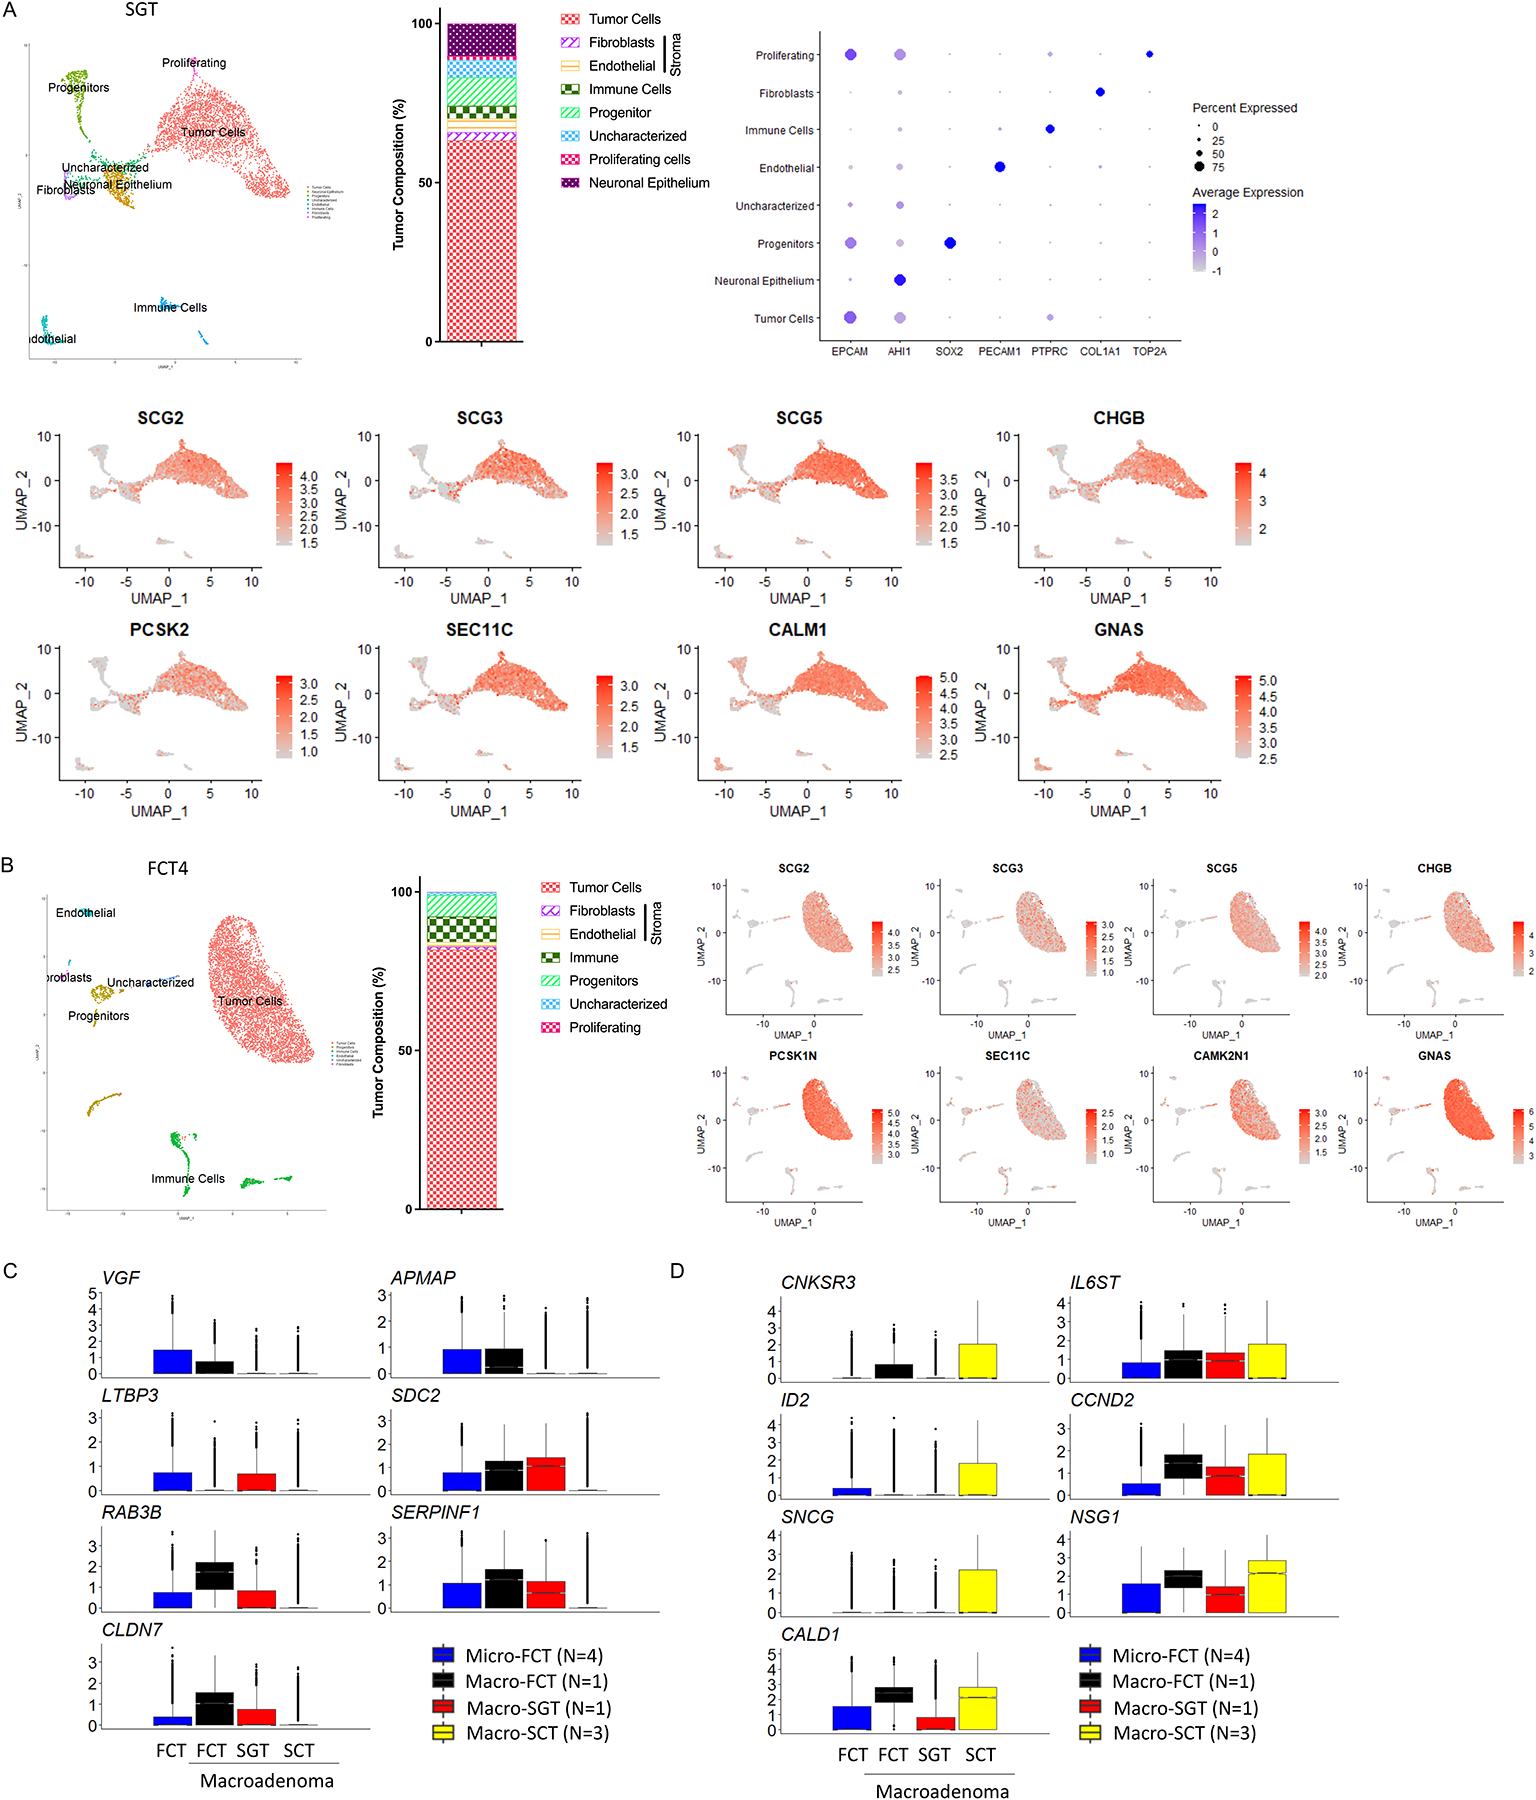
Design and methods: Single-cell RNAseq was used to compare the cellular makeup and transcriptome of silent and active corticotroph tumors.

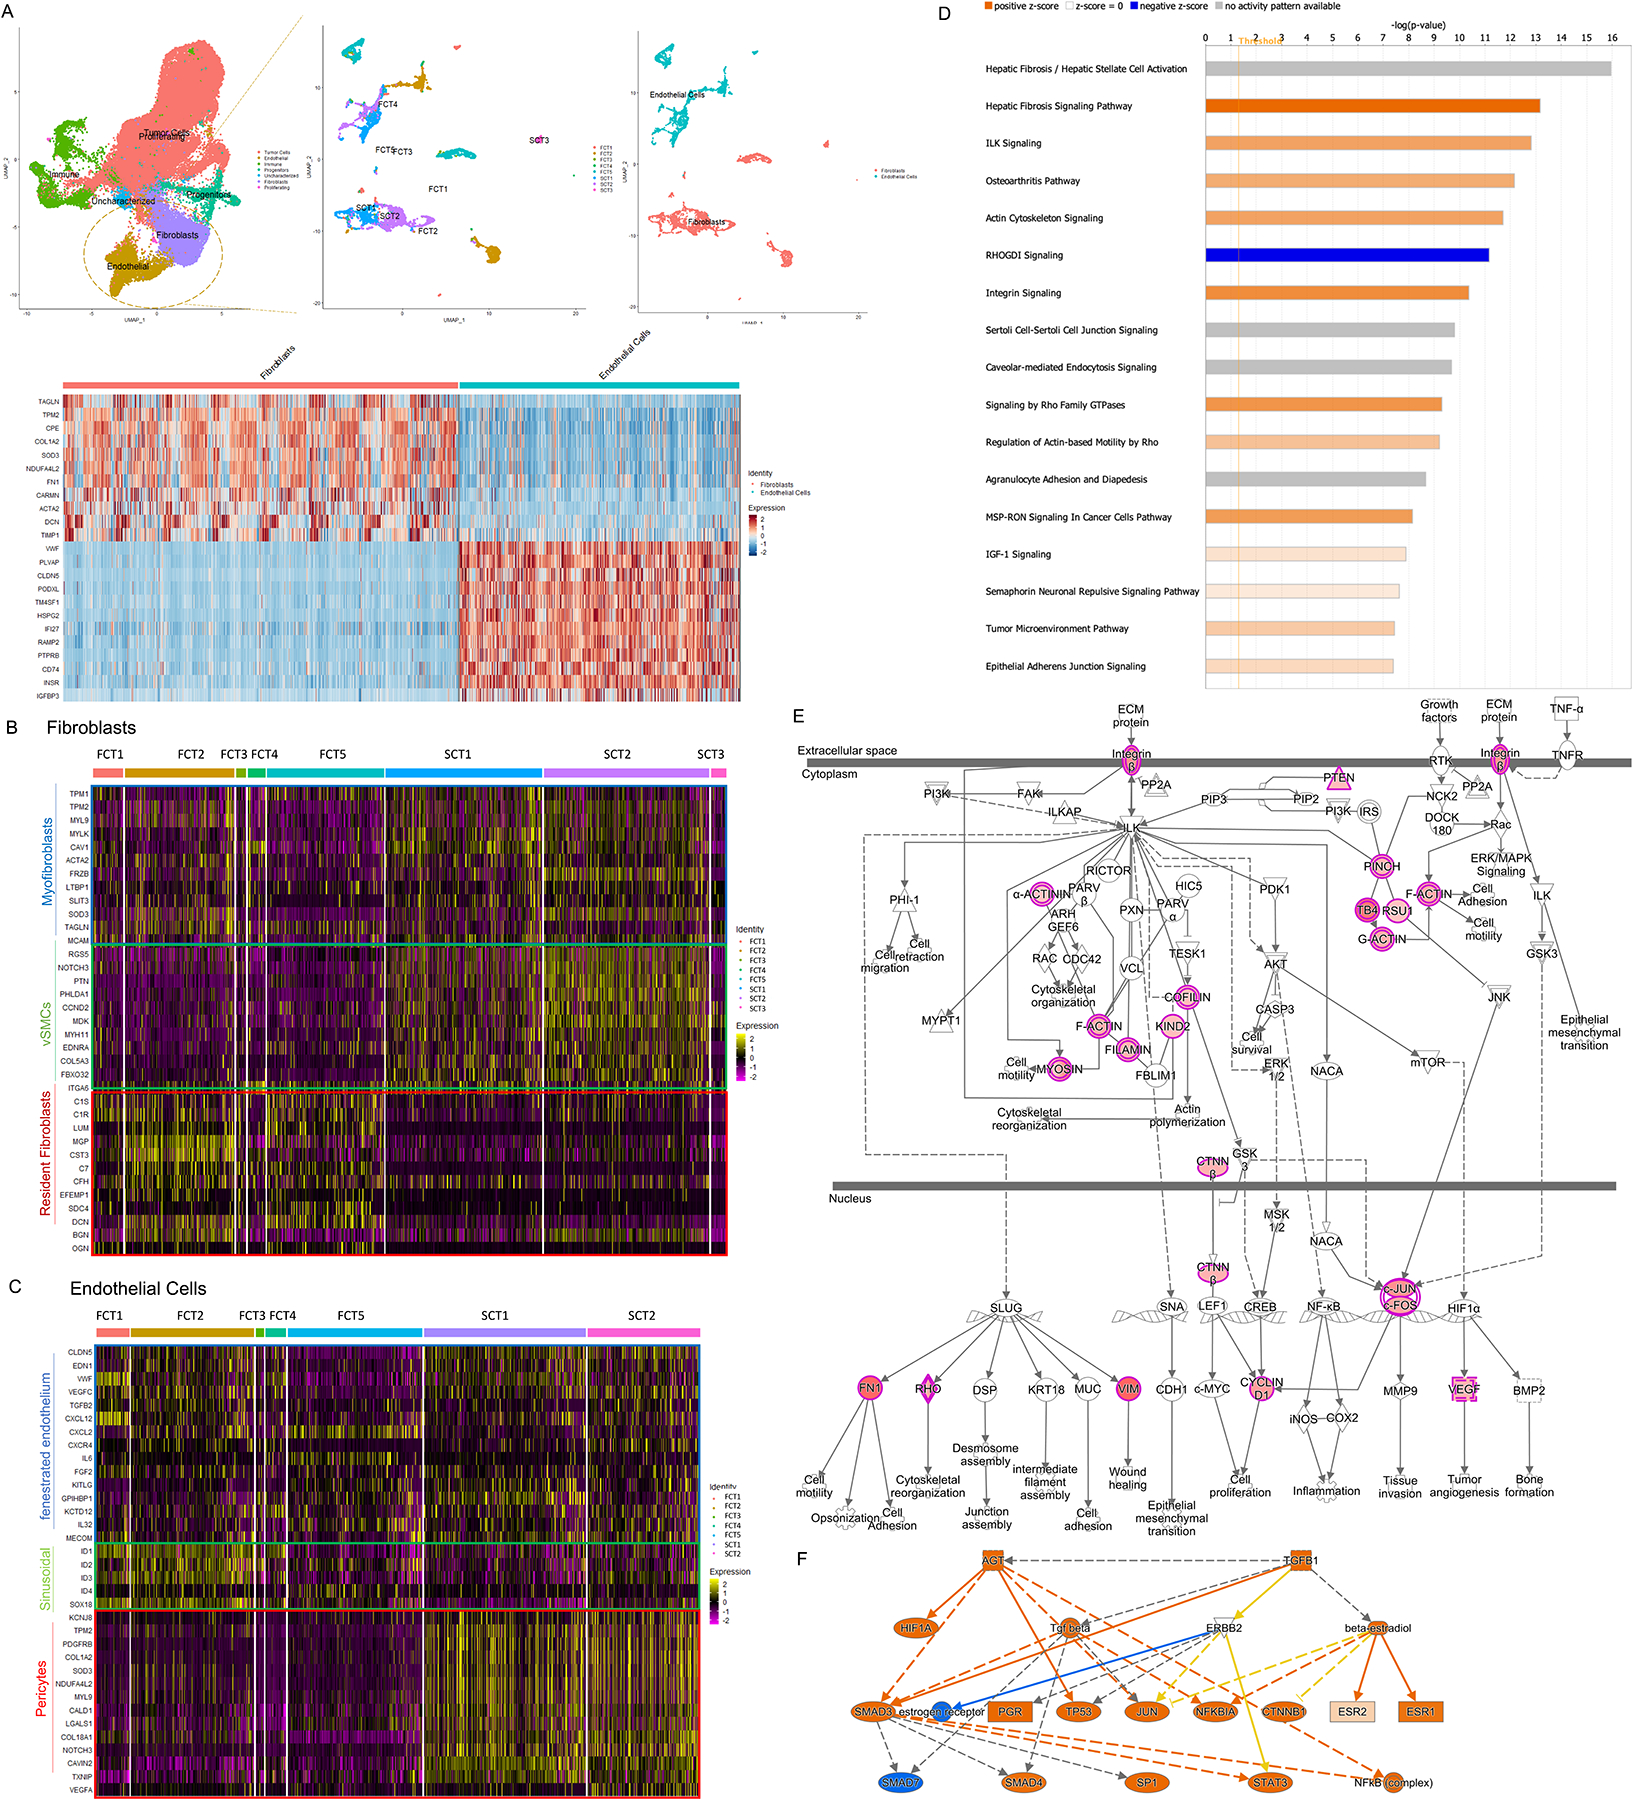
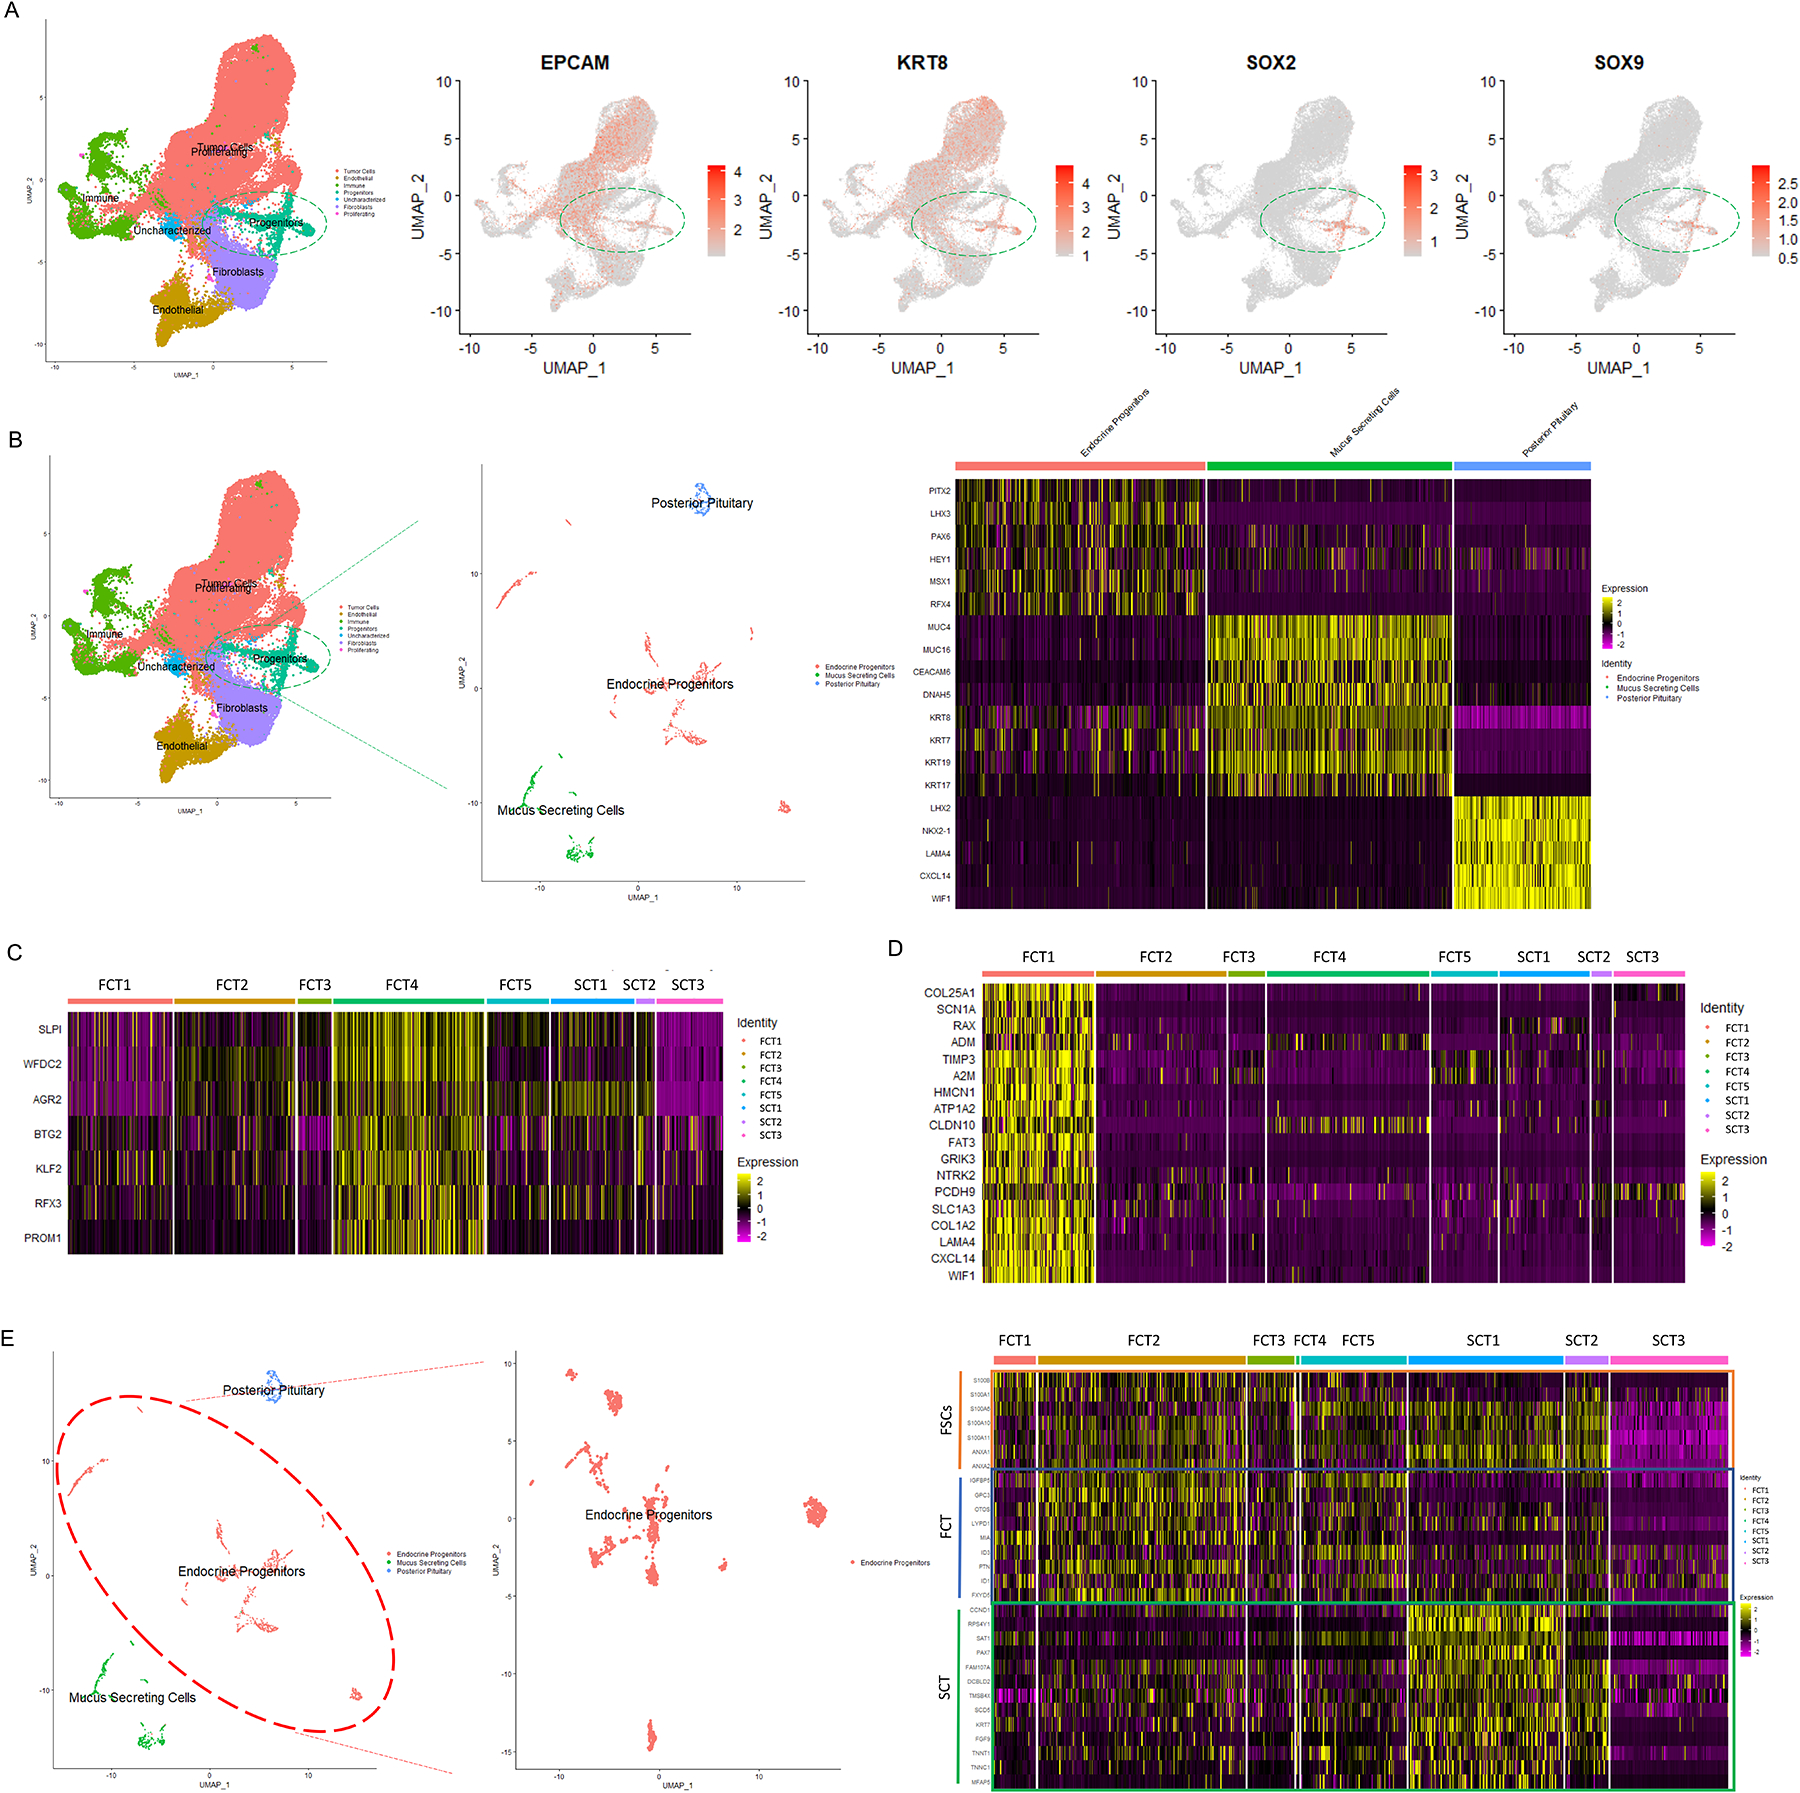
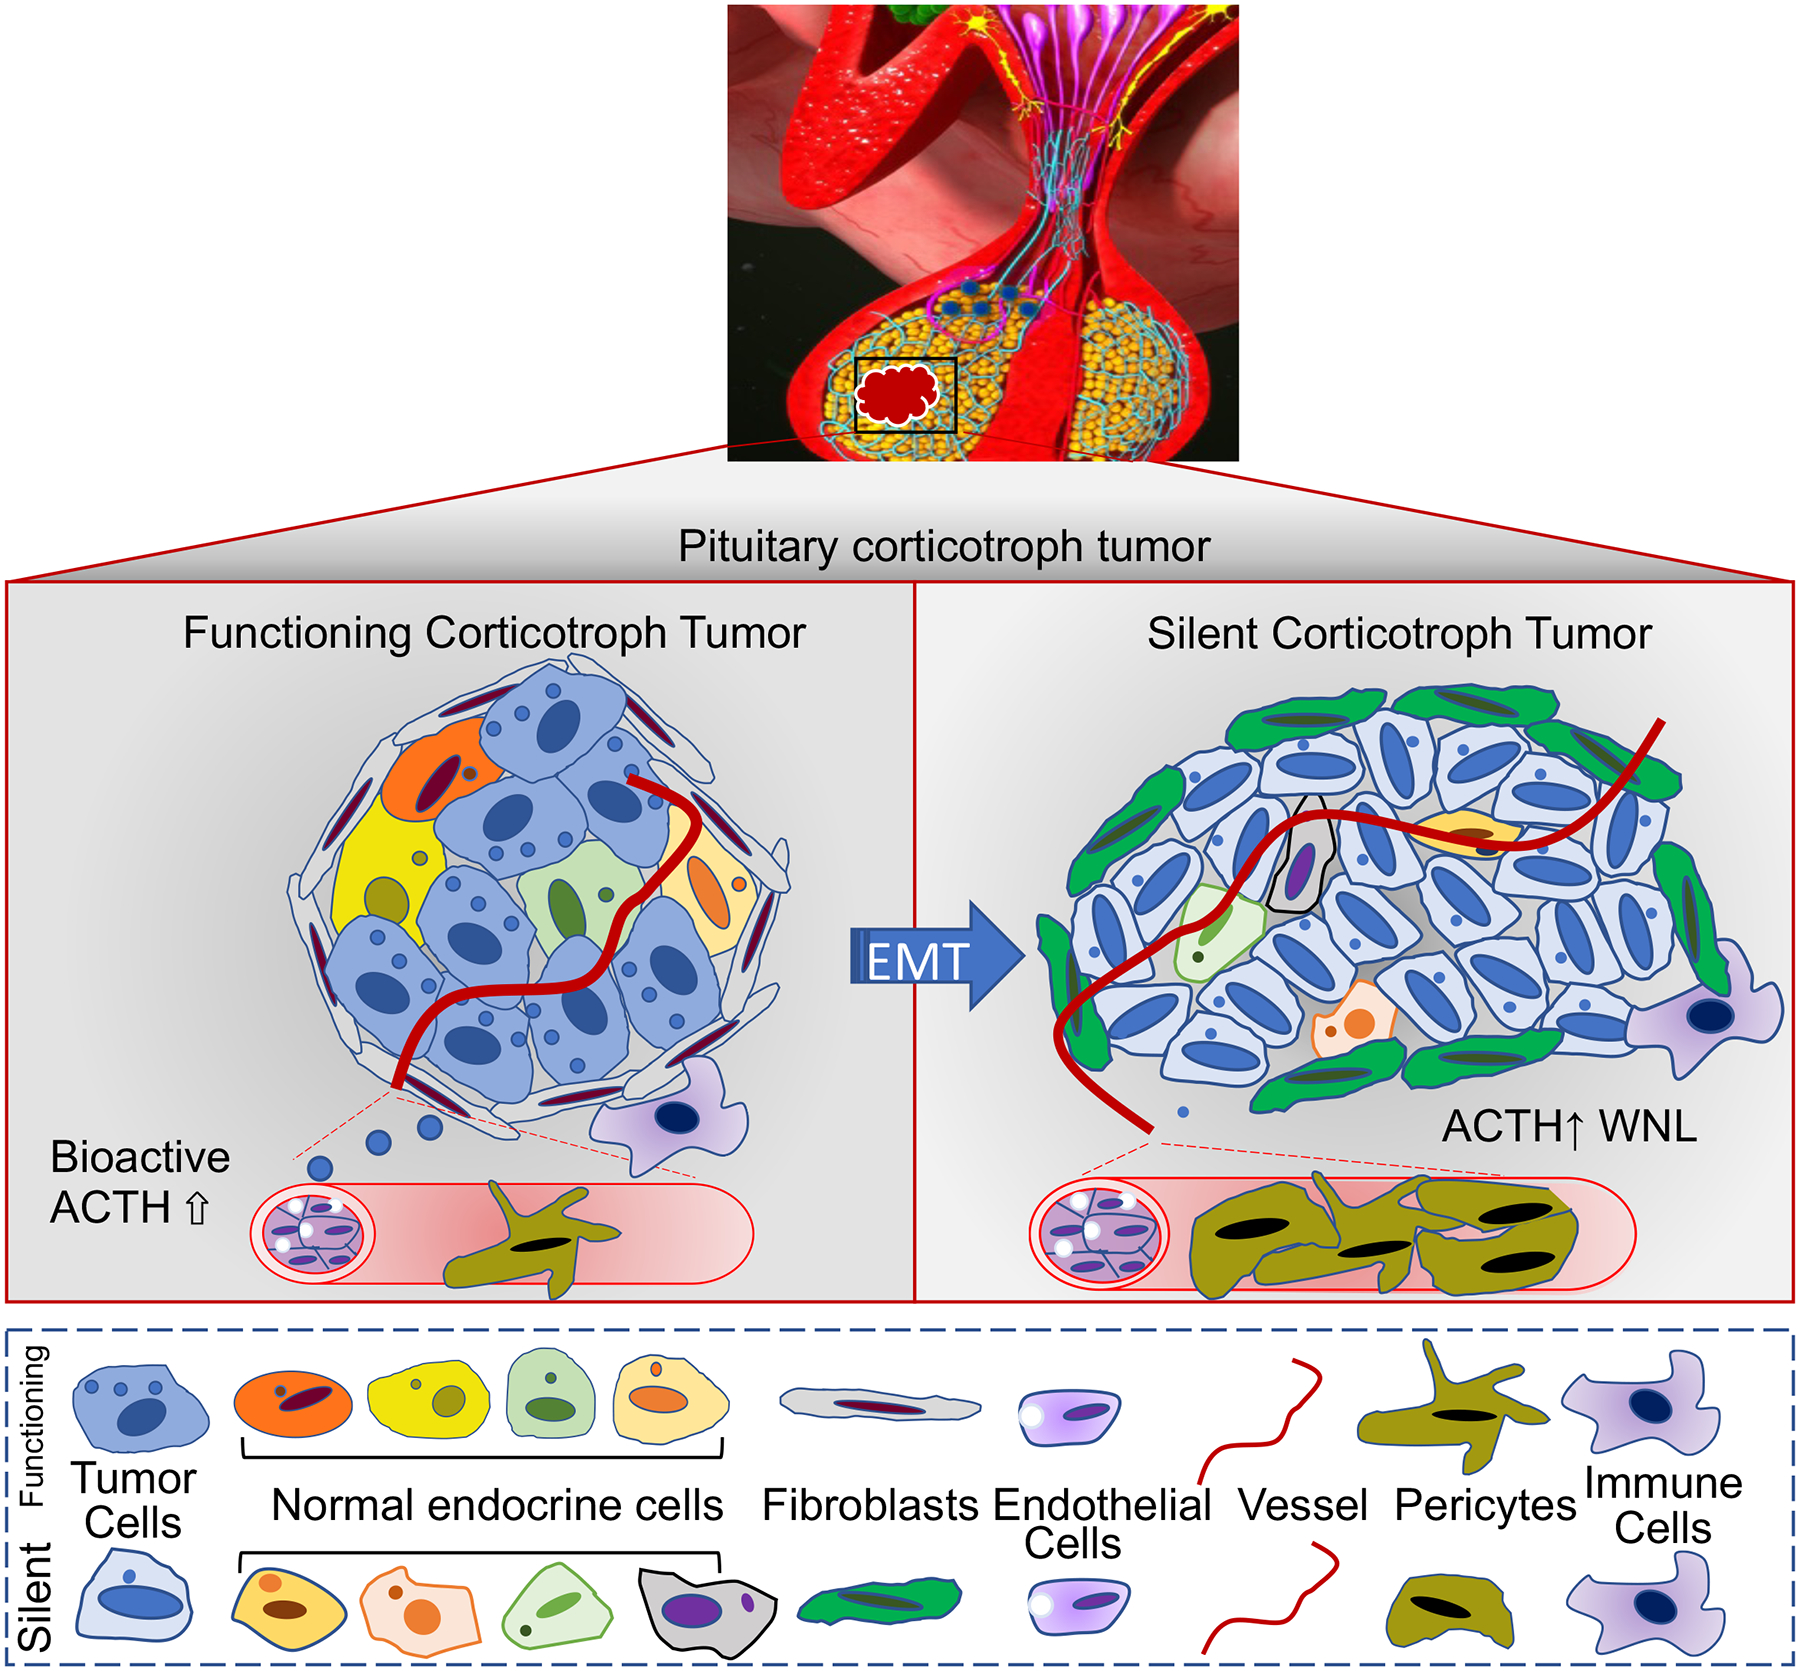
Results: A series of transcripts related to hormone processing peptidases and genes involved in the structural organization of secretory vesicles were reduced in silent compared to active corticotroph tumors. Most relevant to their invasive behavior, silent corticotroph tumors exhibited several features of epithelial-to-mesenchymal transition, with increased expression of mesenchymal genes along with the loss of transcripts that regulate hormonal biogenesis and secretion. Silent corticotroph tumor vascular smooth muscle cell and pericyte stromal cell populations also exhibited plasticity in their mesenchymal features.

Conclusions: Our findings provide novel insights into the mechanisms of impaired POMC processing and invasion in silent corticotroph tumors and suggest that a common transcriptional reprogramming mechanism simultaneously impairs POMC processing and activates tumor invasion.


Conflict of interest statement

Declaration of interest: The authors have no conflict of interest to declare.

Figures

Figure 1.
Figure 1.. Single-cell RNA-sequencing (scRNA-seq) analysis depicting the heterogenous cellular composition of FCTs (n=5) and SCTs (n=3).
(A) Uniform manifold approximation and projection (UMAP) was used to visualize corticotroph tumor cellular composition and revealed 7 cell types. Each cell type was annotated based on specific marker expression as shown in the dot plot. The percentage of cells detected in the individual cell types is depicted in the lower panel. (B) The corticotroph tumor population was then subclustered and noted to group in a tumor-subtype specific manner, with all tumor samples expressing the corticotroph specific transcription factor, TBX19. (C & D) ENRICHR was then used to analyze GO cellular components of tumor population, and observed that genes involved in membrane bound vesicle formation and prohormonal processing were highly expressed in FCTs (C). In contrast, SCTs predominantly expressed genes involved in epithelial to mesenchymal transition (EMT, D). p<10−4.
Figure 2.
Figure 2.. Striking intratumor stromal cell heterogeneity between FCTs and SCTs.
(A) The subset function of Seurat was used to analyze the stromal fibroblast and endothelial cell populations. (B & C) Using canonical transcript markers, the fibroblast and endothelial cell populations were further sub-grouped into myofibroblasts, vascular smooth muscle cells (vSMCs) and resident fibroblasts (B); and fenestrated endothelium, sinusoidal endothelium and pericytes respectively (C). (D-F) Examples of activated pathways in the mural cells (D), signal transduction (E) and their upstream regulators (F) observed in SCTs. p<10−4.
Figure 3.
Figure 3.. The transcriptomic features of immune cells in FCTs and SCTs.
(A) Subset function of Seurat was used to analyze the immune cell population. (B) Monocytes, macrophages and monocytic human myeloid-derived suppressor cells (MDSCs) were identified by CD14 and CD86 expression, HLA-DQA1, apolipoprotein E (APOE) expression and S100 calcium binding protein A8 (S100A8), and LYZ expression respectively. (C) T/NK cells, B cells and NK cells were denoted based on expression of CD2 and CD3E; MS4A1 and CD79A; and GNLY and natural killer cell granule protein 7 (NKG7) expression respectively. (D-F) Depiction using dot plots of various inflammatory cytokines that were present in the various immune cells from the corticotroph tumors. (G) Depiction by violin plot of HAVCR2 expression in the immune cell population of 2 of 3 SCTs. p<10−4.
Figure 4.
Figure 4.. Different transcriptomic features of progenitor cells in FCTs and SCTs.
(A-B) Analysis of the progenitor cell population revealed 3 sub-groups, namely endocrine progenitors, mucin producing cells, and posterior pituitary cells. (C-D) The mucin producing and posterior pituitary cells were restricted to two of the FCT samples (FCT4 & FCT1), suggesting these populations may have been due to sample contamination from resected tumor-adjacent normal tissues. (E) Further analysis of endocrine progenitor subpopulation revealed different transcriptional profiles between FCTs and SCTs. p<10−4.
Figure 5.
Figure 5.. The SCT transcriptome is distinct from that of macroadenomas.
(A-B) Individual analysis of a silent gonadotroph macroadenoma (SGT-macro, A), and a FCT-macro (FCT4, B) demonstrating the cellular composition, and well-differentiated features of the tumor cells with expression of transcripts associated with secretory function. (C-D) Depiction of the relative similarity in expression of a series of secretory (C) and EMT-associated (D) transcripts in 3 FCT-micros (FCT1-3, blue box), a FCT-macro (FCT4, black box), and a SGT-macro (red box), and their striking difference to expression levels of these transcripts in SCTs (yellow box).
Figure 6.
Figure 6.. Schematic representation summarizing the major transcriptomic differences in various cell populations between FCTs and SCTs revealed by scRNAseq.
The tumor cells of FCTs (Micro and Macroadenomas) expressed higher levels of genes involved in prohormonal processing, hormone storage and secretion. Fibroblasts in both functioning corticotroph micro- and macro-adenomas exhibited features of residential fibroblasts that participate in ECM organization, ECM receptor interaction and inflammation. In contrast, SCT tumor cells exhibited reduced expression of genes involved in vesicle biogenesis and granule exocytosis, but increased stromal expression of transcripts of vSMCs and increased expression of genes involved in ECM reorganization, cell motility and migration. WNL: Within normal limits.

Similar articles

Cited by

References

    1. Alahmadi H, Lee D, Wilson JR, Hayhurst C, Mete O, Gentili F, Asa SL, Zadeh G. Clinical features of silent corticotroph adenomas. Acta neurochirurgica. 2012;154(8):1493–8. - PubMed
    1. Saeger W, Lüdecke DK, Buchfelder M, Fahlbusch R, Quabbe HJ, Petersenn S. Pathohistological classification of pituitary tumors: 10 years of experience with the German Pituitary Tumor Registry. European journal of endocrinology. 2007;156(2):203–16. - PubMed
    1. Drummond J, Roncaroli F, Grossman AB, Korbonits M. Clinical and Pathological Aspects of Silent Pituitary Adenomas. The Journal of Clinical Endocrinology & Metabolism. 2018;104(7):2473–89. - PMC - PubMed
    1. Raverot G, Wierinckx A, Jouanneau E, Auger C, Borson-Chazot F, Lachuer J, Pugeat M, Trouillas J. Clinical, hormonal and molecular characterization of pituitary ACTH adenomas without (silent corticotroph adenomas) and with Cushing’s disease. European journal of endocrinology. 2010;163(1):35–43. - PubMed
    1. Flores L, Sleightholm R, Neilsen B, Baine M, Drincic A, Thorell W, Shonka N, Oupicky D, Zhang C. Highly Aggressive and Radiation-Resistant, “Atypical” and Silent Pituitary Corticotrophic Carcinoma: A Case Report and Review of the Literature. Case Reports in Oncology. 2019;12(1):139–46. - PMC - PubMed

MeSH terms

Substances