. 2022 May 20;81(6):414-433.
doi: 10.1093/jnen/nlac028.

Azetidine-2-Carboxylic Acid-Induced Oligodendrogliopathy: Relevance to the Pathogenesis of Multiple Sclerosis

Affiliations

Azetidine-2-Carboxylic Acid-Induced Oligodendrogliopathy: Relevance to the Pathogenesis of Multiple Sclerosis

Raymond A Sobel et al. J Neuropathol Exp Neurol. .

Abstract

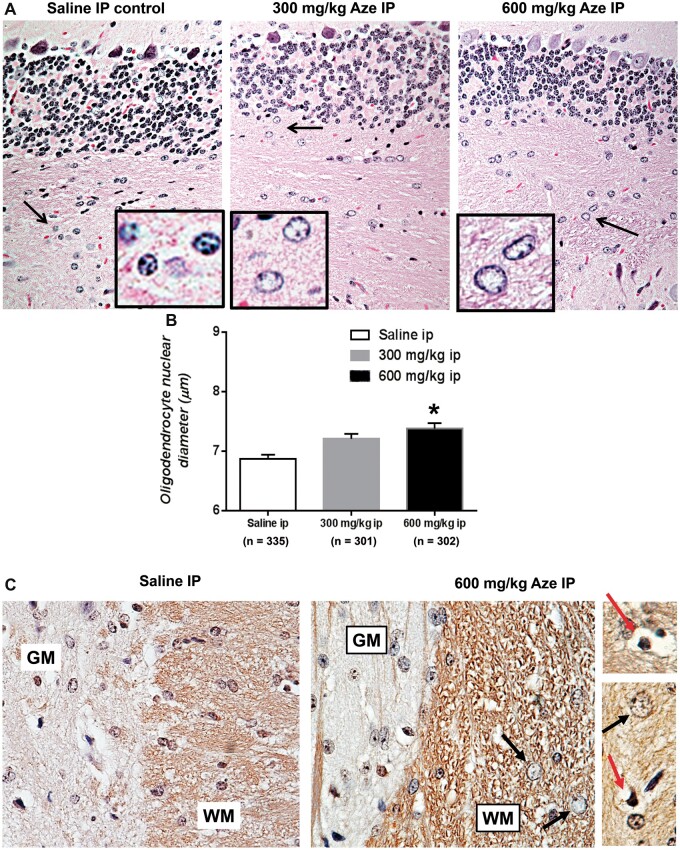
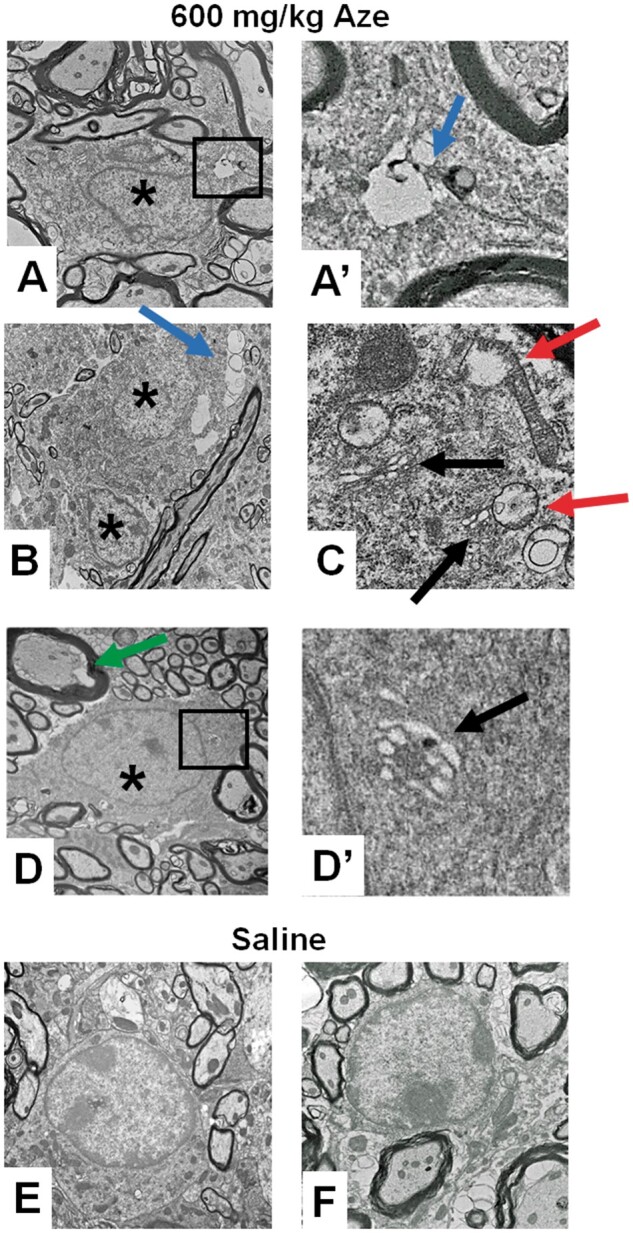
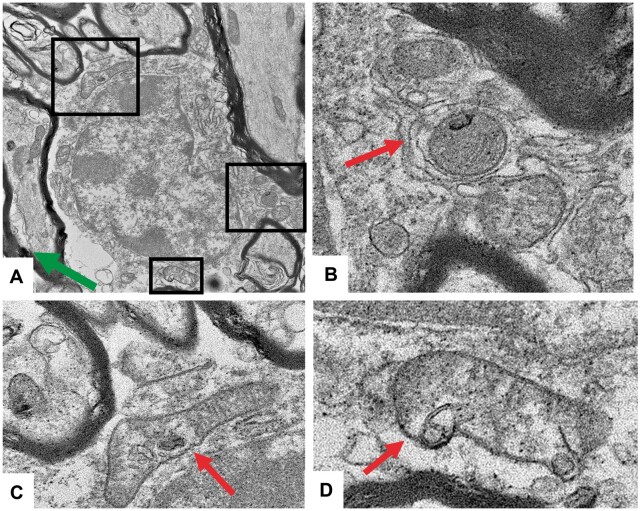
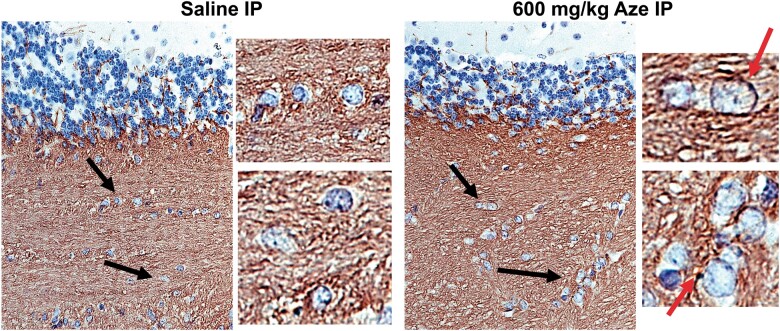
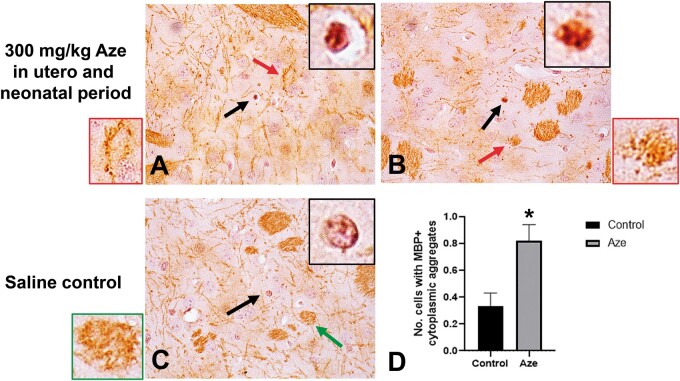
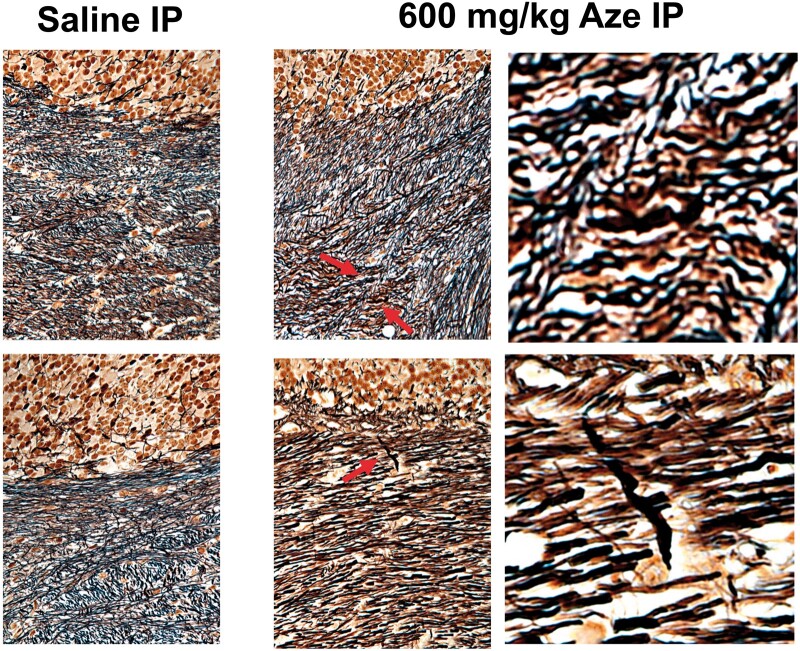
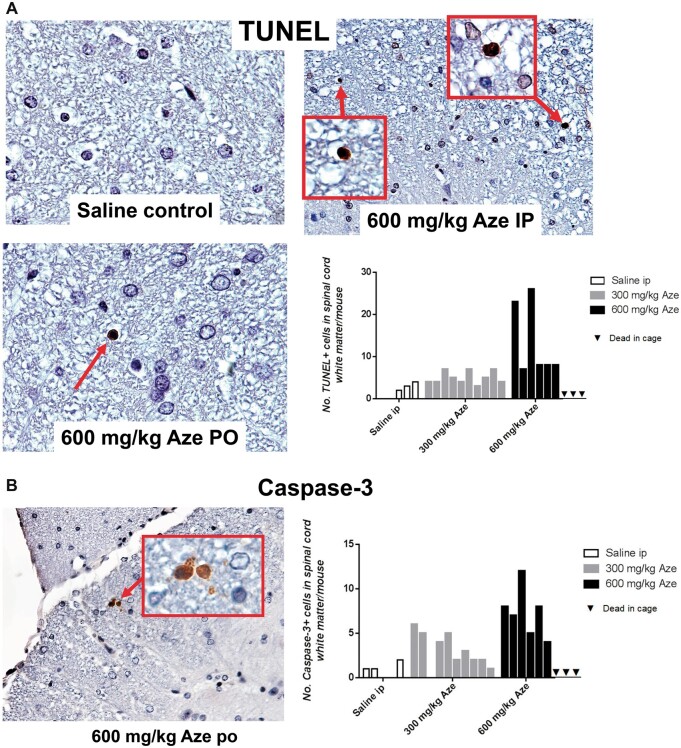
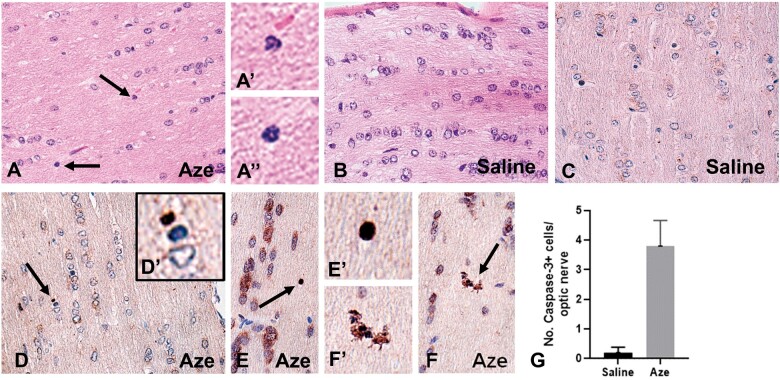
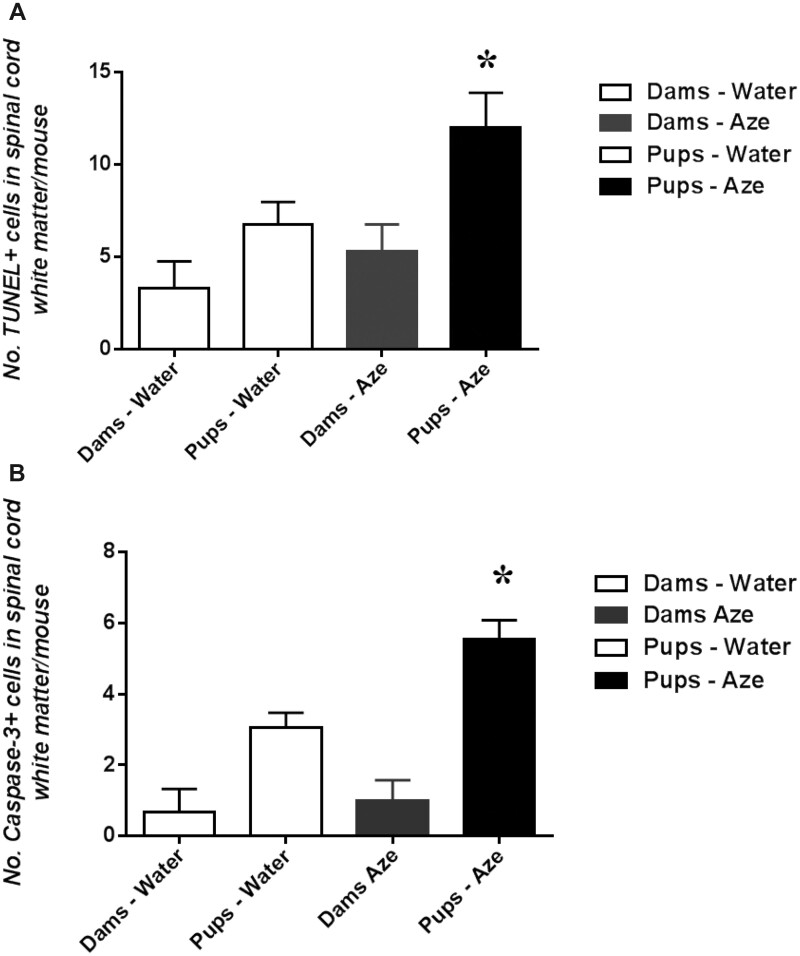
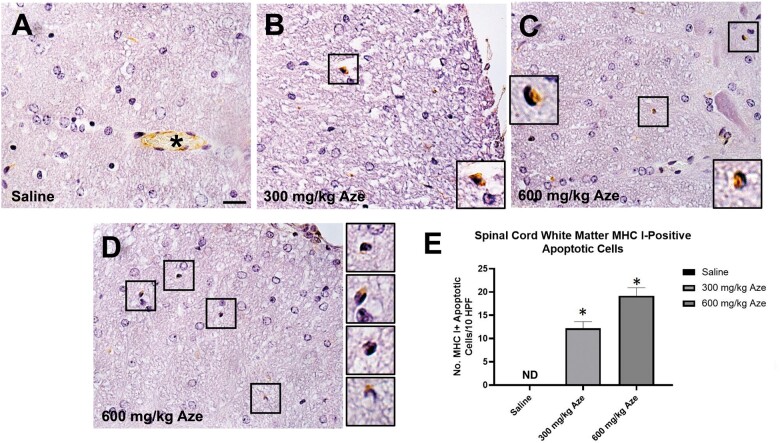
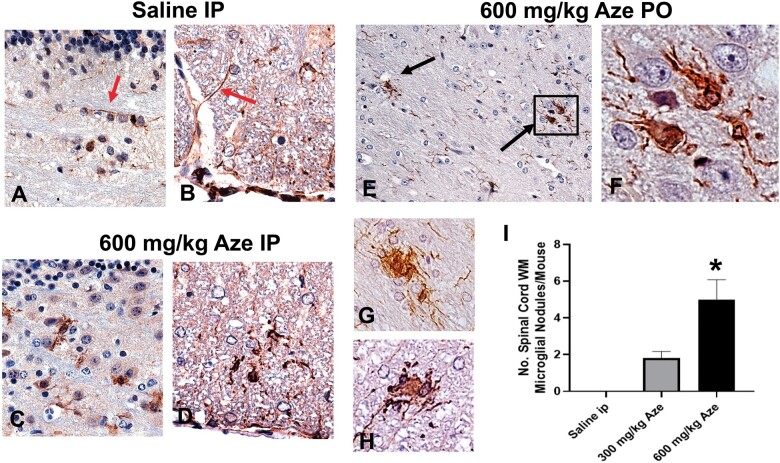
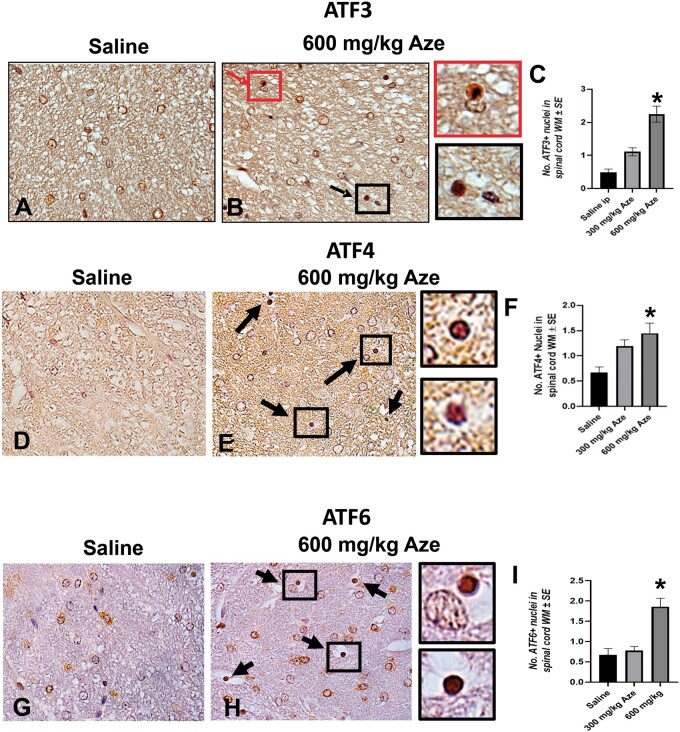
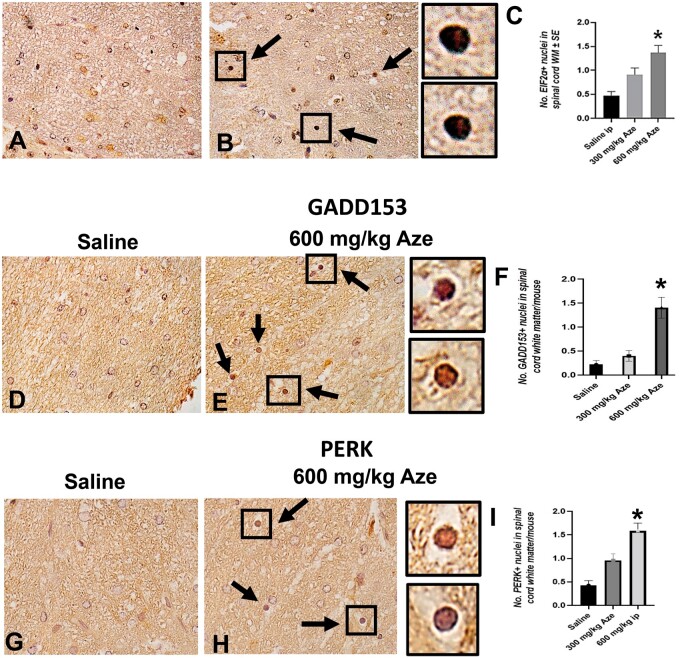
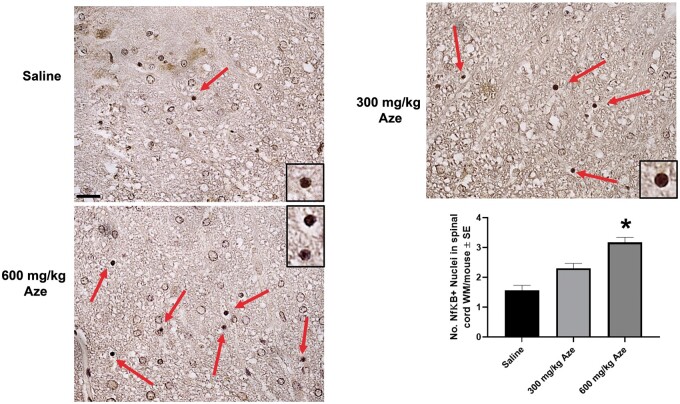
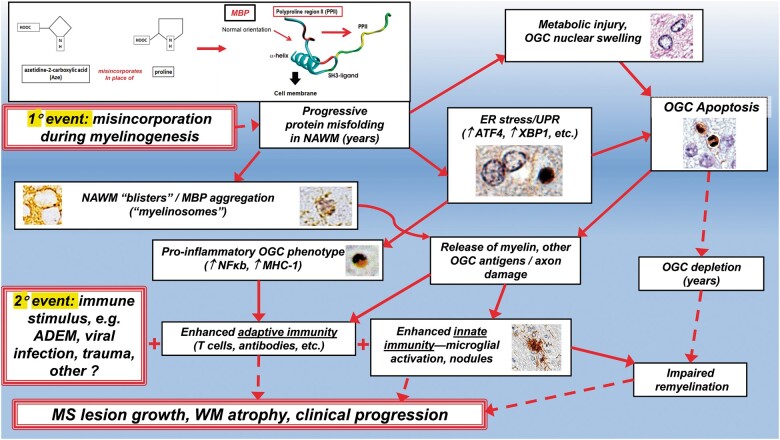
The naturally occurring imino acid azetidine-2-carboxylic acid (Aze) is consumed by humans and can be misincorporated in place of proline in myelin basic protein (MBP) in vitro. To determine Aze effects on the mammalian CNS in vivo, adult CD1 mice were given Aze orally or intraperitoneally. Clinical signs reminiscent of MBP-mutant mice occurred with 600 mg/kg Aze exposure. Aze induced oligodendrocyte (OL) nucleomegaly and nucleoplasm clearing, dilated endoplasmic reticulum, cytoplasmic vacuolation, abnormal mitochondria, and Aze dose-dependent apoptosis. Immunohistochemistry demonstrated myelin blistering and nuclear translocation of unfolded protein response (UPR)/proinflammatory molecules (ATF3, ATF4, ATF6, eIF2α, GADD153, NFκB, PERK, XBP1), MHC I expression, and MBP cytoplasmic aggregation in OL. There were scattered microglial nodules in CNS white matter (WM); other CNS cells appeared unaffected. Mice given Aze in utero and postnatally showed more marked effects than their dams. These OL, myelin, and microglial alterations are found in normal-appearing WM (NAWM) in multiple sclerosis (MS) patients. Thus, Aze induces a distinct oligodendrogliopathy in mice that recapitulates MS NAWM pathology without leukocyte infiltration. Because myelin proteins are relatively stable throughout life, we hypothesize that Aze misincorporation in myelin proteins during myelinogenesis in humans results in a progressive UPR that may be a primary process in MS pathogenesis.

Keywords: Autoimmunity; Azetidine-2-carboxylic acid; Multiple sclerosis; Myelin basic protein; Oligodendrocyte; Proline; Unfolded protein response.


Figures

FIGURE 1.
FIGURE 1.
OL nucleomegaly and apoptosis in white matter of Aze-treated adult mice (Experiment A1). (A) Diffuse enlargement and clearing of nucleoplasm in OL in cerebellar white matter in Aze-treated mice as compared to those in a saline-treated control. Arrows indicate areas shown at higher power in the insets. H&E, original magnification: 240×. (B) OL nuclear diameters in Aze-treated and control mice. Numbers of OL nuclear measurements are indicated. *p<0.001, One-way ANOVA. (C) Immunostains for the OL-specific marker CNPase highlight nuclear swelling (black arrows) and pyknotic (possibly apoptotic), nuclei (red arrows) in the Aze-treated but not the control-treated mouse spinal cord white matter (WM). OL nuclear swelling is not evident in the gray matter (GM). No effects of Aze on GM neurons are evident. Original magnification: 240×.
FIGURE 2.
FIGURE 2.
Ultrastructural analysis of Aze effects on mouse spinal cord OL (Experiment A2). (A–D) OL of Aze-treated mice show watery nuclei (* in A, B, D), clear cytoplasmic vacuoles (blue arrows in A, A′, B), vacuolated mitochondria (red arrows in C), dilated ER (black arrows in C, D′), and enlarged inner tongues of myelin (green arrow). (E, F) Normal OL morphology in saline control mice. Boxed areas in (A) and (D) are shown at higher magnifications in (A′) and (D′), respectively. Original magnifications: A, D, E, 9300×; B, 6800×; F, 13 000×; A′, C, D′, 59 300×.
FIGURE 3.
FIGURE 3.
Mitochondrial abnormalities suggestive of mitophagy in OL of adult mice that received 600 mg/kg Aze (Experiment A2). (A–D) There are membrane-bound vesicles and degenerative profiles within mitochondria; some show abnormal shapes and loss of cristae. They are in close proximity to ER (arrows). Enlarged inner tongues of myelin are also seen in (A) (green arrow). Boxed areas in (A) are shown at higher magnification in (B–D). Original magnification: 13 000×.
FIGURE 4.
FIGURE 4.
Compact myelin in sections of cerebellum from adult mice immunostained for MBP show watery swelling of OL nuclei in the Aze-treated (600 mg/kg) mouse but not the control mouse (Experiment A1). Black arrows indicate fields magnified in panels to the right of the larger fields. There are blister-like areas of immunoreactivity on the periphery of some of the OL in the treated mouse (red arrows). Original magnification: 160×.
FIGURE 5.
FIGURE 5.
Cytoplasmic aggregation of MBP in individual caudoputamen oligodendrocytes in Aze-exposed neonatal mice (Experiment N2). (A, B) Examples of coarse granular immunostaining for MBP in individual OL. Black arrows indicate individual cells magnified in black-bordered insets. Red arrows indicate WM bundles with myelin blistering magnified in red-bordered insets. (C) The OL in a saline control mouse shows normal nuclear staining without MBP aggregation. Green arrow indicates a WM bundle from the saline control magnified in the green-bordered inset. (D) Counts of cells with MBP aggregates in Aze-treated versus saline control mice. *p = 0.0032. Data are from 40 fields of Aze-treated and 30 fields of control mice. (A–C), original magnification: 160×.
FIGURE 6.
FIGURE 6.
Bielschowsky preparations demonstrate rare axonal swellings in cerebellar white matter of Aze-treated (600 mg/kg) but not in saline-treated adult mice (Experiment A1). Upper and lower panels are from 2 different mice from each treatment group. Arrows indicate swollen axons shown in magnified images to the right. Original magnification: 240×.
FIGURE 7.
FIGURE 7.
Aze induces OL apoptosis in spinal cord white matter of adult mice (Experiment A1). Counts of apoptotic cells in the spinal cord white matter of each mouse in the 3 treatment groups are shown in the graphs. (A) TUNEL stains demonstrate individual OL undergoing apoptosis more frequent in the Aze-treated than in a saline control mouse. Areas in boxes are shown at higher power in the insets. (B) Caspase-3 immunostained section of spinal cord of an Aze-treated mouse. The graphs demonstrate that there are more numerous immunopositive cells in the Aze-treated mice versus controls. A, p = 0.0019; B, p = 0.0002, by ordinary ANOVA. Original magnification: 240×.
FIGURE 8.
FIGURE 8.
Effects of in utero and neonatal Aze on mouse pup optic nerves (Experiment N2). (A) Optic nerves of Aze-treated mouse pups showed scattered individual cells apparently undergoing apoptosis (arrows). Higher magnification of these cells is shown in (A′) and (A″). (B) No apoptotic cells were identified in the saline-treated controls. (C–F) Caspase-3 immunostained sections demonstrate multiple immunopositive cells and apoptosomes (arrows) in the Aze-treated (D–F) but not the control mice (C). Higher magnifications of the indicated cells are shown in (D′), (E′), and (F′). (G) There were more numerous caspase-3-positive cells in the Aze-treated versus control optic nerves (p = 0.0037, 2-tailed t-test). A, B, H, and E; C–F, caspase-3 IHC. All original magnifications: 240×.
FIGURE 9.
FIGURE 9.
Newborn mice with intrauterine and neonatal exposure to low dose Aze (Experiment N2), show greater apoptosis in spinal cord white matter than their equally exposed dams and versus water-treated controls. (A) TUNEL. p = 0.045; (B) Caspase-3 IHC, p < 0.0001, ANOVA.
FIGURE 10.
FIGURE 10.
Apoptotic OL in white matter of Aze-treated mice are immunostained for MHC I (Experiment A1). (A) Saline control shows no MHC 1 immunostaining of OL. Asterisk indicates positive control staining of endothelial cells in a microvessel. (B–D) Positive staining of individual cells with pyknotic or apoptotic nuclei from samples at the indicated levels of Aze exposure. Cells in boxes are shown at higher power in insets and adjacent. Original magnification: 240×. (E) Counts of MHC 1-positive cells in Aze-treated mice. 300 mg/kg versus 600 mg/kg, p = 0.0146, t-test. ND, not done.
FIGURE 11.
FIGURE 11.
Reactive microglia and microglial nodules in WM of Aze-treated adult mice (Experiment A1). (A, B) Saline controls show quiescent microglial features including thin elongated processes (red arrows) in cerebellar (A) and anterior spinal cord (B) WM. (C–F) Microglia in cerebellar (C, E, F), and anterior spinal cord (D, G, H) WM in Aze-treated mice show shorter, thicker processes, and more abundant cytoplasm. There are aggregates of reactive microglia with overlapping cytoplasm, i.e. microglial nodules (black arrows in [E] and examples in [G] and [H]). The numbers of microglial nodules increased with increasing doses (I). *p = 0.0019, one-way ANOVA. All are Iba-1 IHC. Original magnification: 160×.
FIGURE 12.
FIGURE 12.
Aze induces nuclear translocation of ATF3, ATF4, and ATF6 in OL in adult mice (Experiment A1). (A–I) Representative fields of spinal cord WM from mice with the indicated treatments show increased proportions of OL with nuclear immunostaining for ATF3 (A, B), ATF4 (D, E), and ATF6 (G, H) (arrows). Boxes in (B), (E), and (H) indicate OL shown at higher magnifications in adjacent panels. Red arrow and box in (B) indicate an OL apparently undergoing apoptosis. (C, F, I) Graphs demonstrate the effect of Aze dose. *p < 0.0001, ordinary ANOVA (C, I). *p = 0.0007, Welch ANOVA (F). Original magnification: 360×.
FIGURE 13.
FIGURE 13.
Aze induces nuclear translocation of EIF2α, GADD153, and PERK in OL in adult mice (Experiment A1). (A–I) Representative fields of spinal cord WM from mice with the indicated treatments show increased proportions of OL with nuclear immunostaining for EIF2α (A, B), GADD153 (D, E), and PERK (G, H) (arrows). Boxes in (B), (E), and (H) show OL at higher magnifications in adjacent panels. C, F, I: Graphs demonstrate the effect of Aze dose. *p < 0.0001, ordinary and Welch ANOVA. Original magnification: 360×.
FIGURE 14.
FIGURE 14.
Aze induces nuclear translocation of NFκB in OL in adult mice (Experiment A1). (A–C) Representative fields of spinal cord WM from mice with the indicated treatments show increased proportions of OL with nuclear immunostaining for NFκB (red arrows). Boxes indicate OL shown at higher magnifications in insets. Original magnification: 240×. (D) Graph demonstrates the effect of Aze dose. *p < 0.0001, ordinary ANOVA.
FIGURE 15.
FIGURE 15.
Aze induces nuclear translocation of XBP1 in OL in adult mice (Experiment A1). (A–D) Representative fields of spinal cord WM from mice with the indicated treatments show increased proportions of OL with nuclear immunostaining for XBP1 (red arrows). A preparation without hematoxylin (C) highlights increased immunoreactivity of OL nuclei. Boxes in (D) indicate OLs shown in higher mag. in insets. Original magnification: A–D, 360. (E) Graph demonstrates the effect of Aze dose. *p = 0.0338, ordinary ANOVA.
FIGURE 16.
FIGURE 16.
Hypothesized pathogenetic processes in the human CNS resulting from Aze misincorporation into MBP based on results of this study. The MBP misincorporation portion of this figure is adapted from Figure 6 in reference (10) with permission from Elsevier. Broken arrows indicate progressive degenerative processes that may develop over many years.

Similar articles

Cited by

References

    1. Rubenstein E. Misincorporation of the proline analog azetidine-2-carboxylic acid in the pathogenesis of multiple sclerosis: A hypothesis. J Neuropathol Exp Neurol 2008;67:1035–40 - PubMed
    1. Sobel RA. A novel unifying hypothesis of multiple sclerosis. J Neuropathol Exp Neurol 2008;67:1032–4 - PubMed
    1. Rubenstein E, Zhou H, Krasinska KM, et al.Azetidine-2-carboxylic acid in garden beets (Beta vulgaris). Phytochemistry 2006;67:898–903 - PubMed
    1. Central Intelligence Agency. The World Factbook, Field Listing, Agriculture Products. Washington, DC: Central Intelligence Agency; 2021.
    1. Simpson S Jr, Wang W, Otahal P, et al.Latitude continues to be significantly associated with the prevalence of multiple sclerosis: An updated meta-analysis. J Neurol Neurosurg Psychiatry 2019;90:1193–200. - PubMed

Publication types