. 2022 Jul;9(20):e2200315.
doi: 10.1002/advs.202200315. Epub 2022 May 6.

Super-Resolution Vibrational Imaging Using Expansion Stimulated Raman Scattering Microscopy

Affiliations

Super-Resolution Vibrational Imaging Using Expansion Stimulated Raman Scattering Microscopy

Lixue Shi et al. Adv Sci (Weinh). 2022 Jul.

Abstract

Stimulated Raman scattering (SRS) microscopy is an emerging technology that provides high chemical specificity for endogenous biomolecules and can circumvent common constraints of fluorescence microscopy including limited capabilities to probe small biomolecules and difficulty resolving many colors simultaneously. However, the resolution of SRS microscopy remains governed by the diffraction limit. To overcome this, a new technique called molecule anchorable gel-enabled nanoscale Imaging of Fluorescence and stimulated Raman scattering microscopy (MAGNIFIERS) that integrates SRS microscopy with expansion microscopy (ExM) is described. MAGNIFIERS offers chemical-specific nanoscale imaging with sub-50 nm resolution and has scalable multiplexity when combined with multiplex Raman probes and fluorescent labels. MAGNIFIERS is used to visualize nanoscale features in a label-free manner with CH vibration of proteins, lipids, and DNA in a broad range of biological specimens, from mouse brain, liver, and kidney to human lung organoid. In addition, MAGNIFIERS is applied to track nanoscale features of protein synthesis in protein aggregates using metabolic labeling of small metabolites. Finally, MAGNIFIERS is used to demonstrate 8-color nanoscale imaging in an expanded mouse brain section. Overall, MAGNIFIERS is a valuable platform for super-resolution label-free chemical imaging, high-resolution metabolic imaging, and highly multiplexed nanoscale imaging, thus bringing SRS to nanoscopy.

Keywords: Raman nanoscopy; chemical imaging; expansion microscopy; highly multiplexed nanoscale imaging; metabolic imaging.


Conflict of interest statement

The authors declare the following competing financial interest(s): Y.Z., A.K., and F.F. are inventors on several inventions related to ExM methods.

Figures
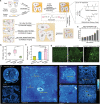
Figure 1
Figure 1
Integration of SRS with an optimized ExM protocol (MAGNIFY). a) Schematics of the workflow of MAGNIFIERS and gel chemistry of MAGNIFY. During in situ polymer synthesis, methacrolein was added as a part of the monomer solution to efficiently attach biomolecules to the growing matrix. The gel was formed from polymerization of cocktails of the monomers acrylamide (AA, nonionic monomer), sodium acrylate (SA, ionic monomer) and N,N‐dimethylacrylamide (DMAA, nonionic self‐cross‐linker. Afterward, the gel‐embedded specimens were treated with sodium dodecyl sulfate (SDS)/urea solution in 80–90 °C for at least 1 h for homogenization. PFA, paraformaldehyde. b) Quantification of protein contents for untreated and expanded (expanded with methacrolein‐linking and SDS/urea homogenization or Proteinase K digestion) mouse kidney. SRS signals were plotted as mean ±  s.d. (n = 29, 25, 25 regions of interest (ROIs)). Absolute signal in the untreated sample is converted with a volume dilution factor of 4.33 ≅ 80‐fold after expansion. Two‐tailed unpaired t‐test, ****< 0.0001, = 13. c) Comparison of protein retention on the proExM protocol with the MAGNIFIERS protocol. SRS signals were plotted as mean ±  s.d. (n = 5, 4, 4 ROIs). One‐way ANOVA followed by Bonferroni's post hoc test using the “Methacrolein+SDS” as the control column, ****< 0.0001 and **= 0.0085. d) SRS images of CH3 at 2941 cm–1 in the mouse brain tissues. (left) expanded in proExM protocol with AcX as the crosslinker and Proteinase K digestion, (middle) expanded with AcX as the crosslinker and SDS/urea homogenization, (right) expanded with methacrolein‐linking and SDS/urea homogenization. e) Measurement of expansion factors (mean ± s.d.) in PBS buffers with different salt concentrations. Corresponding salt concentrations of used PBS buffer solution are labeled on the up x‐axis. Values of n are provided in Table S2 (Supporting Information). f) 3D‐rendered SRS images of CH3 peak at 2941 cm–1 of PFA‐fixed HeLa cell, mouse brain, liver, kidney, and pancreas tissues, and FFPE human kidney and brain hippocampus tissue. Expansion factors are 4.5 for HeLa, organoid and mouse brain, 4.3 for mouse kidney, liver, and pancreas, 3.8 for FFPE human kidney and FFPE human spleen, 2.0 for FFPE human hippocampus in 1× PBS. Scale bars, 10 µm in (d,f) and calibrated in biological scale.
Figure 2
Figure 2
MAGNIFIERS visualizes ultrafine structures of biological samples via label‐free protein imaging. a) Hyperspectral SRS imaging of the C—H stretching region on expanded FFPE human kidney. Left, masks of tissue area (red) and blank gel area (blue) for spectral analysis labeled on the SRS image of 2941 cm–1. Right, SRS spectra of two masked areas. Single‐frequency SRS images are in Figure S4a (Supporting Information). b) Background‐removed SRS spectrum of expanded FFPE human kidney. c) SRS CH3 image at 2941 cm–1 and fluorescence image of Alexa Fluor 555 NHS ester labeled mouse brain tissue. d) CH3 image of extended mouse brain in 1/50 × PBS (7.2‐fold expansion) with a 1.2 NA objective. e) Zoom into the region outlined by the white box in (d). Right, line profile of a sub‐diffraction‐limited spot outlined by the yellow line. f) Fine structures of blood–brain barrier in mouse brain tissue. Single endothelial cells and a pericyte were visualized. Images were collected using a 1.05 NA objective in 1× PBS (4.5‐fold expansion). Right, zoom into the region outlined by the white box. g) Blood vessels and capillaries stand out in the protein channel, confirmed by lectin staining. Expanded mouse brain tissue labeled with L. Esculentum lectin (LEL)‐DyLight 649 and imaged with a 1.05 NA objective in 1× PBS (4.5‐fold expansion). h) SRS protein image in expanded mouse kidney. PCT, proximal convoluted tubule. Yellow region highlights the cilia on the surface of PCT. Images were collected using a 1.05 NA objective in 1× PBS (4.3‐fold expansion). i) SRS protein image reveals periodic podocyte foot processes in expanded FFPE human kidney tissue. Right, zoom into the region outlined by the white box. Images were collected using a 1.2 NA objective in 1× PBS (3.8‐fold expansion). j–m) Flower‐like cilia structure (j,k) and the ring structure at the base of cilia (l,m) in the expanded human lung organoid were visualized by the protein channel at 2941 cm–1. Yellow arrows in (k,m) highlight the basal bodies. Images were collected with a 1.05 NA objective, (j,l) in 1× PBS (4.5‐fold expansion) and (k,m) in 1/50 × PBS (7.2‐fold expansion). Scale bars (in biological scales), 200 nm in (e,m); 1 µm in (d,i (right), k,l); 2 µm in (f,h,j); 5 µm in (c,g,i (left)).
Figure 3
Figure 3
Label‐free nanoscale imaging of chemical compositions. a) Spectrally unmixed C—H channels for protein, lipids, and DNA in expanded human lung organoid. b) Two‐color overlayed images of zoom‐in areas outlined by the yellow box in (a). Arrows indicate EVs containing lipids and DNA. Images were collected using a 1.05 NA objective in 1× PBS (4.5‐fold expansion). c) SRS spectral analysis of the cell area (blue) and extracellular vesicles (EVs, red) in the human lung organoid. Left, selected areas for spectral analysis representing the cell (blue) and EVs (red). Right, background‐subtracted SRS spectra. Arrow indicated a side peak ≈2865 cm–1 contributing from the CH2 signal of lipids in small EVs. Raw hyperspectral SRS spectra and all single‐frequency SRS images are in Figure S6a (Supporting Information). d) Hyperspectral SRS spectrum at C—H region of a single EV in (b) marked by a pink arrow. e) Spectrally unmixed C—H channels for protein and lipids in the expanded mouse brain tissue. Right, zoom into areas outlined by the white boxes. Images were collected using a 1.05 NA objective in 1× PBS (2.0‐fold expansion, original ExM gel). f) CHLipid and DiD stain images of expanded mouse cerebellum. g) Transverse cross‐section of an individual axon in the expanded mouse brain tissue. Images were collected using a 1.05 NA objective in 1/25 × PBS (2.6‐fold expansion, original ExM gel). Right, corresponding plot of the intensity of proteins and lipids along the yellow box long axis. h) Overlayed images of DNA and protein in the expanded mouse cerebellum. Shaded areas in (c,d) indicate the s.e.m. from different pixels. Scale bars (in biological scales), 500 nm in (g); 2 µm in (a,b,e); 5 µm in (f); 10 µm in (c,h).
Figure 4
Figure 4
Super‐resolution metabolic imaging of newly synthesized protein in Huntingtin aggregates. a) Deuterated amino acids (D‐AAs) labeling in time with simultaneous expression of mutant huntingtin (mHtt74Q‐GFP) proteins for 48 h. The cartoons display the experimental pipeline of plasmid transfection, medium exchanges, fixation, and expansion. b–d) Representative ROIs of CH3 images at 2941 cm–1 and CD images at 2135 cm–1 after expansion. Up in (c,d), zoom into the region outlined by the yellow box. e) Ratio images of CD/CH3 for ROI in (b). Right, zoom into the region outlined by the black box. Arrow pointed out representative aggregates analyzed in (f,g). f) Analysis of the aggregate pointed with black arrow in (e). g) Analysis of the aggregate pointed with white arrow in (e). h) Ratio images of CD/CH3 for ROI in (c,d). Down, zoom into the regions outlined by the dotted box. All images were collected with a 1.05 NA objective in 5× PBS (3.44‐fold expansion). Scale bars (in biological scales), 5 µm in (b–d, e (left), h (up)); 500 nm in (f–g, e (right), h (down)).
Figure 5
Figure 5
Nanoscale Raman dye imaging. a) Chemical structure of NHS ester functionalized MARS2228. b) Staining background when 1× PBS was used as the staining buffer. c) Correct staining patterns of Synaptophysin using 9× PBS with 10% Triton‐X as the staining buffer. d) Immuno‐eprSRS image of actinin‐4 (ACTN4, specifically label tertiary podocyte foot processes) in FFPE human kidney tissue with MARS2228. Inset, zoom into the region outlined by the blue box, dotted white curve within the inset indicates the line cut analyzed below. e) Normalized epr‐SRS signal of the nitrile mode of MARS2228 along the line cut of the inset in (d). f) 3D‐rendered epr‐SRS image of MARS2228‐conjugated L. Esculentum lectin (LEL) labeling and CH3 image of 2941 cm–1. g) 3D‐rendered epr‐SRS image of expanded human lung organoid stained with MARS2147 NHS ester dye. Images were collected using a 1.05 NA objective (d) in 1/50 × PBS (4.28‐fold expansion, human kidney ExPath gel), (b,c, f–g) in 1× PBS (4.5‐fold expansion, mouse brain MAGNIFY gel). Scale bars (in biological scales), 10 µm in (b,c); 5 µm in (d,f,g).
Figure 6
Figure 6
One‐shot highly multiplexed nanoscale imaging. a) One‐shot 8‐plex 3D‐rendered nanoscale imaging of post‐expansion mouse brain slice. Fluorescence: DAPI (total DNA), microtubule associated protein 2 (MAP2, Cy3), L. Esculentum lectin (LEL‐DyLight 649, blood vessels). SRS: Synaptophysin (MARS2228, synapse vesicles), α‐tubulin (MARS2176), postsynaptic density protein 95 (PSD95, MARS2147, post‐synaptic membrane), CHPr and CHL. Voxel size is 0.318  × 0.318  × 1 µm in post‐expansion distance. b) Single‐plane image of overlayed synaptophysin and PSD95 channels. c) Zoom‐in of 3D‐rendered overlayed synaptophysin and PSD95 image. Yellow box outlined zoom‐in image in (d) for separation distance analysis. d) A representative image of single synapses and corresponding plot of the staining intensity of PSD95 and synaptophysin along the dotted line. Solid lines, Gaussian fits. e) Statistical analysis of Synaptophysin‐PSD95 separations (n = 119 synapses). Above is the box plot of the separation distances. Images were acquired with a 25× objective in 1× PBS (4.5‐fold expansion). Scale bars (in biological scales), 10 µm in (a), 2 µm in (b), 500 nm in (c).

References

    1. Freudiger C. W., Min W., Saar B. G., Lu S., Holtom G. R., He C., Tsai J. C., Kang J. X., Xie X. S., Science 2008, 322, 1857. - PMC - PubMed
    1. Hu F., Shi L., Min W., Nat. Methods 2019, 16, 830. - PubMed
    1. Cheng J.‐X., Xie X. S., Science 2015, 350, aaa8870. - PubMed
    1. Wei L., Hu F., Chen Z., Shen Y., Zhang L., Min W., Acc. Chem. Res. 2016, 49, 1494. - PMC - PubMed
    1. Wei L., Shen Y., Xu F., Hu F., Harrington J. K., Targoff K. L., Min W., ACS Chem. Biol. 2015, 10, 901. - PMC - PubMed

Publication types

LinkOut - more resources