Randomized Controlled Trial
. 2022 May;4(3):e210105.
doi: 10.1148/rycan.210105.

Interobserver Variability in CT-based Morphologic Tumor Response Assessment of Colorectal Liver Metastases

Affiliations
Randomized Controlled Trial

Interobserver Variability in CT-based Morphologic Tumor Response Assessment of Colorectal Liver Metastases

Nina J Wesdorp et al. Radiol Imaging Cancer. 2022 May.

Abstract

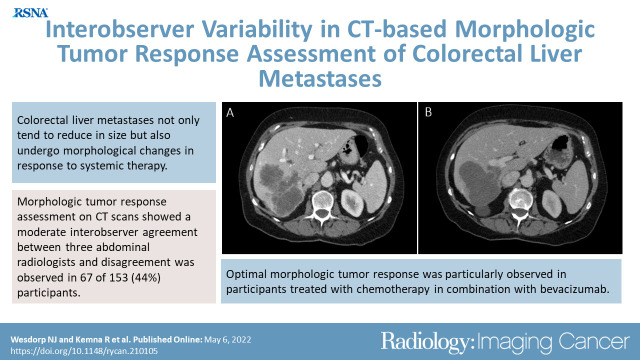
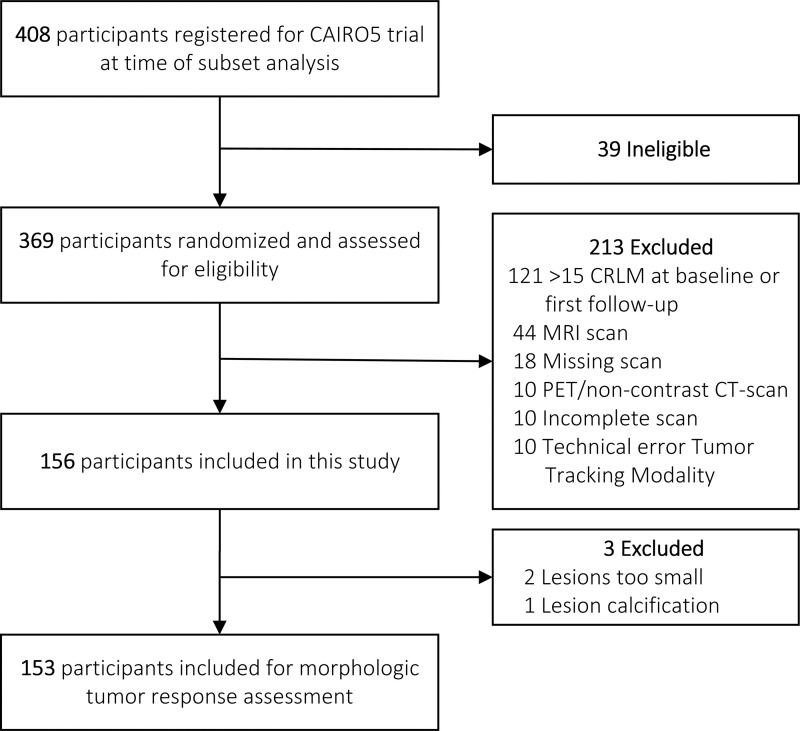
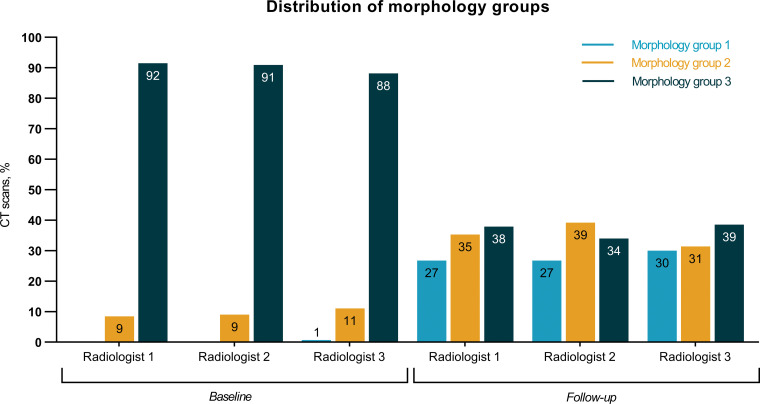
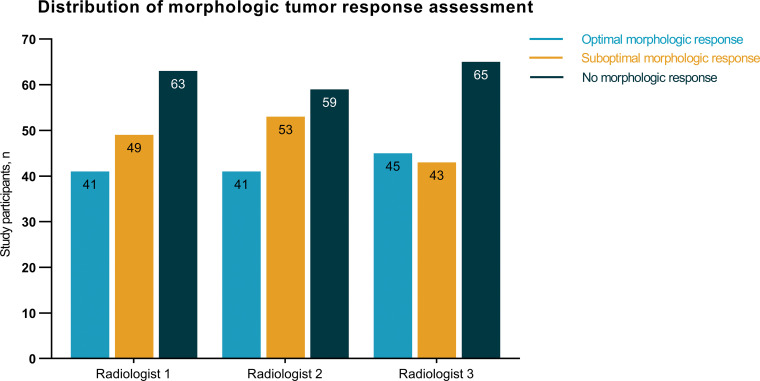
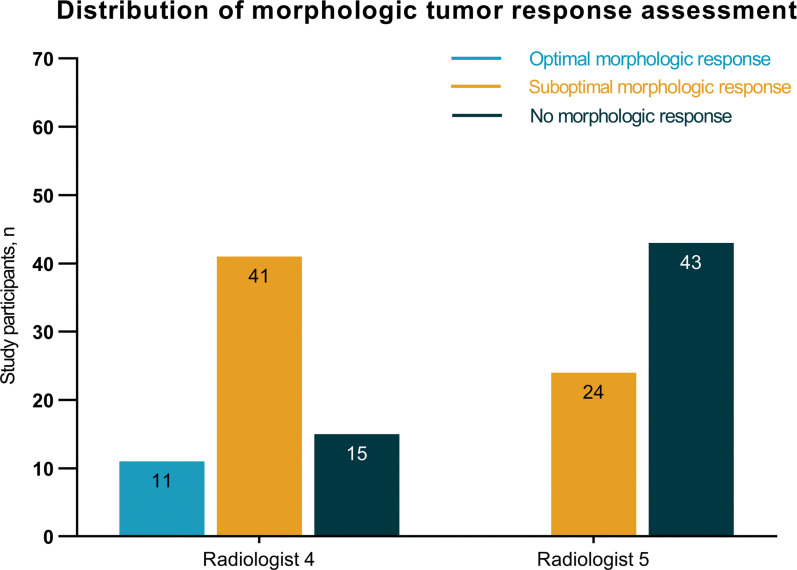
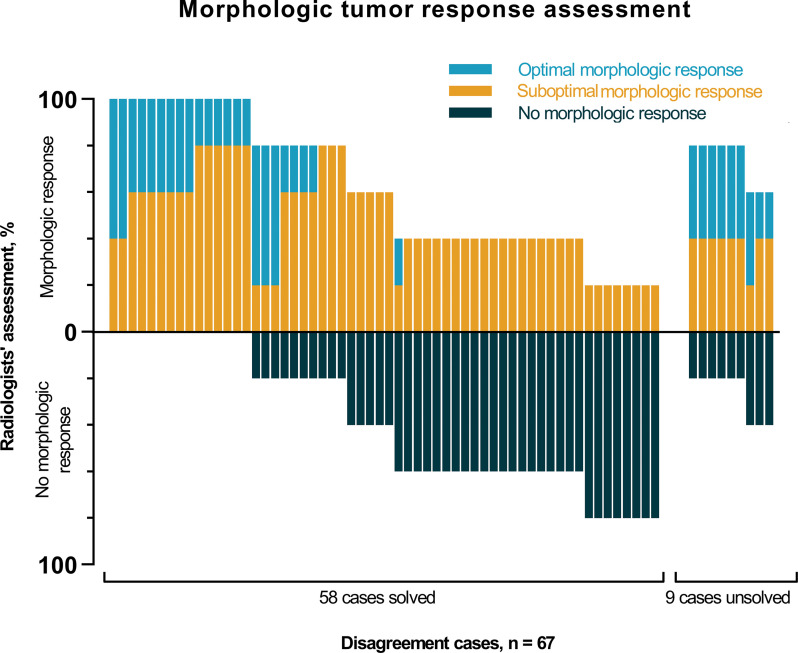
Purpose To evaluate interobserver variability in the morphologic tumor response assessment of colorectal liver metastases (CRLM) managed with systemic therapy and to assess the relation of morphologic response with gene mutation status, targeted therapy, and Response Evaluation Criteria in Solid Tumors (RECIST) version 1.1 measurements. Materials and Methods Participants with initially unresectable CRLM receiving different systemic therapy regimens from the randomized, controlled CAIRO5 trial (NCT02162563) were included in this prospective imaging study. Three radiologists independently assessed morphologic tumor response on baseline and first follow-up CT scans according to previously published criteria. Two additional radiologists evaluated disagreement cases. Interobserver agreement was calculated by using Fleiss κ. On the basis of the majority of individual radiologic assessments, the final morphologic tumor response was determined. Finally, the relation of morphologic tumor response and clinical prognostic parameters was assessed. Results In total, 153 participants (median age, 63 years [IQR, 56-71]; 101 men) with 306 CT scans comprising 2192 CRLM were included. Morphologic assessment performed by the three radiologists yielded 86 (56%) agreement cases and 67 (44%) disagreement cases (including four major disagreement cases). Overall interobserver agreement between the panel radiologists on morphology groups and morphologic response categories was moderate (κ = 0.53, 95% CI: 0.48, 0.58 and κ = 0.54, 95% CI: 0.47, 0.60). Optimal morphologic response was particularly observed in patients treated with bevacizumab (P = .001) and in patients with RAS/BRAF mutation (P = .04). No evidence of a relationship between RECIST 1.1 and morphologic response was found (P = .61). Conclusion Morphologic tumor response assessment following systemic therapy in participants with CRLM demonstrated considerable interobserver variability. Keywords: Tumor Response, Observer Performance, CT, Liver, Metastases, Oncology, Abdomen/Gastrointestinal Clinical trial registration no. NCT02162563 Supplemental material is available for this article. © RSNA, 2022.

Keywords: Abdomen/Gastrointestinal; CT; Liver; Metastases; Observer Performance; Oncology; Tumor Response.


Conflict of interest statement

Disclosures of conflicts of interest: N.J.W. The CAIRO5 study is supported by unrestricted scientific grants from Roche and Amgen. Current study is supported by an unrestricted grant from the Cancer Center Amsterdam Foundation. The funders had no role in the design, conduct, analysis of the study, writing of the manuscript, nor in the decision to submit the manuscript for publication. R.K. No relevant relationships. K.B. No relevant relationships. J.H.T.M.v.W. No relevant relationships. I.M.G.C.N. No relevant relationships. F.S. No relevant relationships. I.O.A. No relevant relationships. S.S.K.S.P. No relevant relationships. S.v.D. No relevant relationships. M.J.v.A. No relevant relationships. T.C. No relevant relationships. C.H.C.D. No relevant relationships. M.R.W.E. No relevant relationships. M.F.G. No relevant relationships. D.G. No relevant relationships. T.M.v.G. No relevant relationships. J.J.H. Consulting fees to Amsterdam University Medical Center (reader of the study) (payments were made to the Radboud University Medical Center). K.P.d.J. No relevant relationships. J.M.K. Prehabilitation outpatient clinic educational grant 2019 (Johnson and Johnson grant 20K and 24K to UMCG); prehabilitation implementation grant 2021 (Johnson and Johnson grant 30K to UMCG/NvVH); prehabiltation implementation grant 2021 (Viphor Pharma grant 20K to UMCG); member of several committees of the NVvH (prehabilitation working group, audit working group, Dutch Society of Surgery). M.S.L.L. No relevant relationships. K.P.v.L. No relevant relationships. I.Q.M. No relevant relationships. G.A.P. No relevant relationships. A.R.M. No relevant relationships. T.M.R. No relevant relationships. C.V. No relevant relationships. J.H.W.d.W. Grants from Dutch Cancer Society, ZonMW, Roche, Covidien, and Bergh in het zadel Foundation. R.J.S. No relevant relationships. C.J.A.P. Advisory role for Nordic Pharma. J.H. No relevant relationships. J.S. Vice President of European Society of Gastrointestinal and Abdominal Radiology (unpaid). G.K. SAS Analytics provided expertise and technical support; traveling expenses from SAS Analytics.

Figures

None
Graphical abstract
Flow diagram of selection study sample for morphologic tumor response
assessment. CLRM = colorectal liver metastases.
Figure 1:
Flow diagram of selection study sample for morphologic tumor response assessment. CLRM = colorectal liver metastases.
Morphologic response categories. Baseline and follow-up CT scans show
(A, B) an optimal morphologic response of colorectal liver metastases with
the transition of heterogeneous attenuation and ill-defined
tumor–liver interface (A) to homogeneous and hypoattenuating
attenuation and sharp tumor–liver interface (B) and (C, D) suboptimal
morphologic response with the transition of heterogeneous attenuation and
ill-defined tumor–liver interface (C) to homogeneous attenuation but
ill-defined tumor–liver interface remaining after treatment
(D).
Figure 2:
Morphologic response categories. Baseline and follow-up CT scans show (A, B) an optimal morphologic response of colorectal liver metastases with the transition of heterogeneous attenuation and ill-defined tumor–liver interface (A) to homogeneous and hypoattenuating attenuation and sharp tumor–liver interface (B) and (C, D) suboptimal morphologic response with the transition of heterogeneous attenuation and ill-defined tumor–liver interface (C) to homogeneous attenuation but ill-defined tumor–liver interface remaining after treatment (D).
Distribution of the morphology group assignments according to baseline
CT scan (n = 153) and follow-up CT scan (n = 153) performed by the three
radiologists.
Figure 3:
Distribution of the morphology group assignments according to baseline CT scan (n = 153) and follow-up CT scan (n = 153) performed by the three radiologists.
Distribution of the morphologic tumor response assessments (n = 153)
performed by the three radiologists.
Figure 4:
Distribution of the morphologic tumor response assessments (n = 153) performed by the three radiologists.
Distribution of the morphologic tumor response assessments of the
disagreement cases (n = 67) performed by the additional two
radiologists.
Figure 5:
Distribution of the morphologic tumor response assessments of the disagreement cases (n = 67) performed by the additional two radiologists.
Bar chart depicts the morphologic tumor response assessment of the 67
disagreement cases of the three radiologists and the assessment by the two
additional radiologists involved only in the disagreement cases’
assessment. Each bar represents one participant. The chart depicts the
percentages of radiologists’ assessment for classifying participants
as optimal morphologic response (blue), suboptimal morphologic response
(orange), and no morphologic response (dark blue). Based on the majority of
votes, 58 cases were solved and nine cases remained unsolved.
Figure 6:
Bar chart depicts the morphologic tumor response assessment of the 67 disagreement cases of the three radiologists and the assessment by the two additional radiologists involved only in the disagreement cases’ assessment. Each bar represents one participant. The chart depicts the percentages of radiologists’ assessment for classifying participants as optimal morphologic response (blue), suboptimal morphologic response (orange), and no morphologic response (dark blue). Based on the majority of votes, 58 cases were solved and nine cases remained unsolved.

References

    1. Siegel RL , Miller KD , Jemal A . Cancer statistics, 2019 . CA Cancer J Clin 2019. ; 69 ( 1 ): 7 – 34 . - PubMed
    1. Elferink MAG , de Jong KP , Klaase JM , Siemerink EJ , de Wilt JHW . Metachronous metastases from colorectal cancer: a population-based study in North-East Netherlands . Int J Colorectal Dis 2015. ; 30 ( 2 ): 205 – 212 . - PubMed
    1. van der Geest LGM , Lam-Boer J , Koopman M , Verhoef C , Elferink MA , de Wilt JH . Nationwide trends in incidence, treatment and survival of colorectal cancer patients with synchronous metastases . Clin Exp Metastasis 2015. ; 32 ( 5 ): 457 – 465 . - PubMed
    1. Adam R , De Gramont A , Figueras J , et al. . The oncosurgery approach to managing liver metastases from colorectal cancer: a multidisciplinary international consensus . Oncologist 2012. ; 17 ( 10 ): 1225 – 1239 . - PMC - PubMed
    1. de Ridder JAM , van der Stok EP , Mekenkamp LJ , et al. . Management of liver metastases in colorectal cancer patients: a retrospective case-control study of systemic therapy versus liver resection . Eur J Cancer 2016. ; 59 ( 13 ): 21 . - PubMed

Publication types

Associated data