. 2022 Aug;67(2):241-252.
doi: 10.1165/rcmb.2021-0563OC.

Airway Macrophages Encompass Transcriptionally and Functionally Distinct Subsets Altered by Smoking

Affiliations

Airway Macrophages Encompass Transcriptionally and Functionally Distinct Subsets Altered by Smoking

Maude Liégeois et al. Am J Respir Cell Mol Biol. 2022 Aug.

Abstract

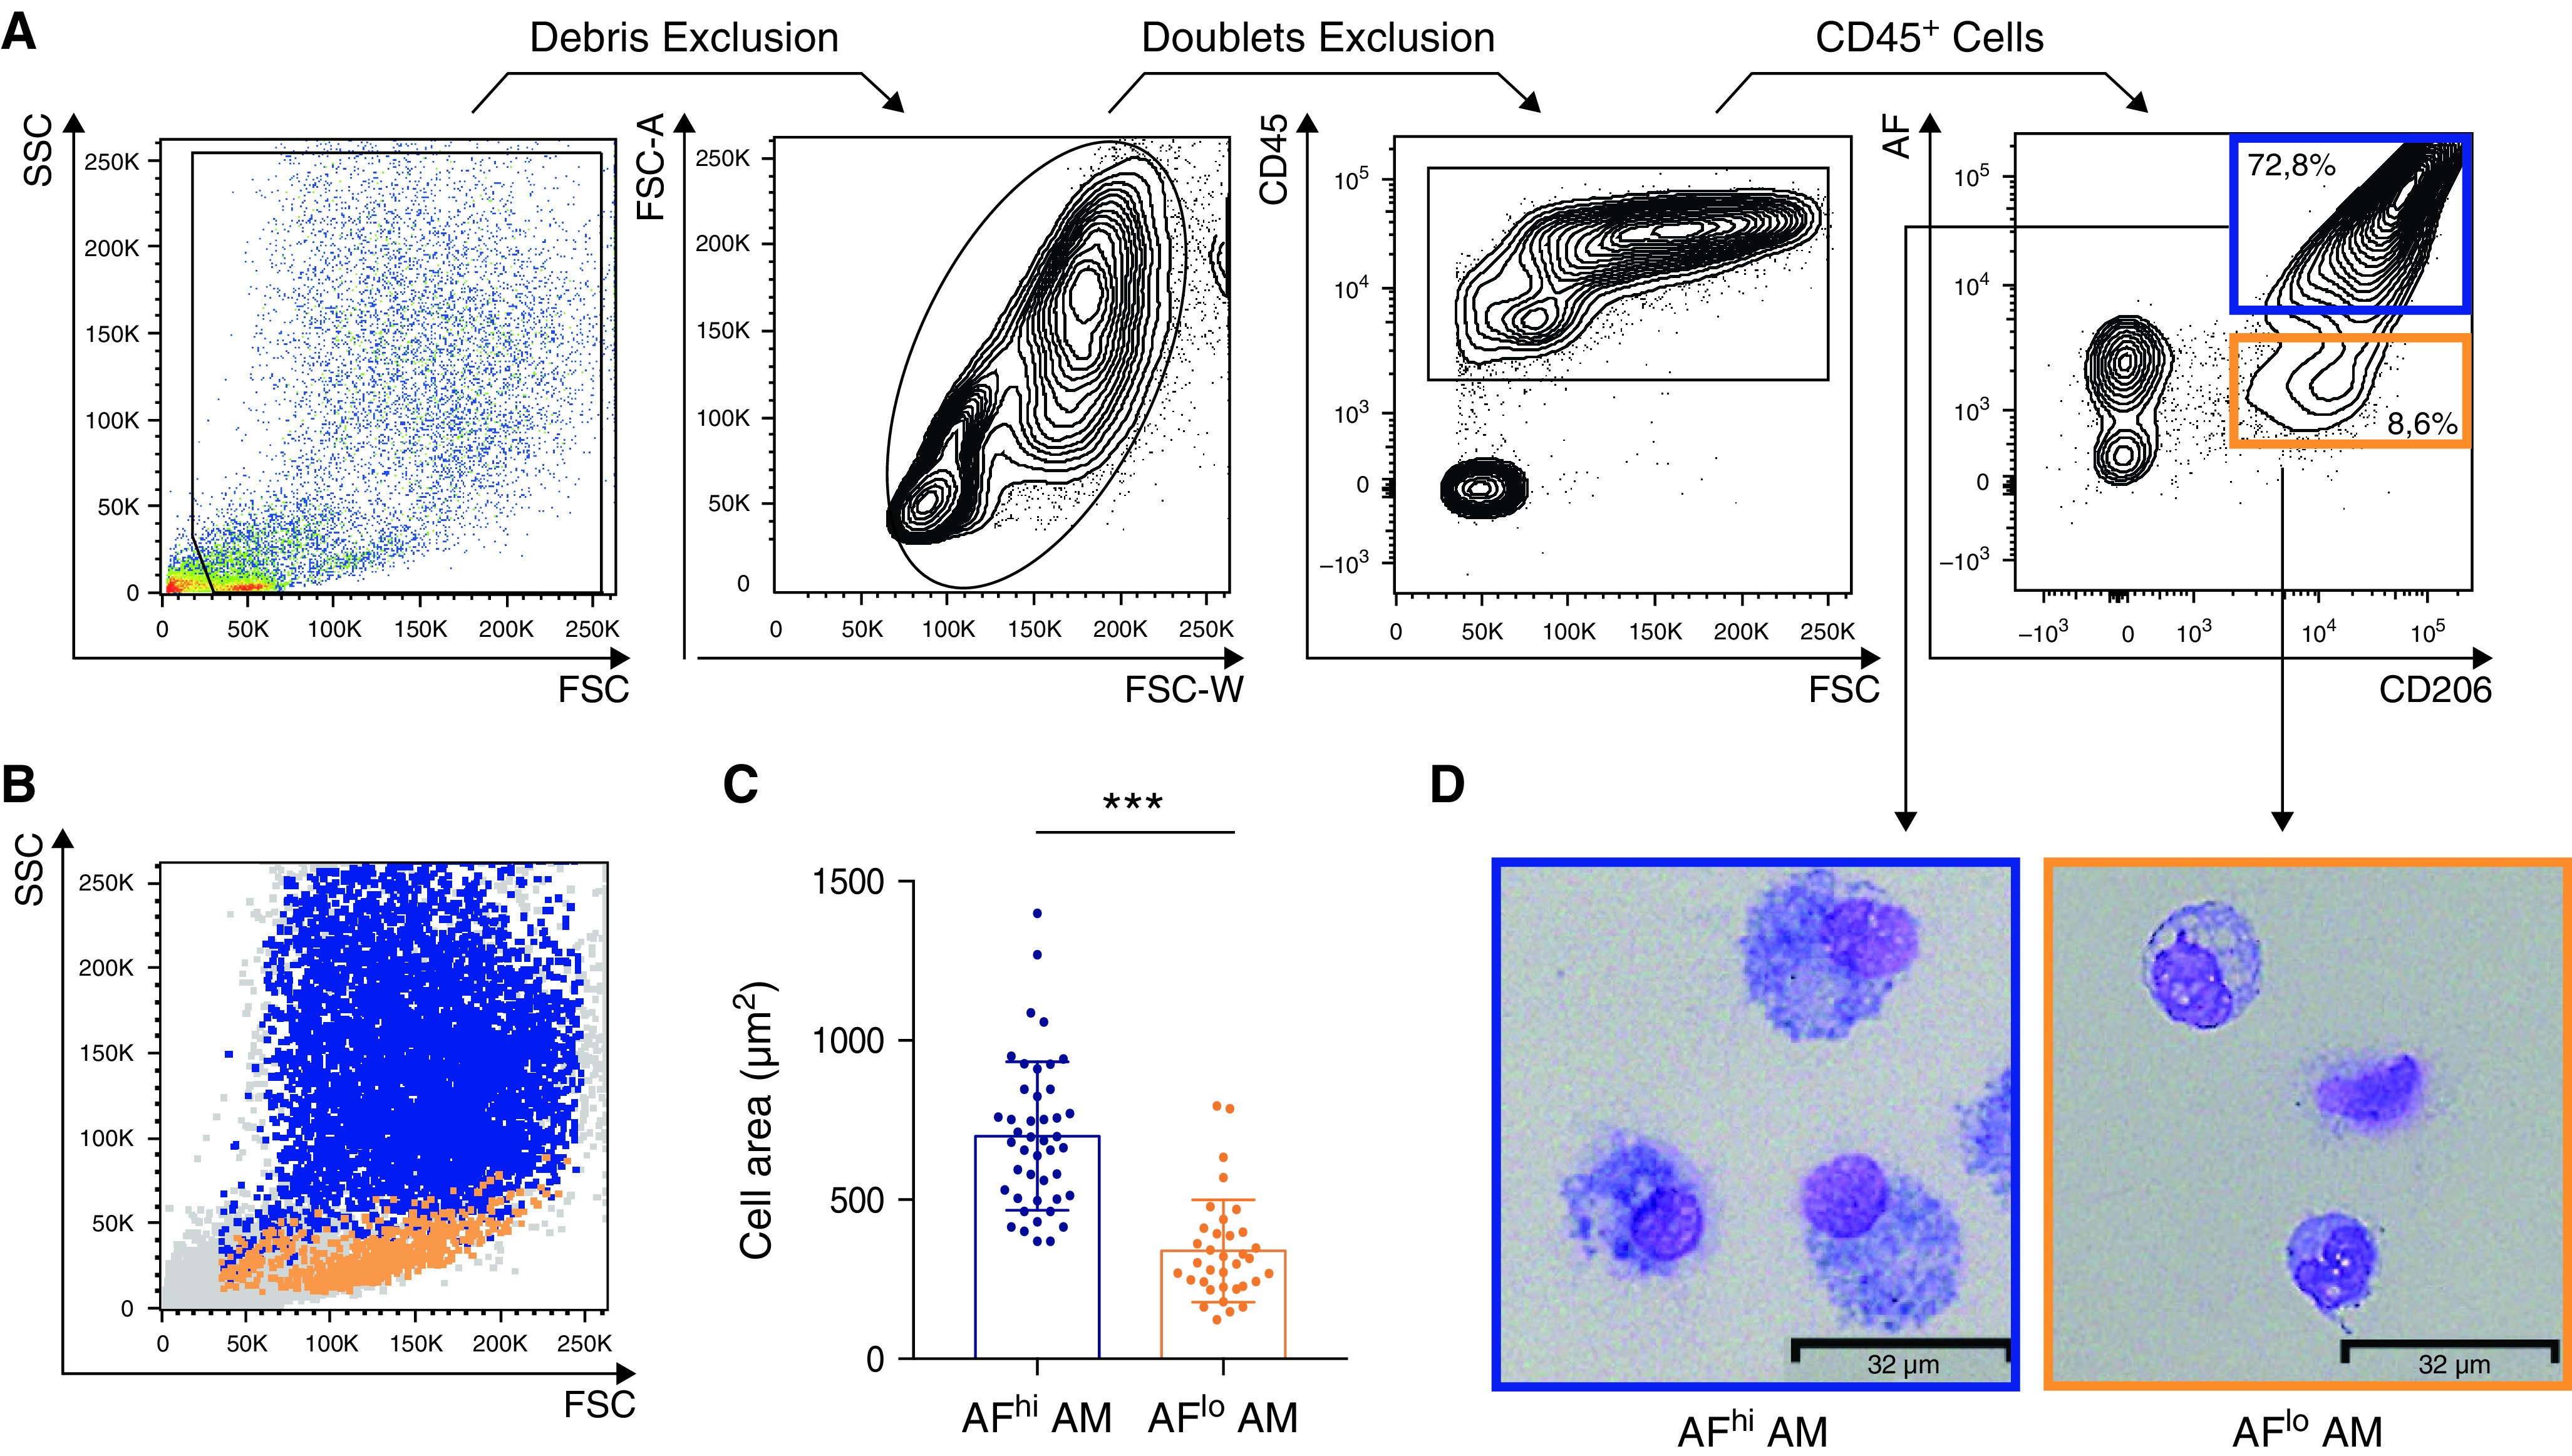
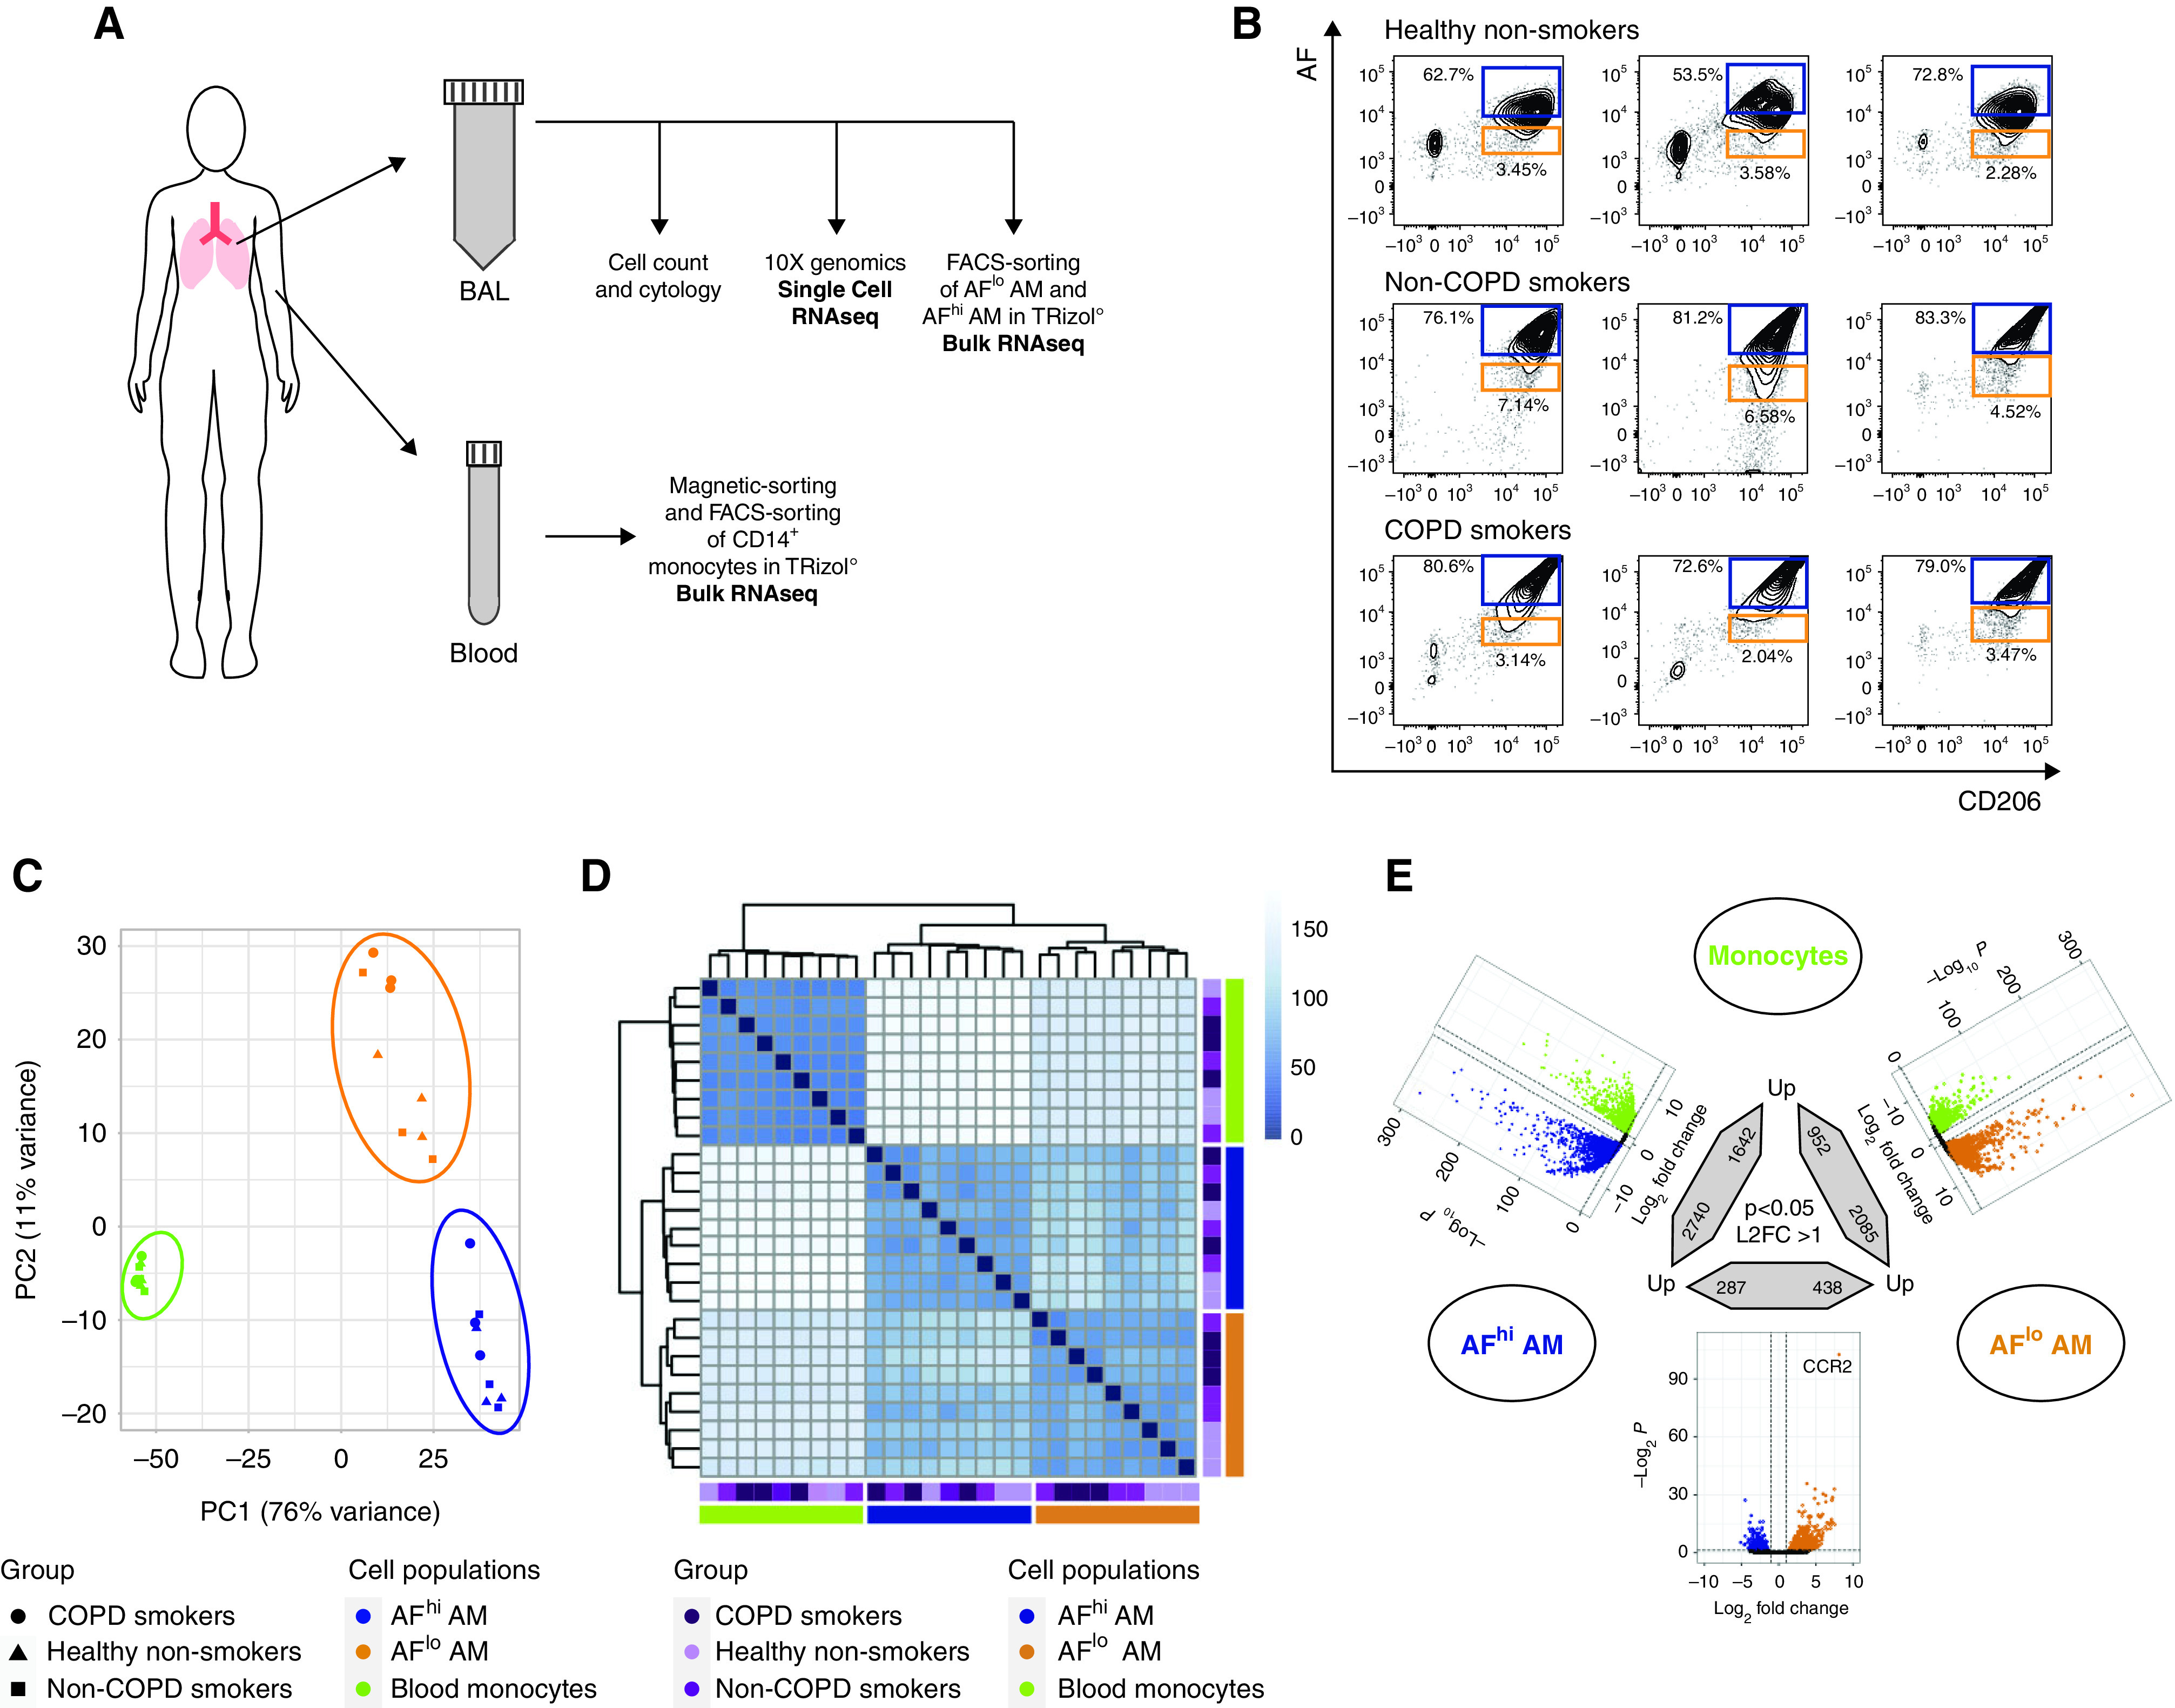
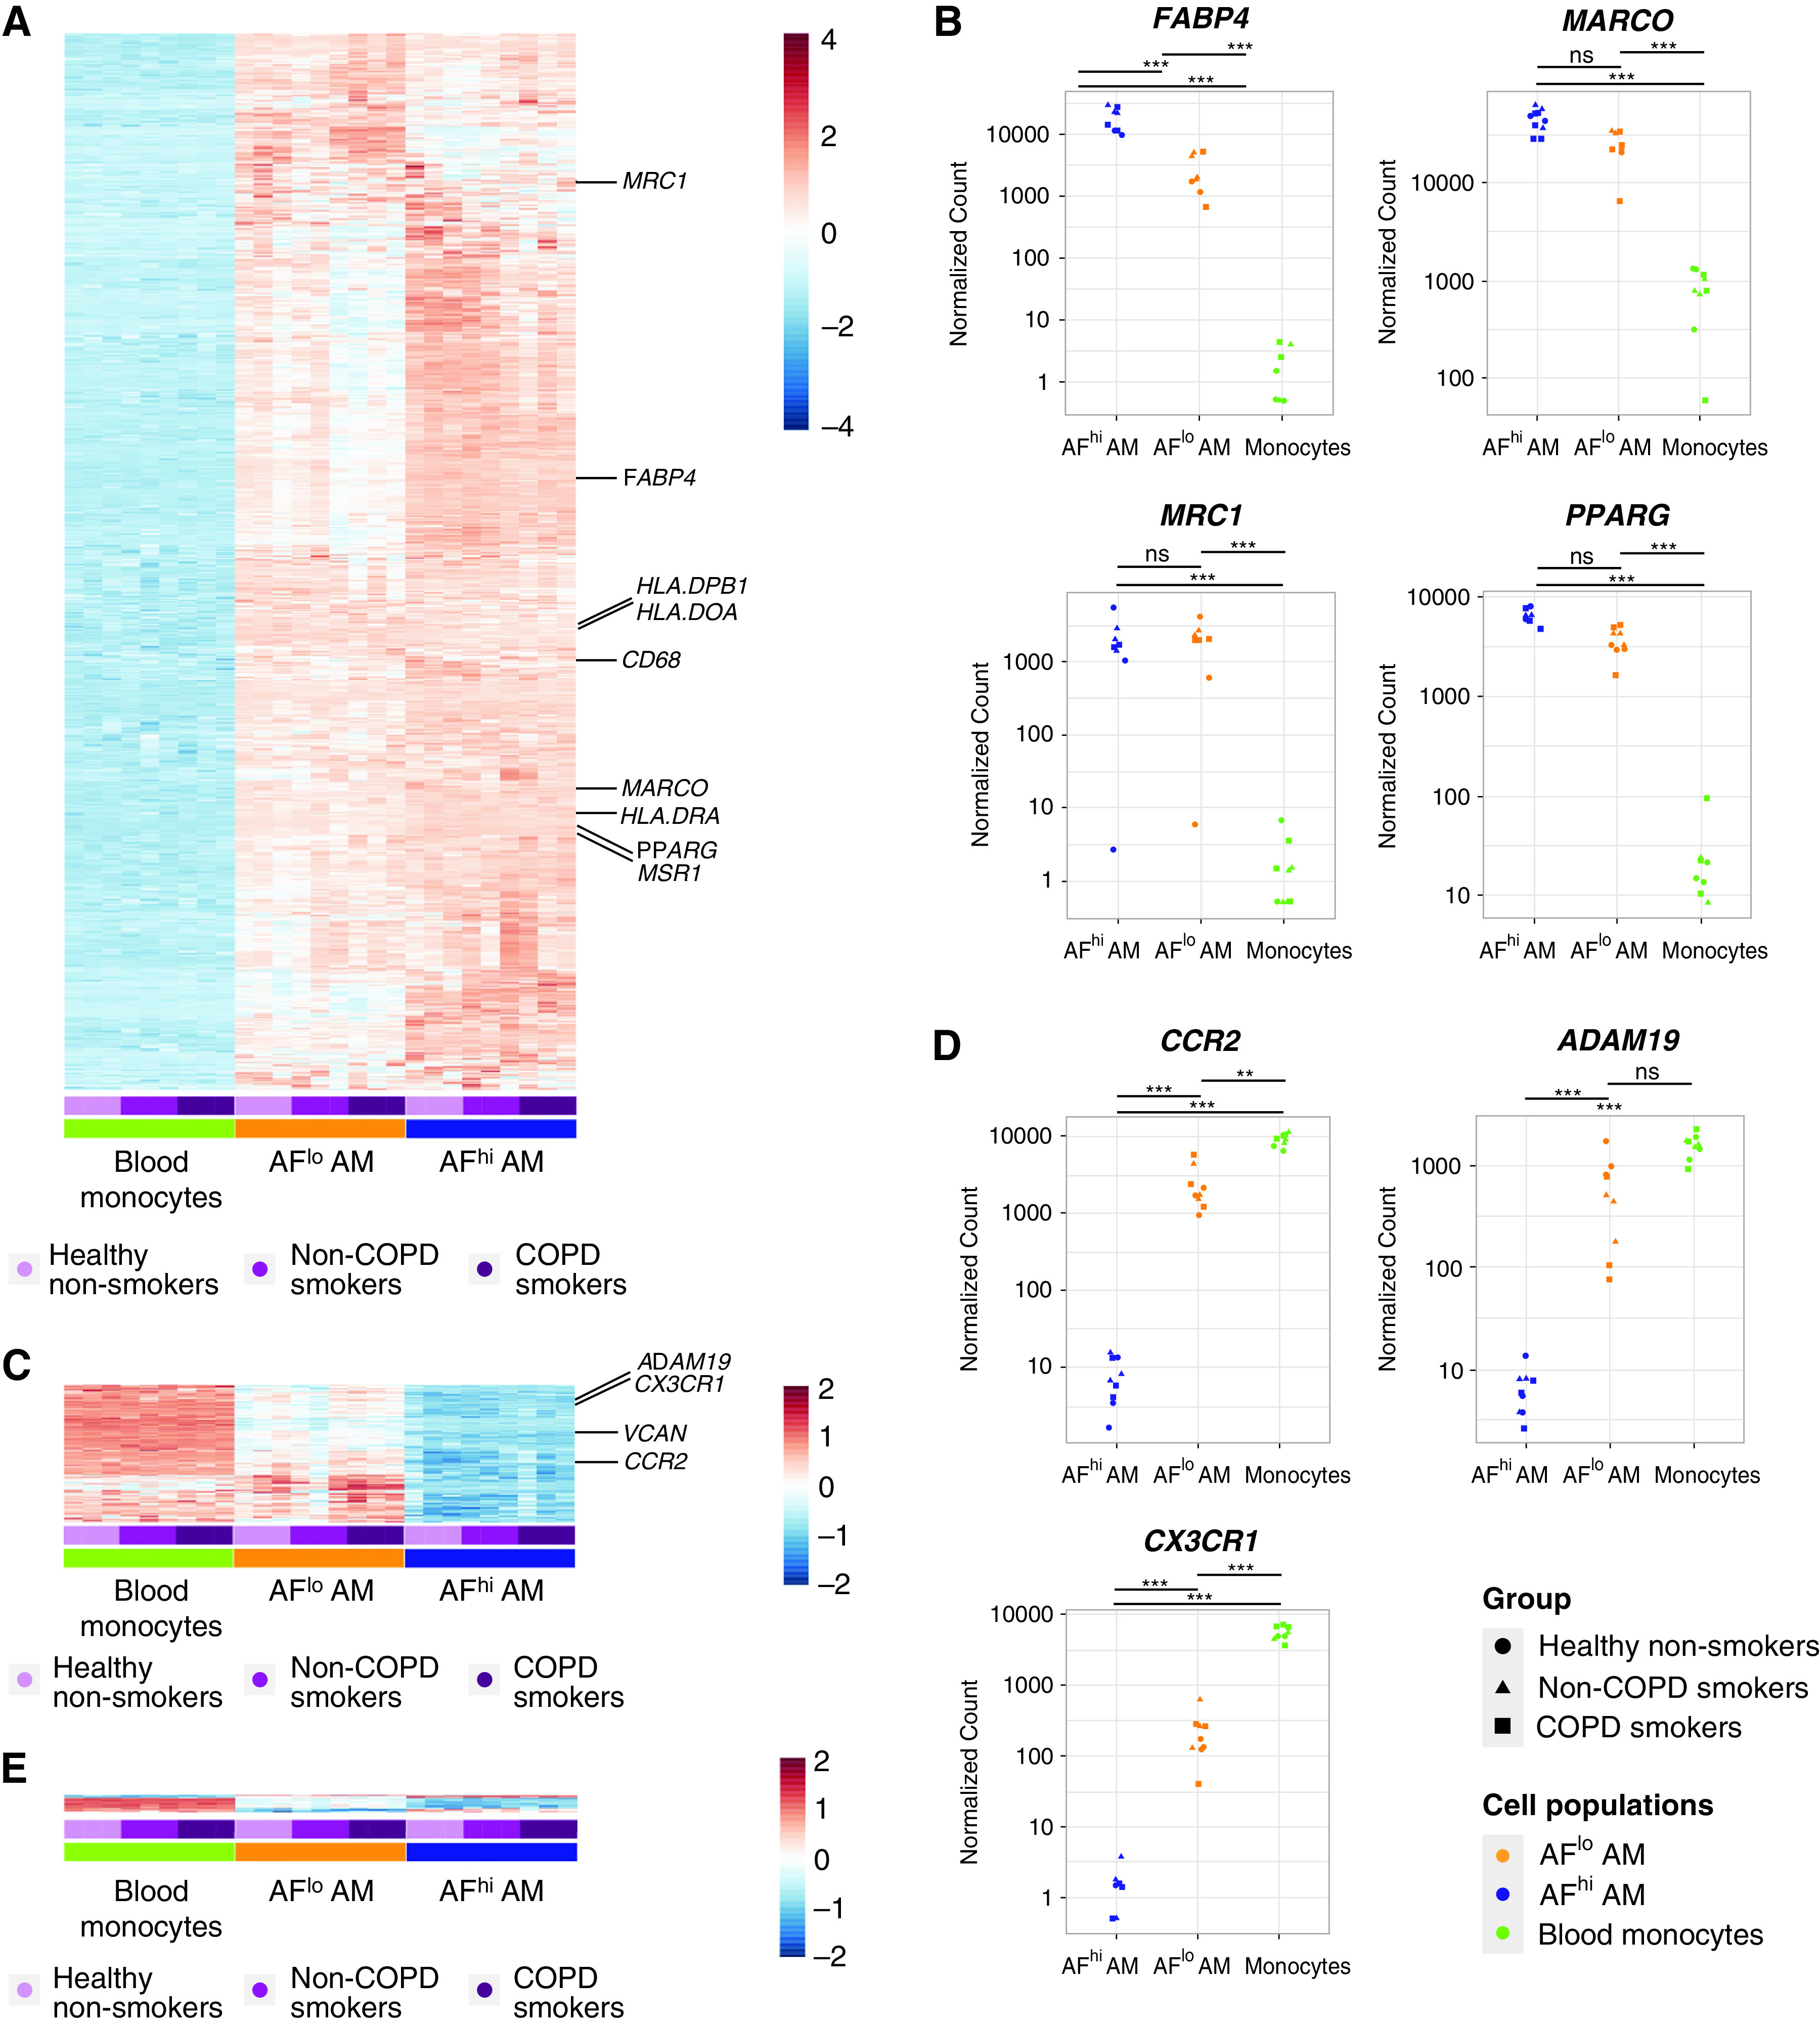
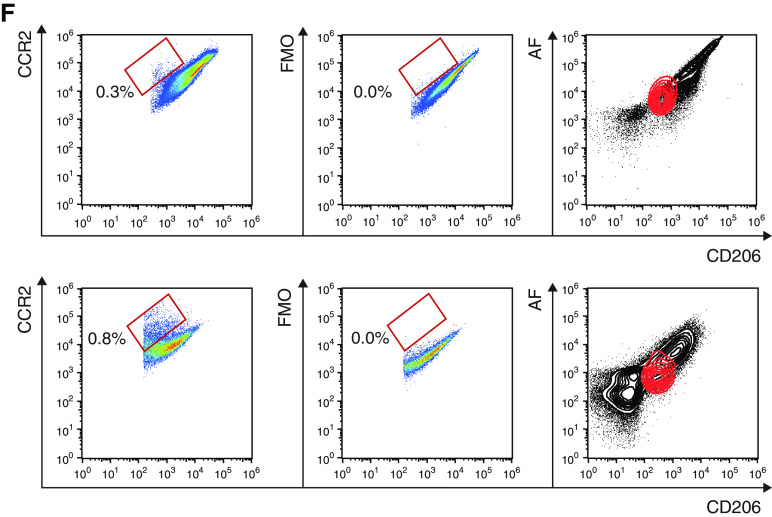
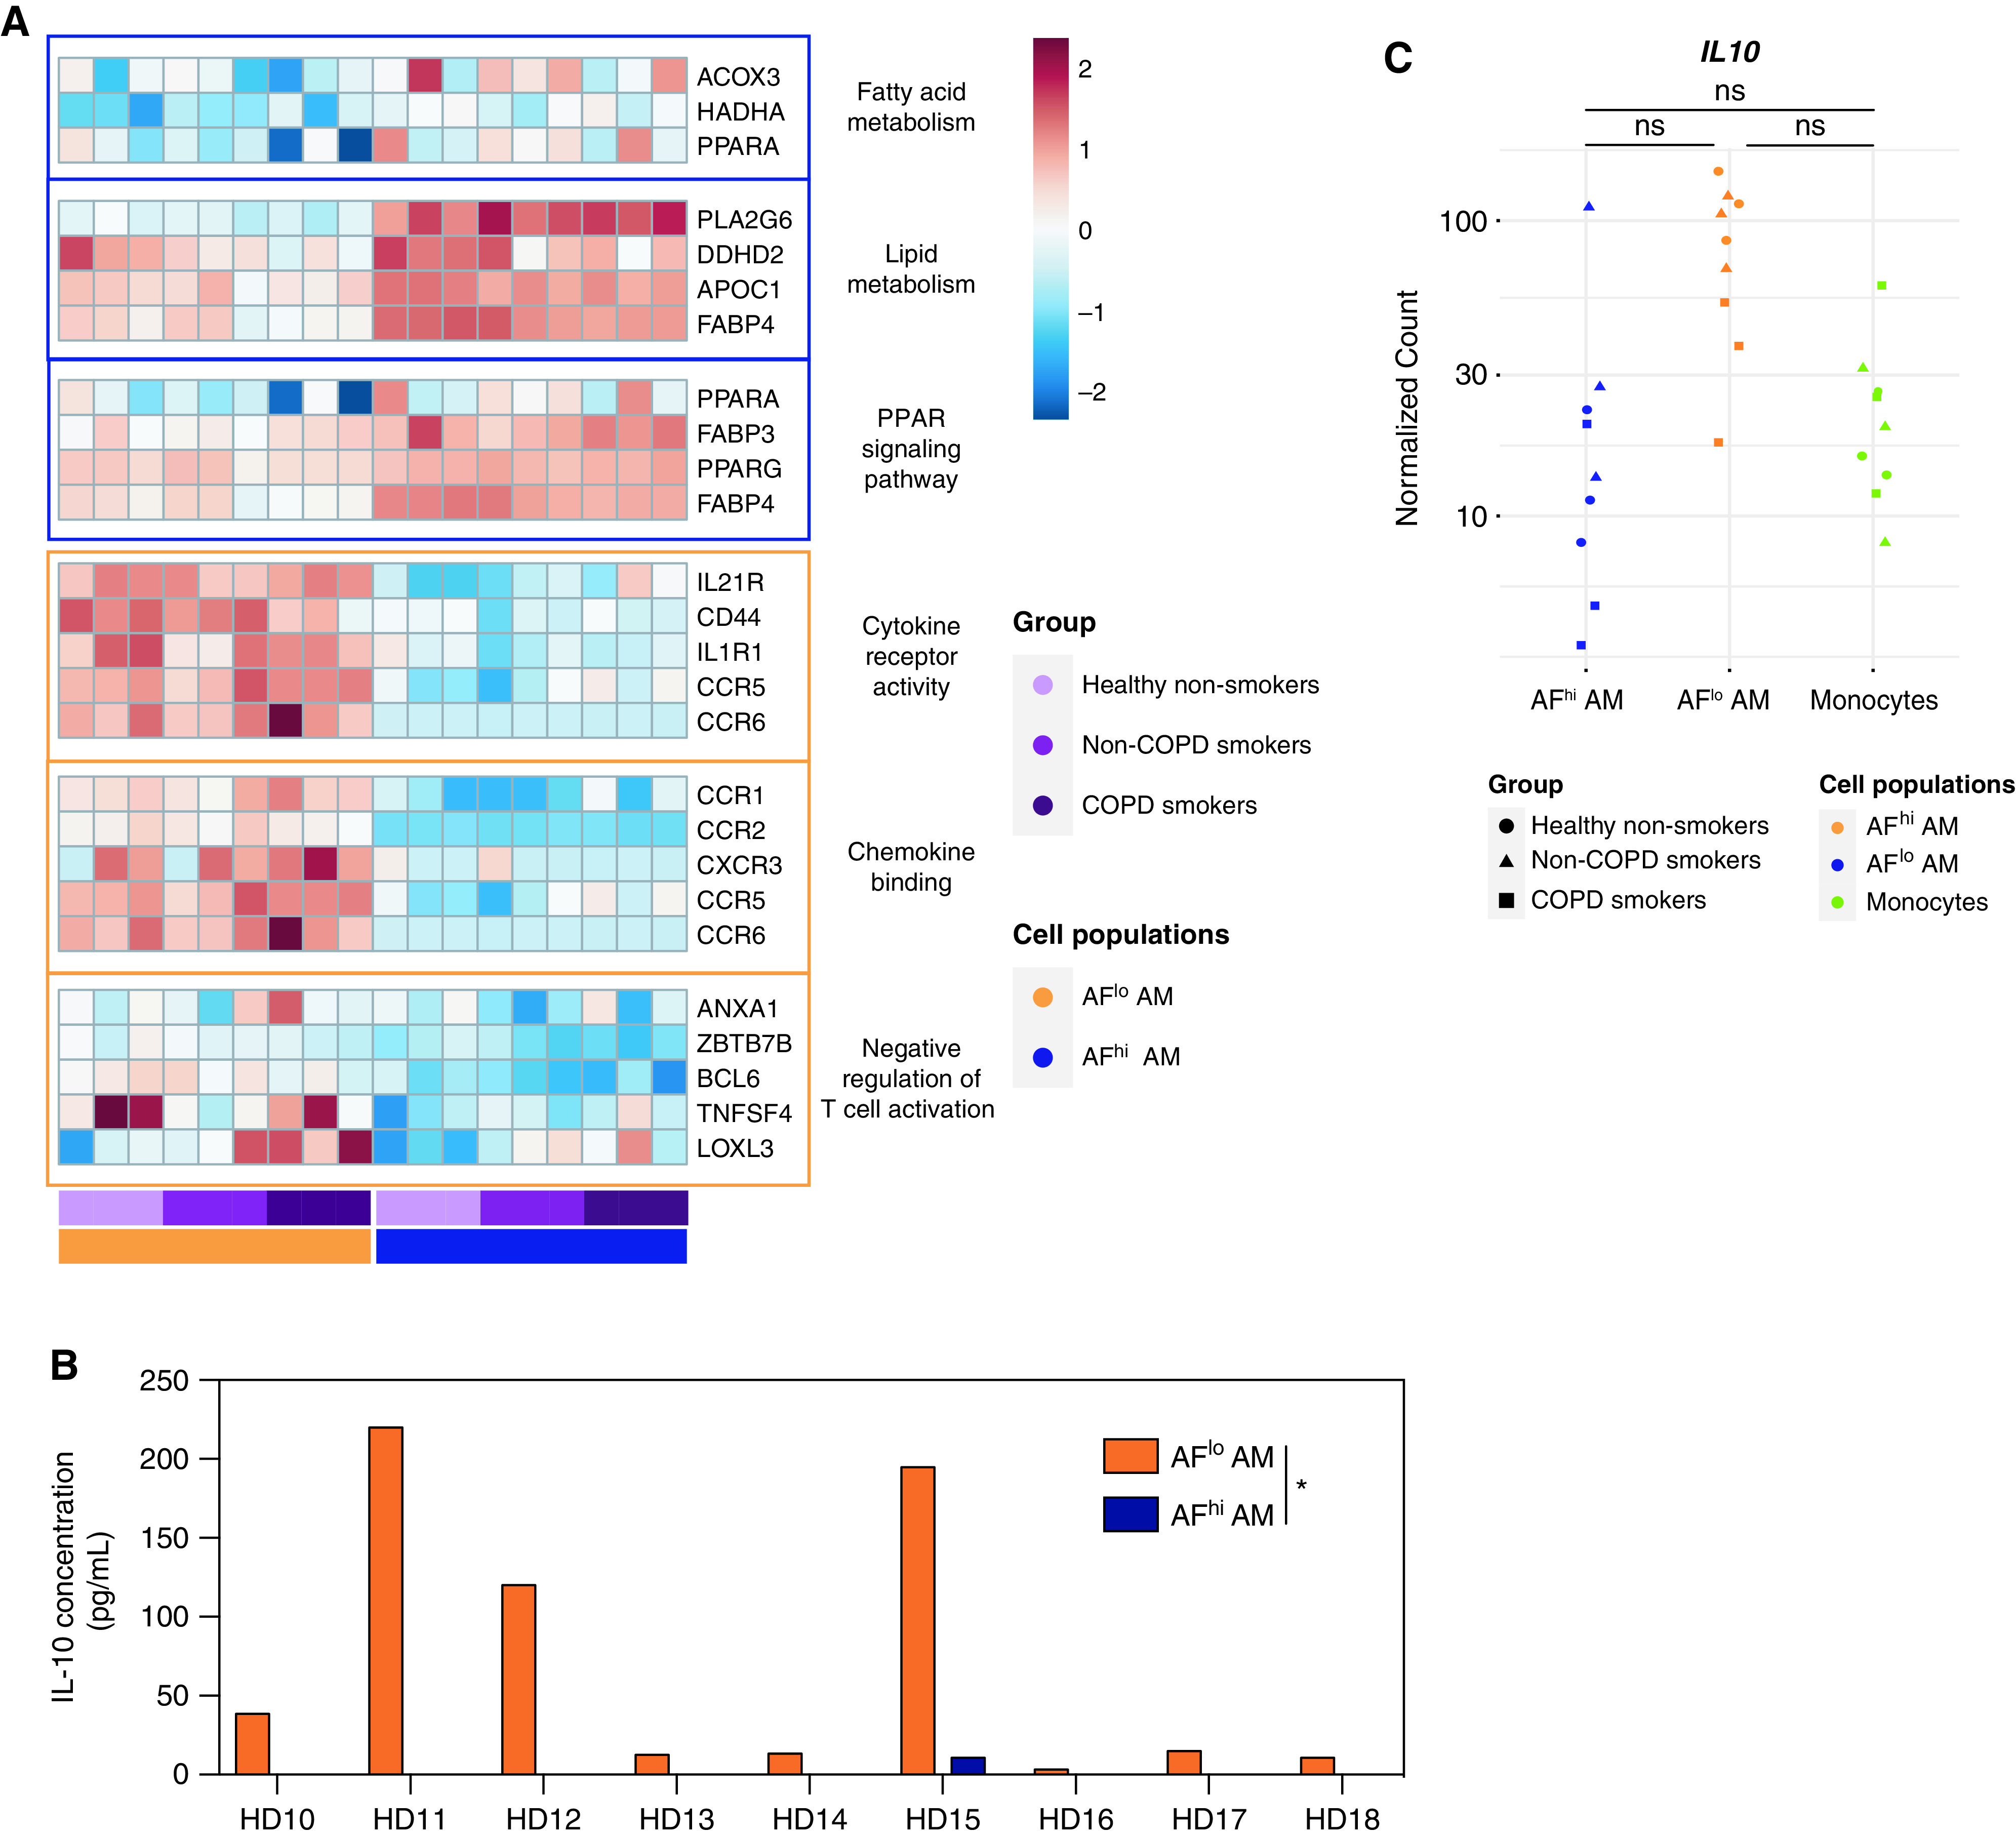
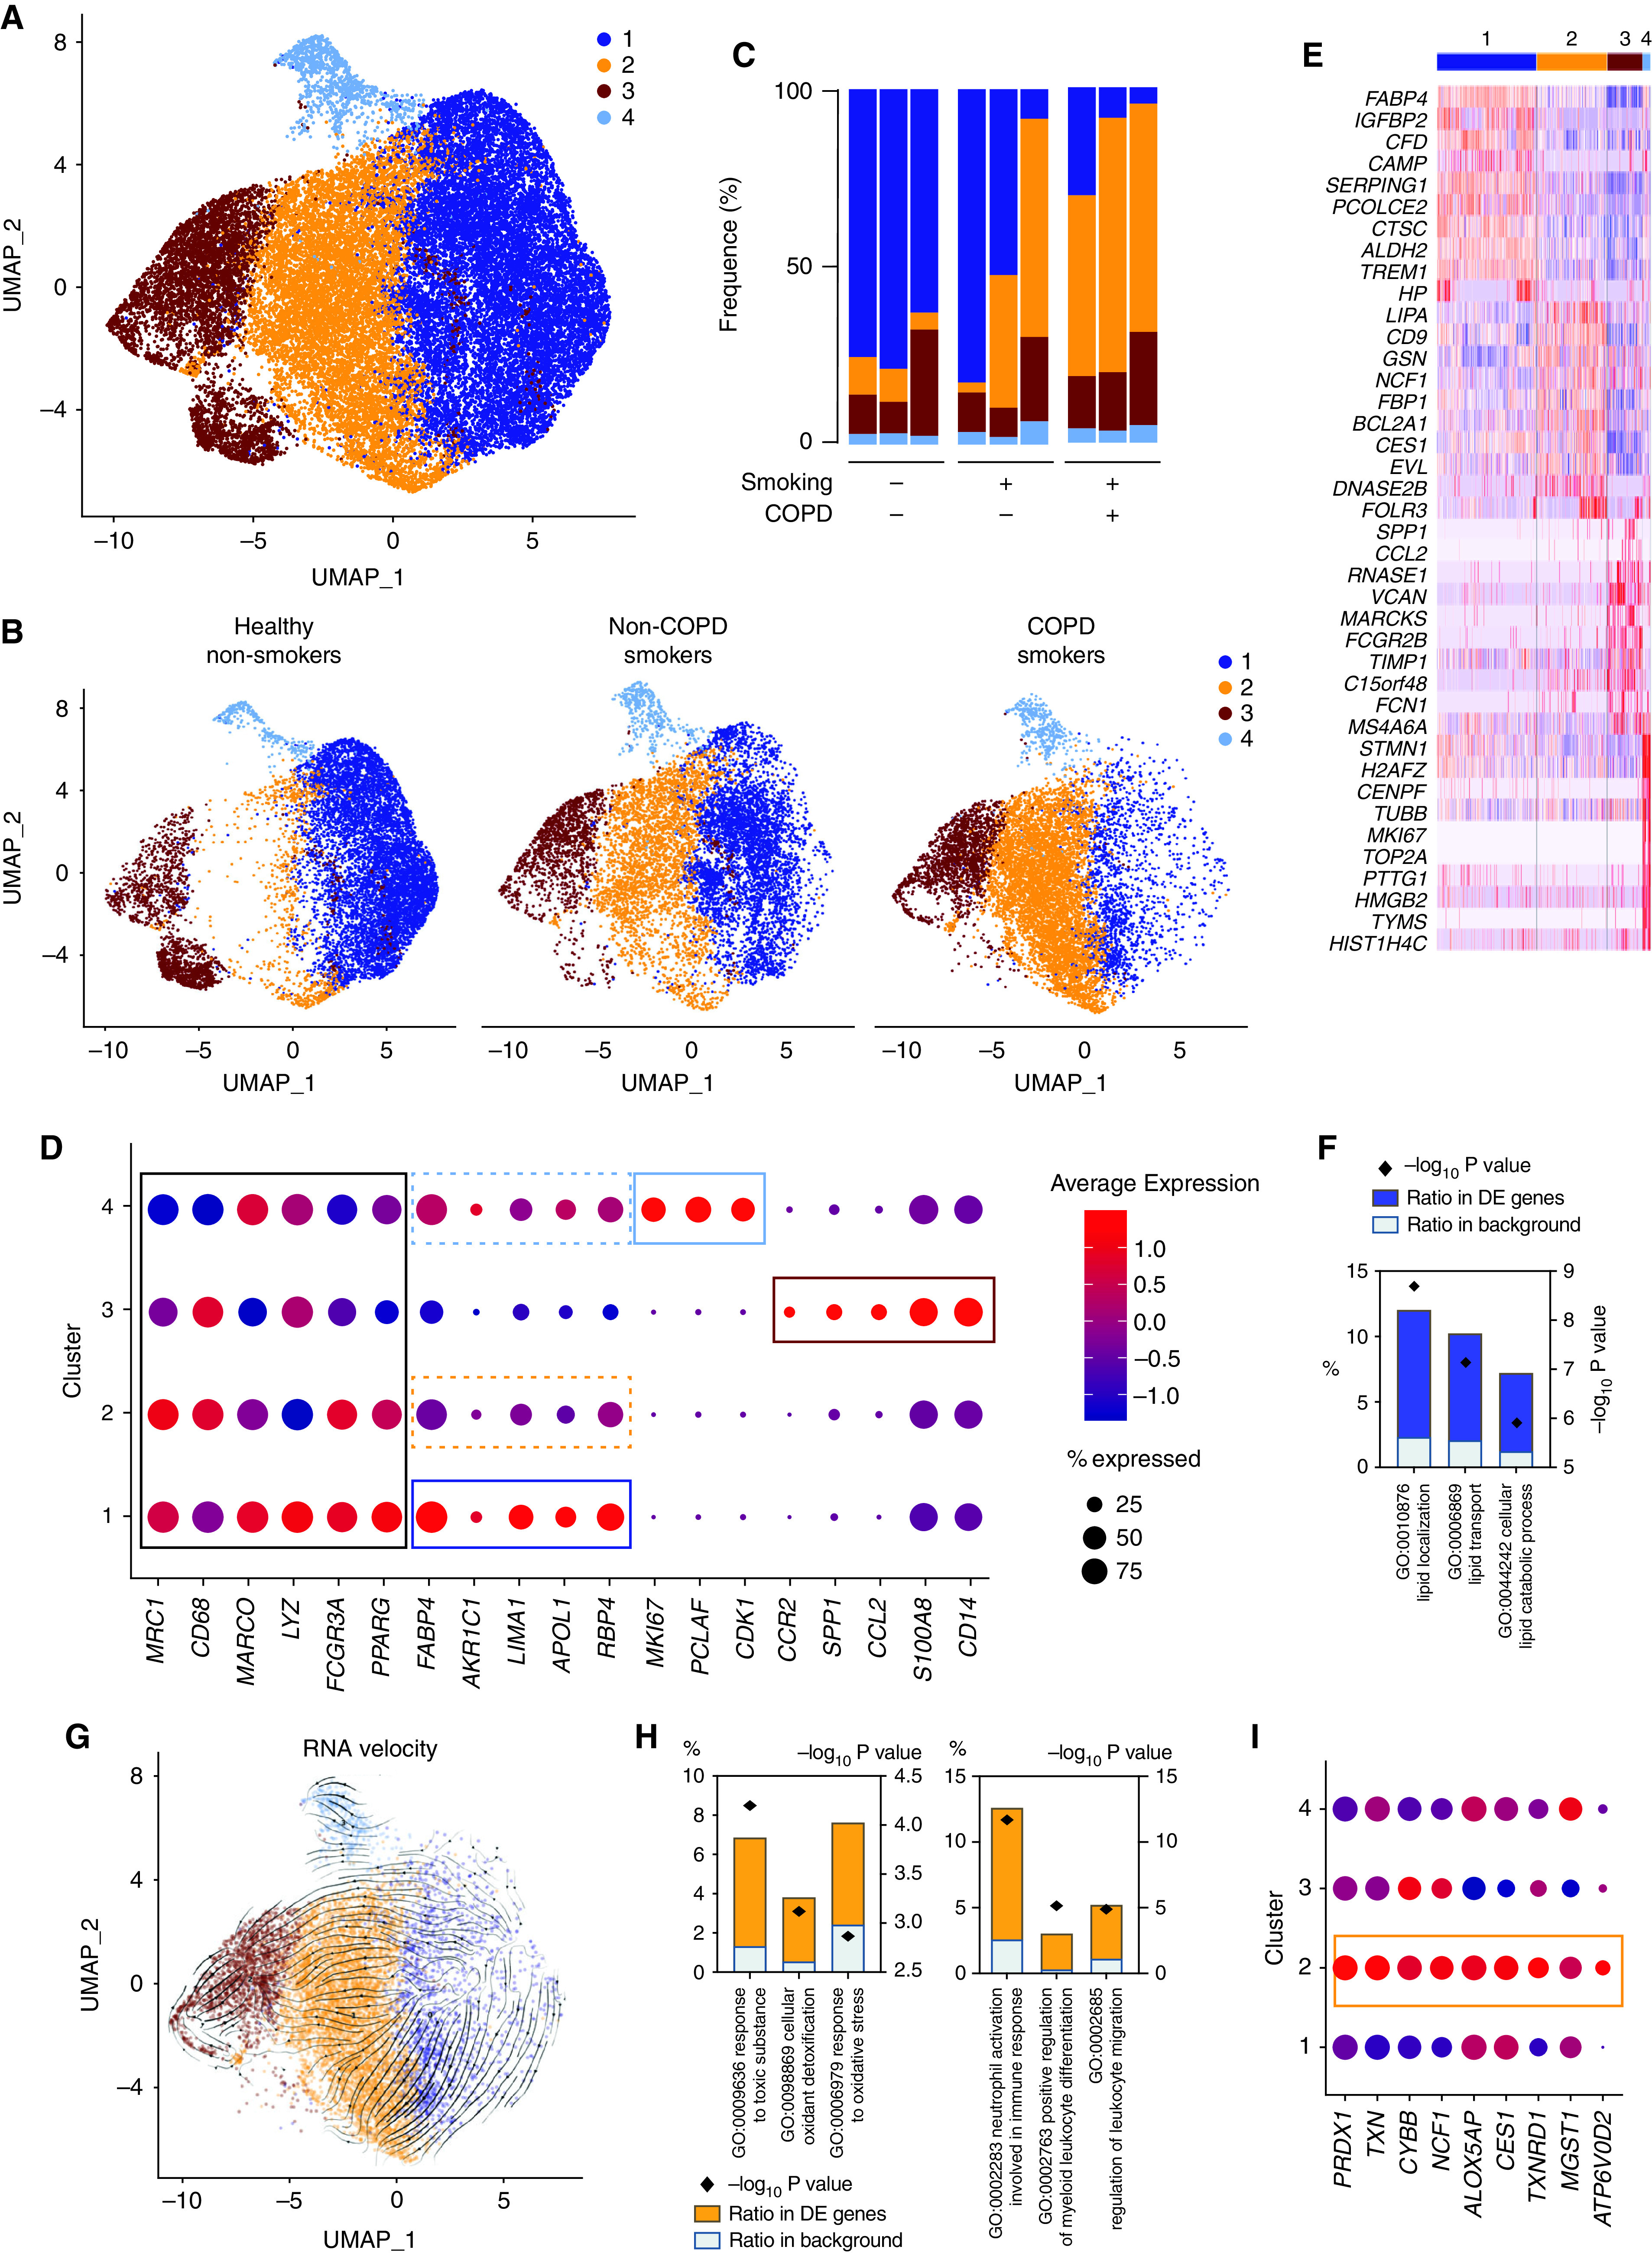
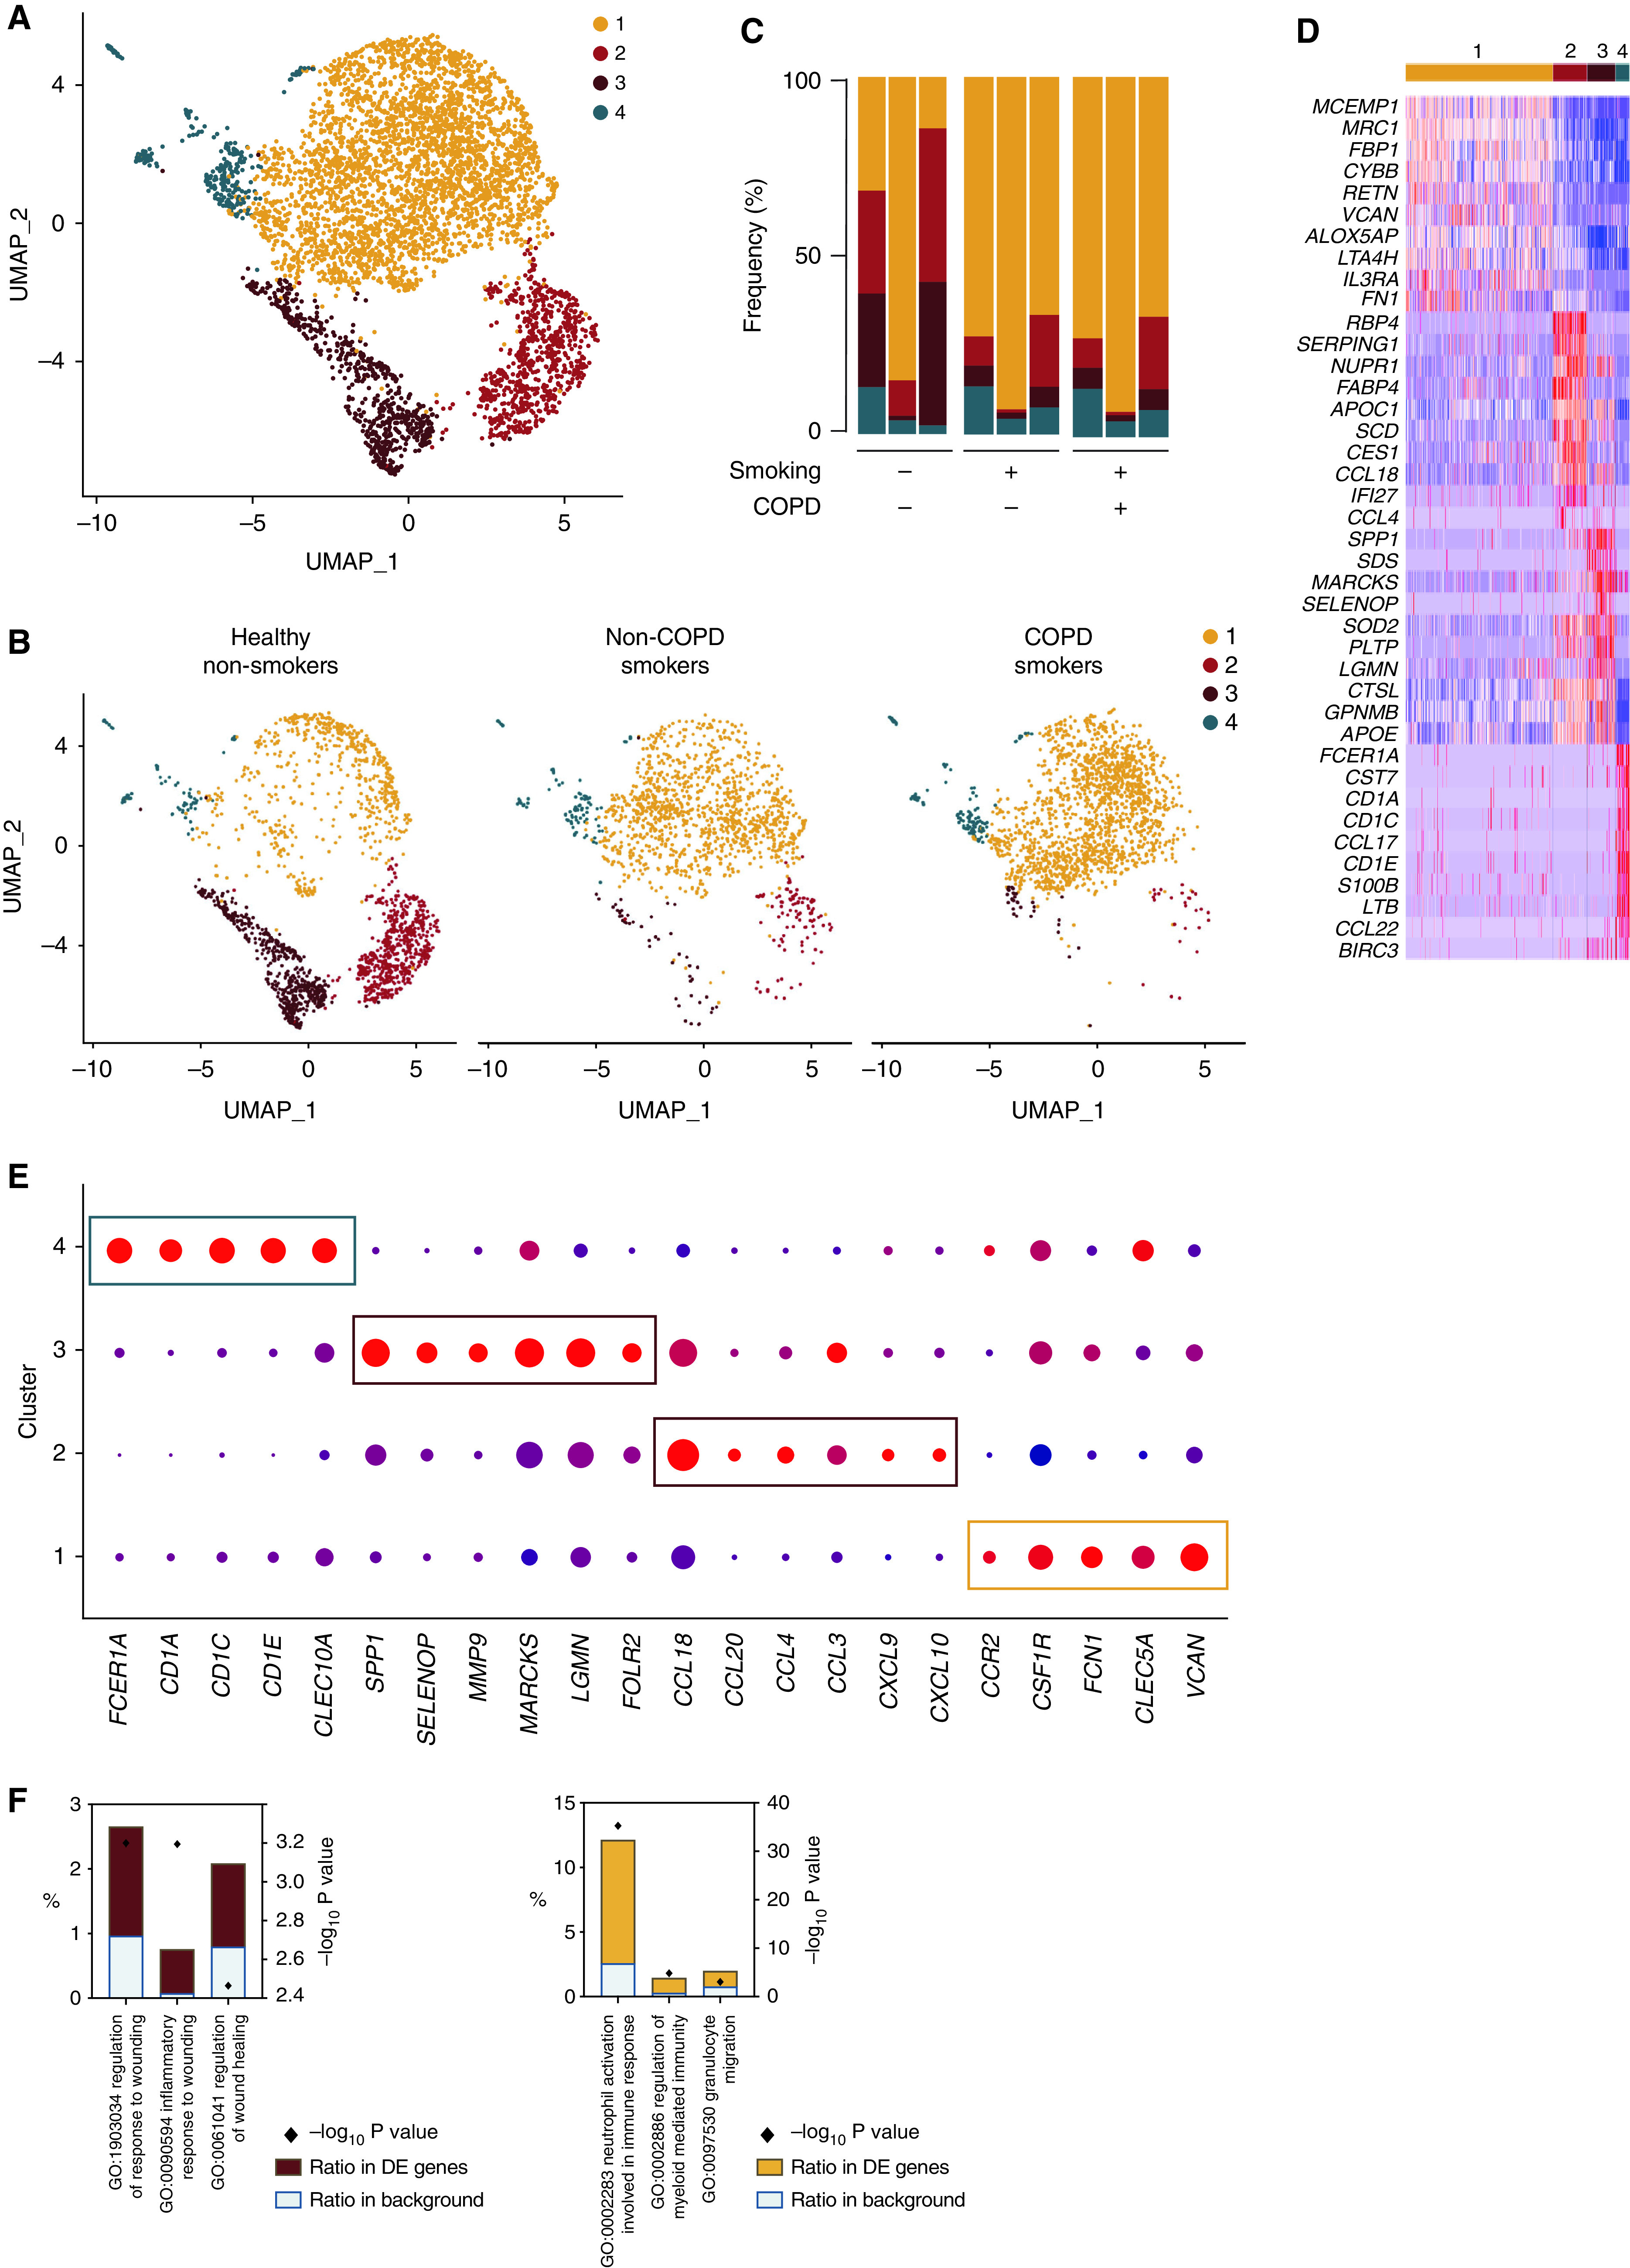
Alveolar macrophages (AMs) are functionally important innate cells involved in lung homeostasis and immunity and whose diversity in health and disease is a subject of intense investigations. Yet, it remains unclear to what extent conditions like smoking or chronic obstructive pulmonary disease (COPD) trigger changes in the AM compartment. Here, we aimed to explore heterogeneity of human AMs isolated from healthy nonsmokers, smokers without COPD, and smokers with COPD by analyzing BAL fluid cells by flow cytometry and bulk and single-cell RNA sequencing. We found that subpopulations of BAL fluid CD206+ macrophages could be distinguished based on their degree of autofluorescence in each subject analyzed. CD206+ autofluorescenthigh AMs were identified as classical, self-proliferative AM, whereas autofluorescentlow AMs were expressing both monocyte and classical AM-related genes, supportive of a monocytic origin. Of note, monocyte-derived autofluorescentlow AMs exhibited a functionally distinct immunoregulatory profile, including the ability to secrete the immunosuppressive cytokine IL-10. Interestingly, single-cell RNA-sequencing analyses showed that transcriptionally distinct clusters of classical and monocyte-derived AM were uniquely enriched in smokers with and without COPD as compared with healthy nonsmokers. Of note, such smoking-associated clusters exhibited gene signatures enriched in detoxification, oxidative stress, and proinflammatory responses. Our study independently confirms previous reports supporting that monocyte-derived macrophages coexist with classical AM in the airways of healthy subjects and patients with COPD and identifies smoking-associated changes in the AM compartment that may favor COPD initiation or progression.

Keywords: COPD; airway macrophages; lung; single-cell and bulk RNA-seq; smoking.


Figures

Figure 1.
Figure 1.
Alveolar macrophages (AMs) collected by BAL encompass small autofluorescentlow (AFlo) and large autofluorescenthigh (AFhi) CD206+ macrophages. (A) Representative flow cytometry gating strategy to delineate BAL fluid (BALF) CD206+ AFlo (orange box) and AFhi (blue box) macrophages. (B) Representative side scatter (SSC) versus forward scatter (FSC) plot depicting AFlo (orange) and AFhi (blue) macrophages. (C) Quantification of the size of AFlo and AFhi AMs. (D) Representative photographs of FACS-sorted AFlo and AFhi AMs. (A, B, and D) Data are representative of 1 of more than 10 experiments, each showing similar results. (C) Data show mean + SEM, as well as individual cells (n = 10 donors, 2–8 cells per donor). P values were calculated using a two-tailed paired Student’s t test. Scale bars = 32 μm.
Figure 2.
Figure 2.
Bulk RNA-sequencing (RNAseq) of blood monocytes and AFlo and AFhi AMs reveals conserved cell type–specific signatures that are independent of the health status. (A) Experimental pipeline for bulk and single-cell RNAseq. (B) Flow cytometry plots depicting AF versus CD206 expression of BALF singlet CD45+ cells collected from the healthy nonsmokers (n = 3), smokers without chronic obstructive pulmonary disease (COPD) (n = 3) and smokers with COPD (n = 3) included in this study. The orange and blue boxes indicate the gating used for FACS sorting of AFlo and AFhi AMs before bulk RNAseq. (C) Two-dimensional principal component (PC) analysis comparing blood monocytes, BALF AFlo and AFhi AMs in the indicated groups of individuals. Percentages indicate the variability explained by each compartment. (D) Unsupervised hierarchical clustering of the biological samples analyzed. The color scale reflects the clustering distance (0 = highest correlation; 150 = the lowest correlation) between the transcriptomic profiles of each biological sample. (E) Summary of differentially expressed (DE) genes (P < 0.05; fold change > 2) in the indicated pairwise comparisons showing significant DE genes in color in the volcano plots and the total numbers of upregulated genes in the bidirectional arrows.
Figure 3.
Figure 3.
AFlo AMs share both AM- and monocyte-associated transcriptional signatures. (A) Heatmap depicting the list of significant DE genes jointly upregulated in AFlo or AFhi AMs as compared with blood monocytes. (B) Individual expression, shown as normalized counts, of the indicated genes within the indicated cell populations. (C) Heatmap depicting the list of significant DE genes commonly upregulated in blood monocytes or AFlo AMs as compared with AFhi AMs. (D) Individual expression, shown as normalized counts, of the indicated genes within the indicated cell populations. (E) Heatmap depicting the list of significant DE genes commonly upregulated in blood monocytes or AFhi AMs as compared with AFlo AMs. (F) CCR2 protein expression on BALF CD45+CD206+ macrophages (HD20 and HD21) (see Table E1). Representative flow cytometry plots showing CCR2 versus CD206 expression on BALF macrophages stained with (left) an anti-CCR2 or (center) FMO. Inserts indicated % of CCR2+ cells in the parent gate; (right) flow cytometry plots showing AF versus CD206 expression on total BALF CD45+ cells (gray) or CCR2+ macrophages (red). (B and D) P adjusted values are shown and were estimated thanks to the DESeq2 package. AF, auto-fluorescent; DE, differentially expressed; FMO = fluorescence minus one; HD = human donor; ns = nonsignificant. **P < 0.01 and ***P < 0.001.
Figure 3.
Figure 3.
AFlo AMs share both AM- and monocyte-associated transcriptional signatures. (A) Heatmap depicting the list of significant DE genes jointly upregulated in AFlo or AFhi AMs as compared with blood monocytes. (B) Individual expression, shown as normalized counts, of the indicated genes within the indicated cell populations. (C) Heatmap depicting the list of significant DE genes commonly upregulated in blood monocytes or AFlo AMs as compared with AFhi AMs. (D) Individual expression, shown as normalized counts, of the indicated genes within the indicated cell populations. (E) Heatmap depicting the list of significant DE genes commonly upregulated in blood monocytes or AFhi AMs as compared with AFlo AMs. (F) CCR2 protein expression on BALF CD45+CD206+ macrophages (HD20 and HD21) (see Table E1). Representative flow cytometry plots showing CCR2 versus CD206 expression on BALF macrophages stained with (left) an anti-CCR2 or (center) FMO. Inserts indicated % of CCR2+ cells in the parent gate; (right) flow cytometry plots showing AF versus CD206 expression on total BALF CD45+ cells (gray) or CCR2+ macrophages (red). (B and D) P adjusted values are shown and were estimated thanks to the DESeq2 package. AF, auto-fluorescent; DE, differentially expressed; FMO = fluorescence minus one; HD = human donor; ns = nonsignificant. **P < 0.01 and ***P < 0.001.
Figure 4.
Figure 4.
Monocyte-derived AFlo AMs are functionally distinct from classical AFhi AMs. (A) Heatmaps showing expression of the indicated genes involved in the biological responses that were found to be enriched in AFhi and AFlo AMs analyzed by gene set enrichment analysis (also see Table E3). (B) IL-10 concentrations measured by ELISA in culture supernatant of FACS-sorted AFlo and AFhi AMs from nine patients (HD1 to HD9) (Table E1). (C) Individual expression, shown as normalized counts, of IL-10 gene within the indicated cell populations. Data show individual mean values from technical duplicates. P values were calculated using a two-way ANOVA. *P < 0.05.
Figure 5.
Figure 5.
BALF myeloid cell heterogeneity revealed by single-cell (sc) RNAseq analyses. (A) Uniform manifold approximation and projection (UMAP) plot depicting BALF myeloid cells from the merged biological samples. (B) UMAP plots depicting BALF myeloid cells isolated from healthy nonsmokers (left), smokers without COPD (middle), and smokers with COPD (right). (C) Histogram showing percentage of each cluster within individual samples. (D) Dot plots showing average expression and percentage of cells expressing the indicated genes within cell clusters. (E) Heatmap depicting the 10 most upregulated genes in each cluster. (F) Histograms showing results of gene ontology (GO) enrichment tests for the upregulated genes in cluster 1 as compared with the other clusters. (G) Patterns of RNA velocities of single cells from smokers with COPD substantiated by arrows visualized on the UMAP plot. (H) Histograms showing results of GO enrichment tests for the upregulated genes in cluster 2 as compared with cluster 1. (I) Dot plots showing average expression and percentage of cells expressing the indicated genes within cell clusters.
Figure 6.
Figure 6.
Heterogeneity of BALF monocyte-derived macrophage analyzed by scRNAseq. (A) UMAP plot depicting BALF monocyte-derived macrophage (i.e., cluster 3 of Figure 5A) from the merged biological samples. (B) UMAP plots depicting BALF monocyte-derived macrophage isolated from healthy nonsmokers (left), smokers without COPD (middle), and smokers with COPD (right). (C) Histogram showing percentage of each cluster within individual samples. (D) Heatmap depicting the 10 most upregulated genes in each cluster. (E) Dot plots showing average expression and percentage of cells expressing the indicated genes within cell clusters. (F) Histograms showing results of GO enrichment tests for the upregulated genes in clusters 3 (left) and 1 (right) as compared with the other clusters.

Comment in

References

    1. Hussell T, Bell TJ. Alveolar macrophages: plasticity in a tissue-specific context. Nat Rev Immunol . 2014;14:81–93. - PubMed
    1. Kulikauskaite J, Wack A. Teaching old dogs new tricks? The plasticity of lung alveolar macrophage subsets. Trends Immunol . 2020;41:864–877. - PMC - PubMed
    1. Blériot C, Chakarov S, Ginhoux F. Determinants of resident tissue macrophage identity and function. Immunity . 2020;52:957–970. - PubMed
    1. Trapnell BC, Carey BC, Uchida K, Suzuki T. Pulmonary alveolar proteinosis, a primary immunodeficiency of impaired GM-CSF stimulation of macrophages. Curr Opin Immunol . 2009;21:514–521. - PMC - PubMed
    1. Morales-Nebreda L, Misharin AV, Perlman H, Budinger GRS. The heterogeneity of lung macrophages in the susceptibility to disease. Eur Respir Rev . 2015;24:505–509. - PMC - PubMed

Publication types