

Alpha-Smooth Muscle Actin Expression and Parafoveal Blood Flow Pathways Are Altered in Preclinical Diabetic Retinopathy
- PMID: 35522303
- PMCID: PMC9078056
- DOI: 10.1167/iovs.63.5.8
Alpha-Smooth Muscle Actin Expression and Parafoveal Blood Flow Pathways Are Altered in Preclinical Diabetic Retinopathy
Abstract
Purpose: To investigate differences in alpha smooth muscle actin (αSMA) expression and parafoveal blood flow pathways in diabetic retinopathy (DR).
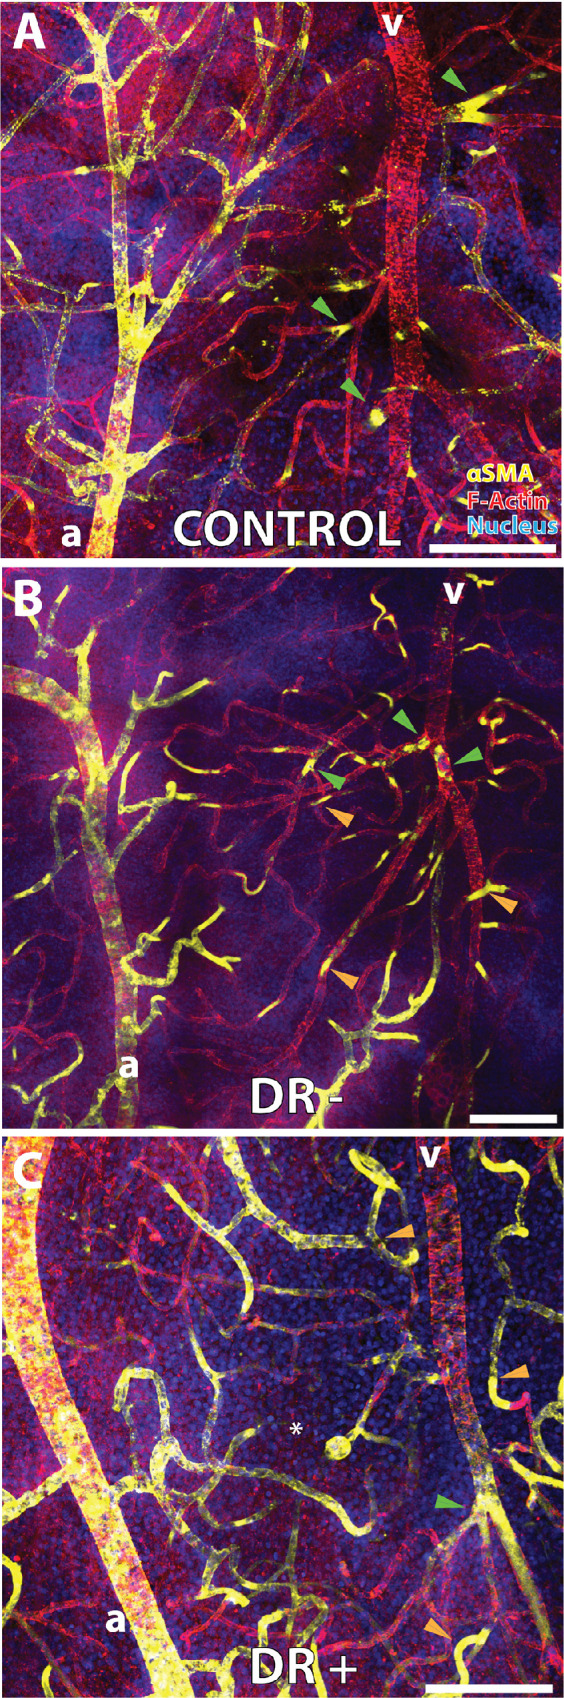
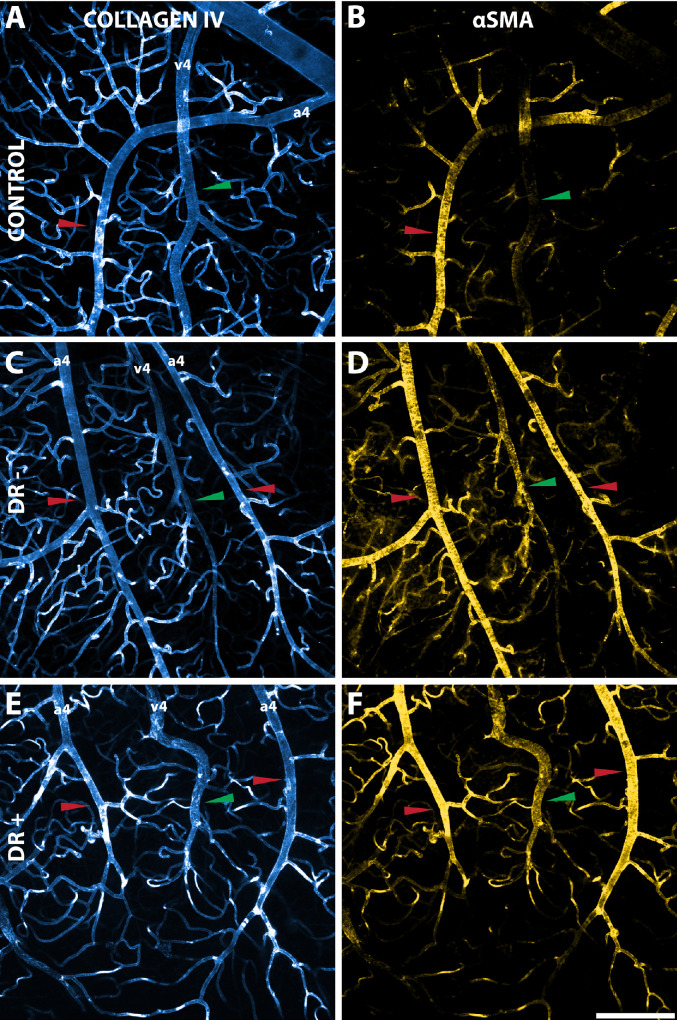
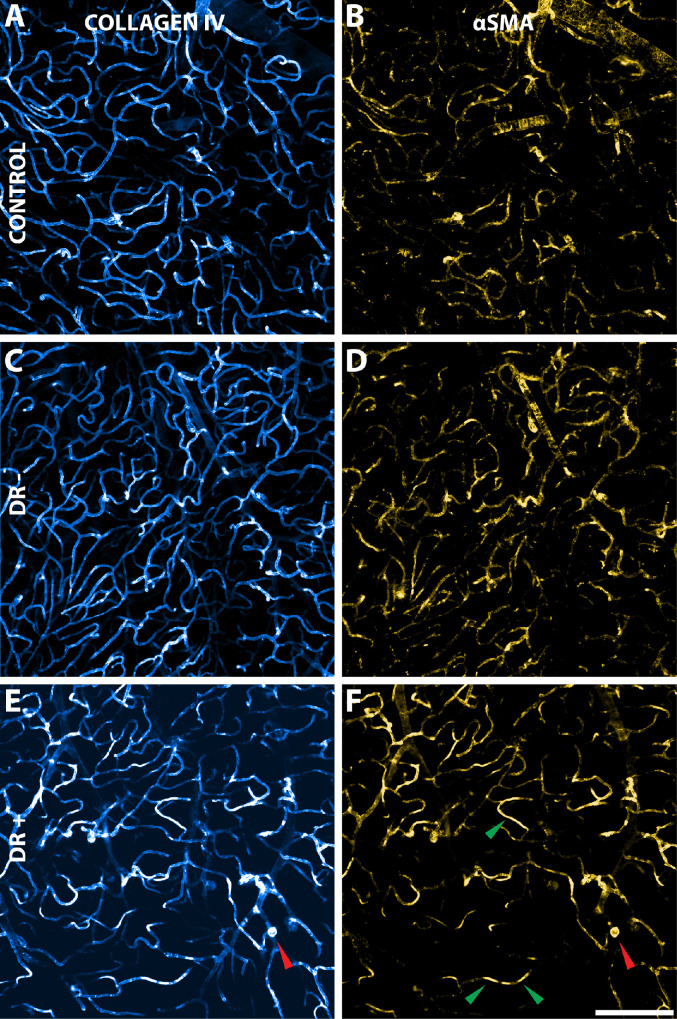
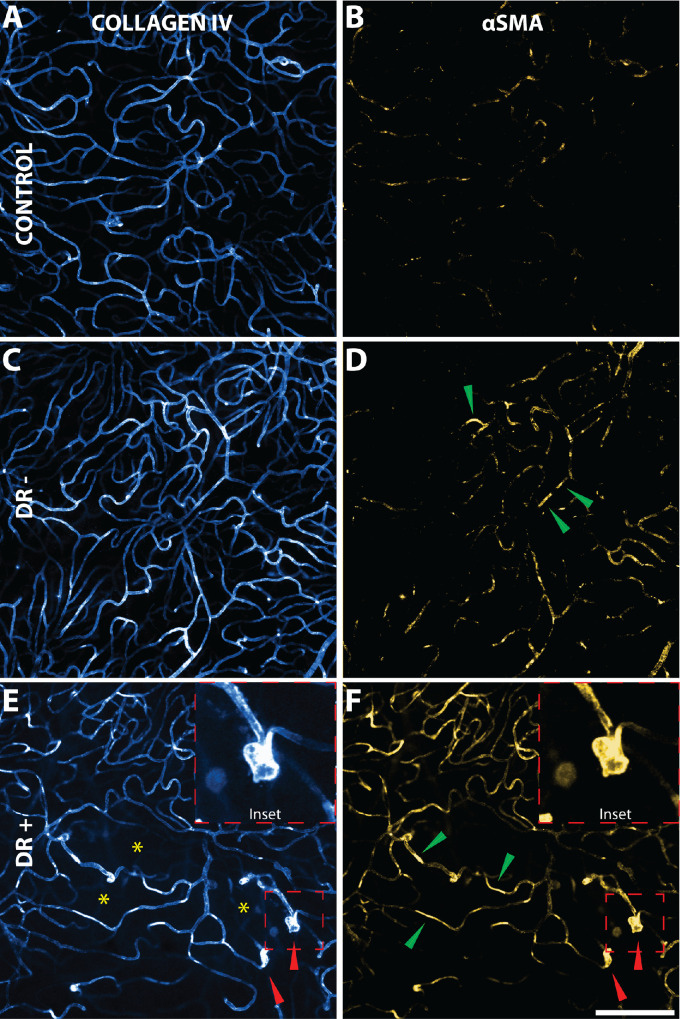
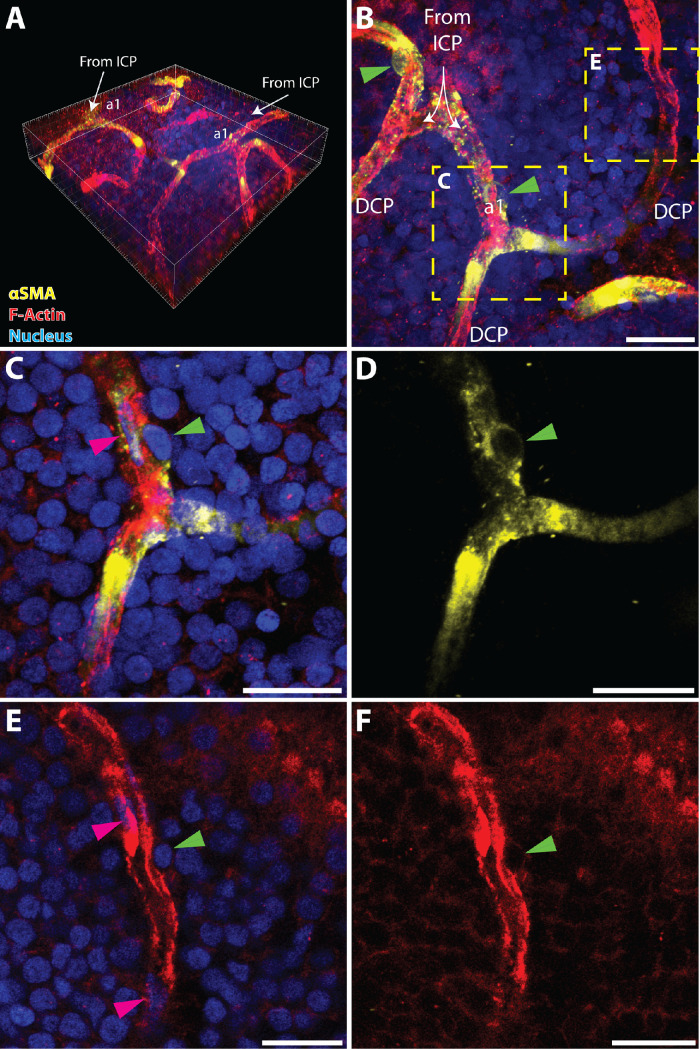
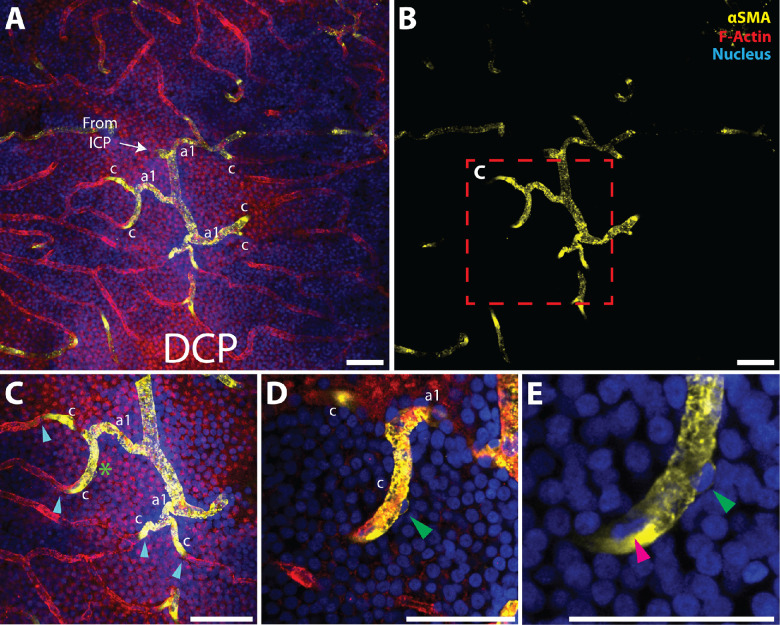
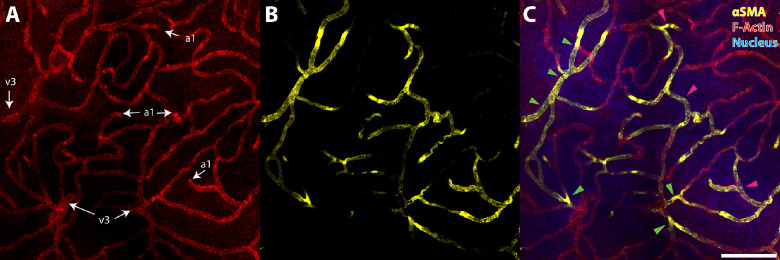
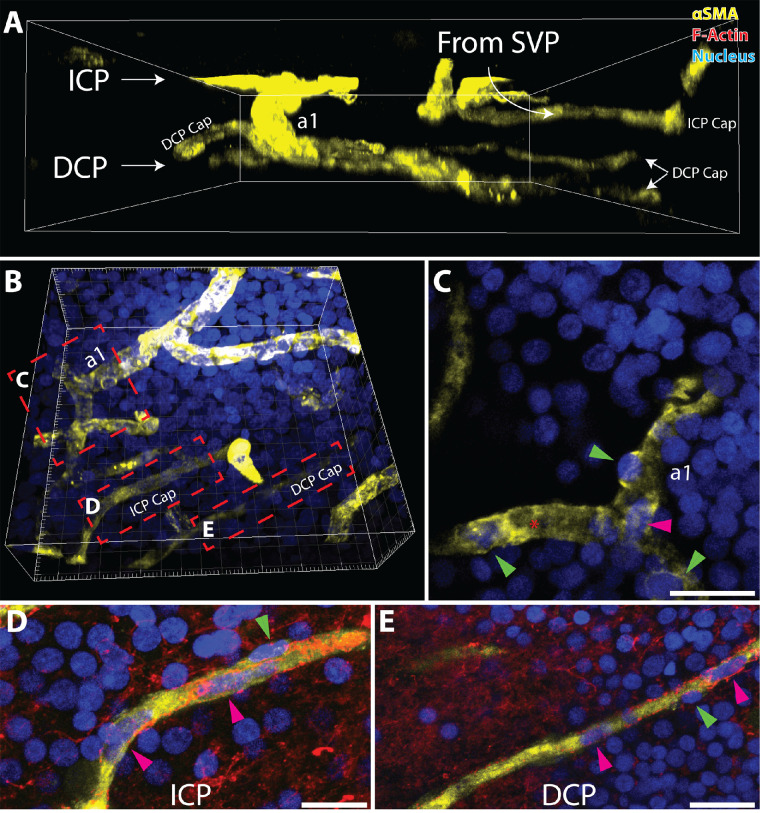
Methods: Human donor eyes from healthy subjects (n = 8), patients with diabetes but no DR (DR-; n = 7), and patients with clinical DR (DR+; n = 13) were perfusion labeled with antibodies targeting αSMA, lectin, collagen IV, and filamentous actin. High-resolution confocal scanning laser microscopy was used to quantify αSMA staining and capillary density in the parafoveal circulation. Quantitative analyses of connections between retinal arteries and veins within the superficial vascular plexus (SVP), intermediate capillary plexus (ICP) and deep capillary plexus (DCP) were performed.
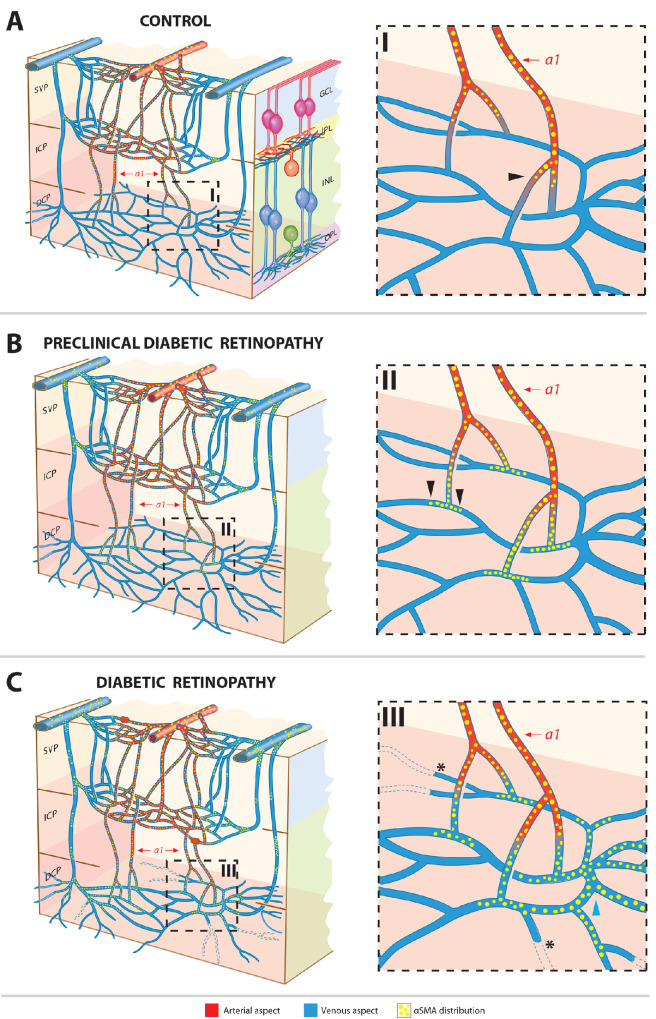
Results: Mean age between the groups was not different (P = 0.979). αSMA staining was seen in the SVP and ICP of all groups. The DCP was predominantly devoid of αSMA staining in control eyes but increased in a disease stage-specific manner in the DR- and DR+ groups. The increase in αSMA staining was localized to pericytes and endothelia of terminal arterioles and adjacent capillary segments. Capillary density was less in the DCP in the DR+ group (P < 0.001). ICP of the DR- and DR+ groups received more direct arteriole supplies than the control group (P < 0.001). Venous outflow pathways were not altered (all P > 0.284).
Conclusions: Alterations in αSMA and vascular inflow pathways in preclinical DR suggest that perfusion abnormalities precede structural vascular changes such as capillary loss. Preclinical DR may be characterized by a "steal" phenomenon where blood flow is preferentially diverted from the SVP to the ICP and DCP.
Conflict of interest statement
Disclosure:
Figures
Similar articles
-
Three-Dimensional Characterization of the Normal Human Parafoveal Microvasculature Using Structural Criteria and High-Resolution Confocal Microscopy.Invest Ophthalmol Vis Sci. 2020 Aug 3;61(10):3. doi: 10.1167/iovs.61.10.3. Invest Ophthalmol Vis Sci. 2020. PMID: 32749461 Free PMC article.
-
Optical coherence tomography angiography discerns preclinical diabetic retinopathy in eyes of patients with type 2 diabetes without clinical diabetic retinopathy.Acta Diabetol. 2018 May;55(5):469-477. doi: 10.1007/s00592-018-1115-1. Epub 2018 Feb 16. Acta Diabetol. 2018. PMID: 29453673
-
Interaction Between the Distribution of Diabetic Retinopathy Lesions and the Association of Optical Coherence Tomography Angiography Scans With Diabetic Retinopathy Severity.JAMA Ophthalmol. 2020 Dec 1;138(12):1291-1297. doi: 10.1001/jamaophthalmol.2020.4516. JAMA Ophthalmol. 2020. PMID: 33119083 Free PMC article.
-
Early microvascular retinal changes in optical coherence tomography angiography in patients with type 1 diabetes mellitus.Acta Ophthalmol. 2017 Dec;95(8):e751-e755. doi: 10.1111/aos.13404. Epub 2017 Feb 16. Acta Ophthalmol. 2017. PMID: 28211261
-
Application of optical coherence tomography angiography in diabetic retinopathy: a comprehensive review.Can J Ophthalmol. 2019 Oct;54(5):519-528. doi: 10.1016/j.jcjo.2019.02.010. Epub 2019 Apr 8. Can J Ophthalmol. 2019. PMID: 31564340 Review.
Cited by
-
Endothelial function can be modulated by acute hyperglycemia.Sci Rep. 2025 Aug 20;15(1):30559. doi: 10.1038/s41598-025-12612-4. Sci Rep. 2025. PMID: 40835626 Free PMC article.
-
scAAV2-Mediated Expression of Thioredoxin 2 and C3 Transferase Prevents Retinal Ganglion Cell Death and Lowers Intraocular Pressure in a Mouse Model of Glaucoma.Int J Mol Sci. 2023 Nov 13;24(22):16253. doi: 10.3390/ijms242216253. Int J Mol Sci. 2023. PMID: 38003443 Free PMC article.
-
Interpericyte Tunneling Nanotubes Are Nonuniformly Distributed in the Human Macula.Invest Ophthalmol Vis Sci. 2024 Nov 4;65(13):28. doi: 10.1167/iovs.65.13.28. Invest Ophthalmol Vis Sci. 2024. PMID: 39540858 Free PMC article.
-
Predictors of Peripheral Retinal Non-Perfusion in Clinically Significant Diabetic Macular Edema.J Clin Med. 2024 Dec 26;14(1):52. doi: 10.3390/jcm14010052. J Clin Med. 2024. PMID: 39797135 Free PMC article.
-
Modulation of Extracellular Matrix Composition and Chronic Inflammation with Pirfenidone Promotes Scar Reduction in Retinal Wound Repair.Cells. 2024 Jan 16;13(2):164. doi: 10.3390/cells13020164. Cells. 2024. PMID: 38247855 Free PMC article.
References
-
- Yanoff M. Diabetic retinopathy. N Engl J Med. 1966; 274(24): 1344–1349. - PubMed
-
- Davis MD. Diabetic retinopathy. A clinical overview. Diabetes Care. 1992; 15(12): 1844–1874. - PubMed
-
- Frank RN. The galactosemic dog. A valid model for both early and late stages of diabetic retinopathy. Arch Ophthalmol. 1995; 113(3): 275–276. - PubMed
-
- Safi H, Safi S, Hafezi-Moghadam A, Ahmadieh H.. Early detection of diabetic retinopathy. Surv Ophthalmol. 2018; 63(5): 601–608. - PubMed
-
- Early Treatment Diabetic Retinopathy Study Research Group. Grading diabetic retinopathy from stereoscopic color fundus photographs–an extension of the modified Airlie House classification. ETDRS Report Number 10. Ophthalmology. 1991; 98(5 suppl): 786–806. - PubMed
Publication types
MeSH terms
Substances
LinkOut - more resources
Full Text Sources
Medical
Miscellaneous
