Meta-Analysis
. 2022 May 6;17(5):e0265411.
doi: 10.1371/journal.pone.0265411. eCollection 2022.

Knowledge, attitude and practice towards kangaroo mother care among postnatal women in Ethiopia: Systematic review and meta-analysis

Affiliations
Meta-Analysis

Knowledge, attitude and practice towards kangaroo mother care among postnatal women in Ethiopia: Systematic review and meta-analysis

Natnael Atnafu Gebeyehu et al. PLoS One. .

Abstract

Background: Kangaroo mother care is a key procedure in reducing neonatal mortality and morbidity associated with preterm birth. In Ethiopia, neonatal death remains a serious problem, and this study aims to determine the prevalence of the knowledge, attitudes and practice of kangaroo mother care among Ethiopia women.

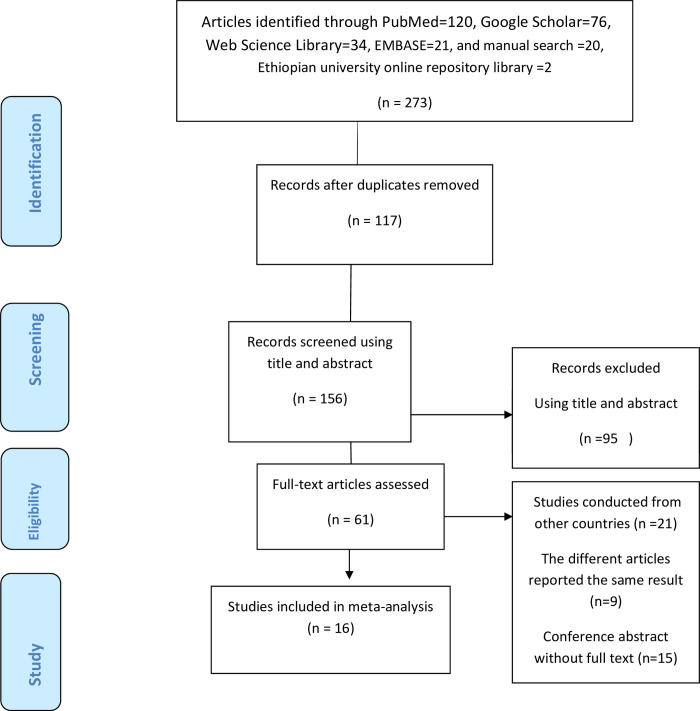
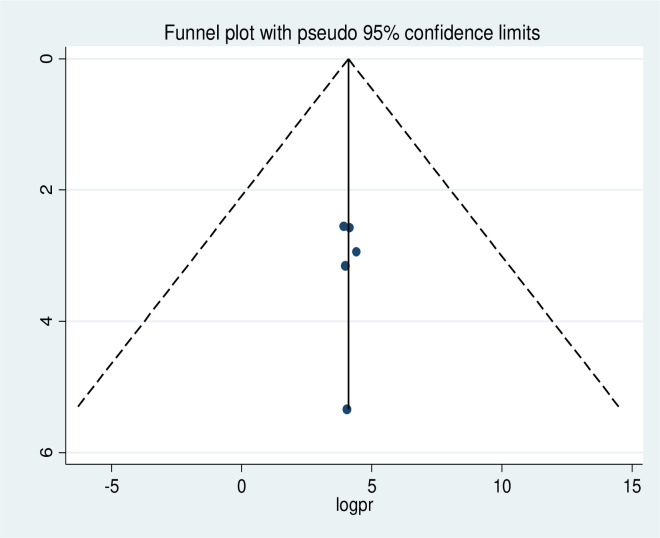
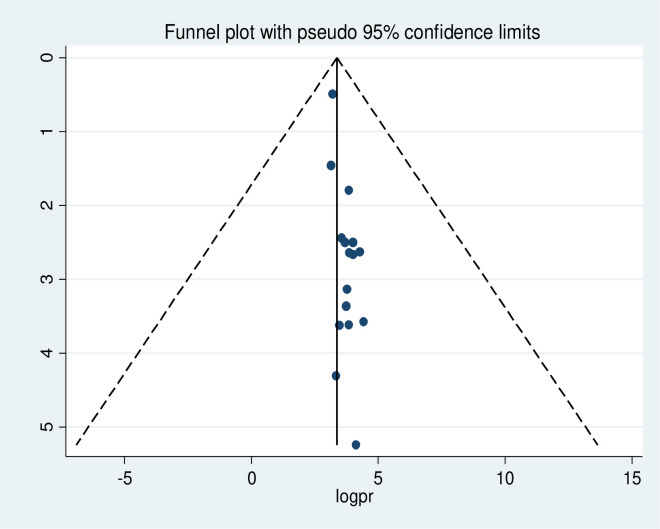
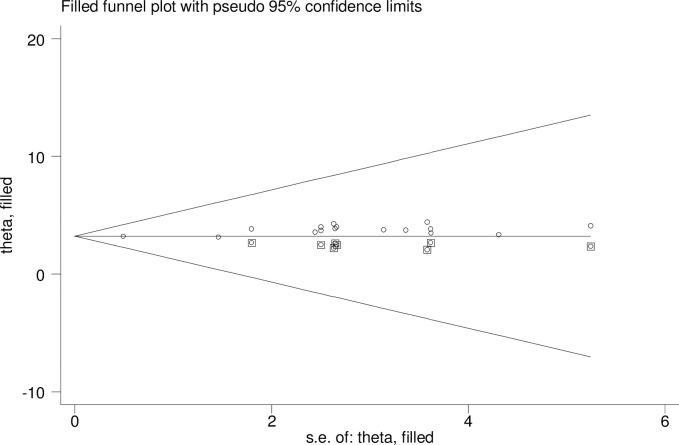
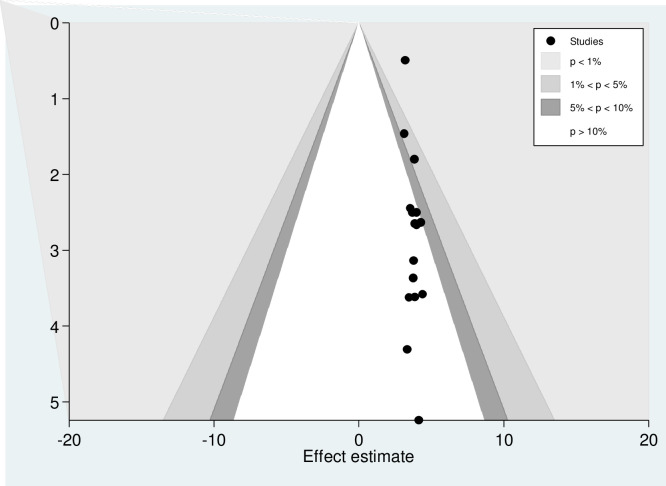
Methods: PubMed, Web of Science, Google Scholar, EMBASE and the Ethiopian University online library were searched. Data were extracted using Microsoft Excel and analysed using STATA statistical software (v. 11). Publication bias was checked by forest plot, Begg's rank test and Egger's regression test. To look for heterogeneity, I2 were computed and an overall estimated analysis carried out. Subgroup analysis was done by region, study setting, publication, gestational age, birth weight and component of kangaroo care. The Joanna Briggs Institute risk of bias assessment tool was used. We carried out a leave one out sensitivity analysis.

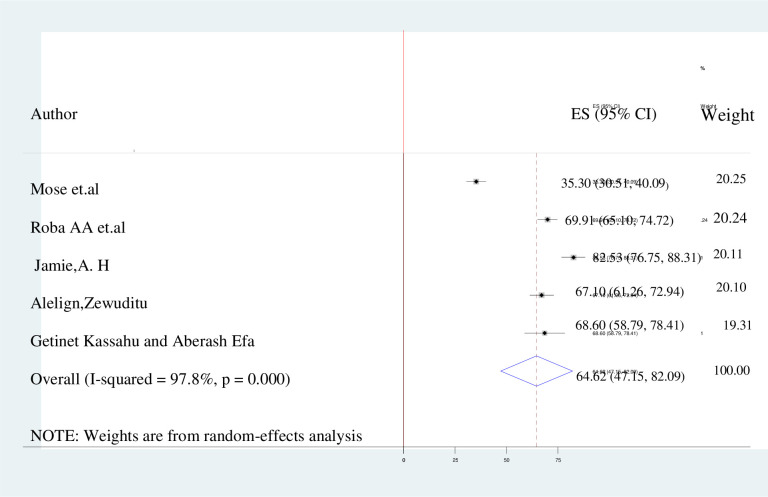
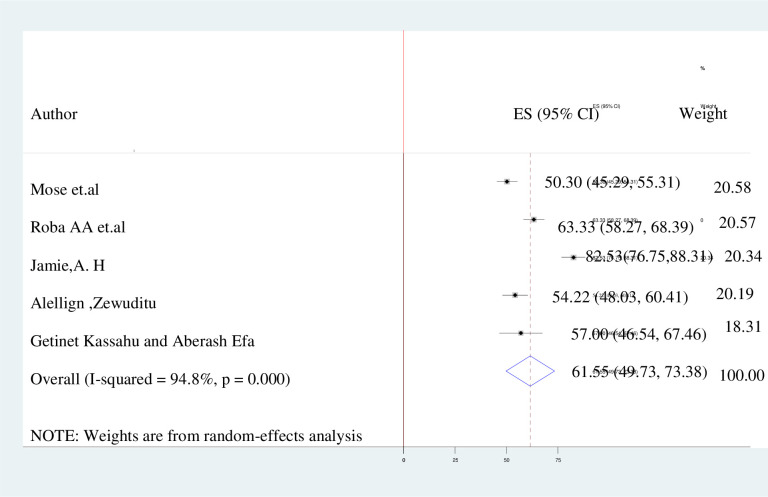
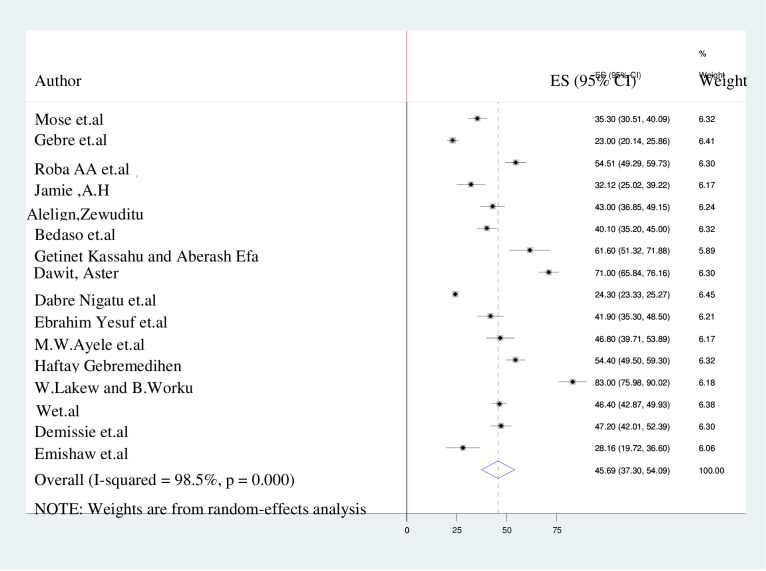
Results: Out of 273 articles retrieved, 16 studies met the eligibility criteria and are thus included in this study. Those 16 studies had a total of 12,345 respondents who reported kangaroo mother practice, with five (comprising 1,232 participants combined) reporting that both knowledge and attitude were used to determine the overall estimation. The pooled estimates of good knowledge, positive attitude and poor practice of kangaroo mother care were found to be 64.62% (95% CI: 47.15%-82.09%; I2 = 97.8%), 61.55% (49.73%-73.38%; I2 = 94.8%) and 45.7% (95% CI: 37.23%-54.09%; I2 = 98.5%), respectively. This study is limited to postnatal women and does not take account their domestic partners or health providers.

Conclusion: The findings revealed significant gaps in the knowledge, attitudes and practice of kangaroo mother care in Ethiopia when compared with other developing countries. Therefore, kangaroo mother care training to women, along with further studies on domestic partners and health providers.


Conflict of interest statement

The authors declared that they have no competing interests

Figures

Fig 1
Fig 1. A Prisma diagrammatic presentation used to show the selection of studies.
The inclusion criteria were variation of the title and abstracts, place of study (Ethiopia), presence of full abstract, and reporting different results. Studies were excluded if they criteria were duplicated source, unrelated research, case studies and qualitative studies.
Fig 2
Fig 2. Forest plot of knowledge with the height of the diamond is the overall effect size (64.62% while the width is the confidence interval at 95% (47.15%–82.09%).
The y-axis shows the standard error of each study while the x-axis the estimate of effect size of the each study. The vertical line denotes the no effect. The box represents the effect size of each study and the line across the box is confidence interval of each study.
Fig 3
Fig 3. The forest plot of attitude with the diamond represents the summary point estimate (61.55%) and the horizontal extremity of the diamond is the confidence interval at 95% (49.73%–73.38).
The standard error is plotted at the y-axis and the effect size plotted at x-axis. The squares represent the effect estimate of the individual studies and the horizontal lines indicate the confidence interval; the dimension of the square reflects the weight of each study.
Fig 4
Fig 4. The forest plot of practice with the height of the diamond is the overall effect size (45.7%) while the width is the confidence interval at 95% (37.30%-54.09%).
The y-axis shows the standard error of each study while the x-axis the estimate of effect size of the each study. The vertical line denotes the no effect. The square represents the effect size of each study and the line across the square is confidence interval of each study.
Fig 5
Fig 5. Funnel plot showing symmetrical distribution of studies indicating absence of publication bias.
The Y-axis is the standard error and the X-axis is the study result or effect size. The dotted diagonal lie of the funnel is the 95% confidence interval and the vertical. The vertical line is the line of no-effect and dots are included studies reporting knowledge of kangaroo mother care.
Fig 6
Fig 6. Funnel plot showing symmetrical distribution of studies indicating absence of publication bias.
The Y-axis is the standard error and the X-axis is the study result or effect size. The dotted diagonal lie of the funnel is the 95% confidence interval and the vertical. The vertical line is the line of no-effect and dots are included studies reporting attitude of kangaroo mother care.
Fig 7
Fig 7. Funnel plot showing asymmetrical distribution of studies indicating the presence of publication bias.
The Y-axis is the standard error and the X-axis is the study result or effect size. The dotted diagonal line of the funnel is the 95% confidence interval and the vertical. The vertical line is the line of no-effect and dots are included studies reporting attitude of kangaroo mother care.
Fig 8
Fig 8. The funnel plot for trim-and-fill method was used to correct the result seven potential missing studies were required in the left side of the funnel plot to ensure symmetry.
The enclosed circles represent the dummy studies and the free circles are genuine studies.
Fig 9
Fig 9. Counter-enhanced funnel plot suggestions of missing studies on the bottom left-hand-side of the plot.
Since the majority of this area contains regions of high statistical significance (P < 0.01), this reduces the plausibility that publication bias is the underlying cause of this funnel asymmetry. Various shaded regions indicate statistical significance. In particular, the white shaded region in the middle corresponds to p-values greater than .10, the dark gray-shaded region corresponds to p-values between .10 and .05, the medium gray-shaded region corresponds to p-values between .05 and .01, and the region outside of the funnel corresponds to p-values below .01.

Similar articles

Cited by

References

    1. WHO and UNICEF Joint Statement. (2009). Home visits for a newborn child: a strategy to improve survival - PubMed
    1. Oza S, Cousens S, Lawn J. Estimation of daily risk of neonatal death, including the day of birth, in 186 countries in 2013: A vital-registration and modeling-based study. Lancet Glob Health. 2014;2:e635–44. doi: 10.1016/S2214-109X(14)70309-2 - DOI - PubMed
    1. Lawn J, Blencowe H, Oza S, You D, Lee A, Waiswa P, et al.. Progress, priorities, and potential beyond survival. Lancet. 2014;384:189–205. - PubMed
    1. UN Inter-agency Group for Child Mortality Estimation. Levels & trends in child mortality: report 2019. New York: UNICEF; 2019. https://www.unicef.org/media/60561/file/UN-IGME-child-mortality-report-2.... Accessed 14 Oct 2019
    1. Beck S, Wojdyla D, Say L, Betran AP, Merialdi M, Requejo JH, et al.. (2010). The worldwide incidence of preterm birth: a systematic review of maternal mortality and morbidity. Bull World Health Organ, 88(1):31–38 doi: 10.2471/BLT.08.062554 - DOI - PMC - PubMed