. 2022 May 6;17(5):e0268283.
doi: 10.1371/journal.pone.0268283. eCollection 2022.

Regulation of CLB6 expression by the cytoplasmic deadenylase Ccr4 through its coding and 3' UTR regions

Affiliations

Regulation of CLB6 expression by the cytoplasmic deadenylase Ccr4 through its coding and 3' UTR regions

Jastin Edrian Cocuangco Revilleza et al. PLoS One. .

Abstract

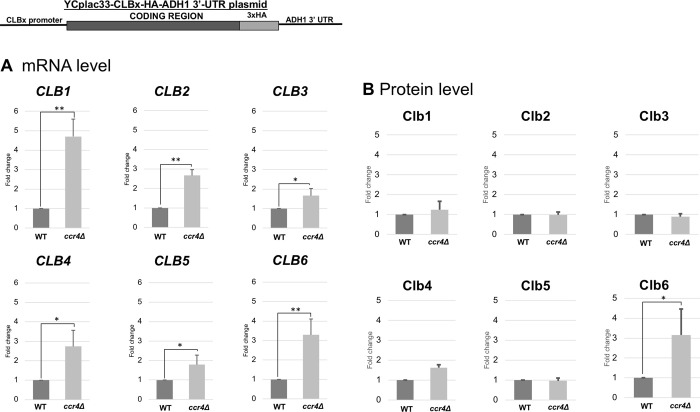
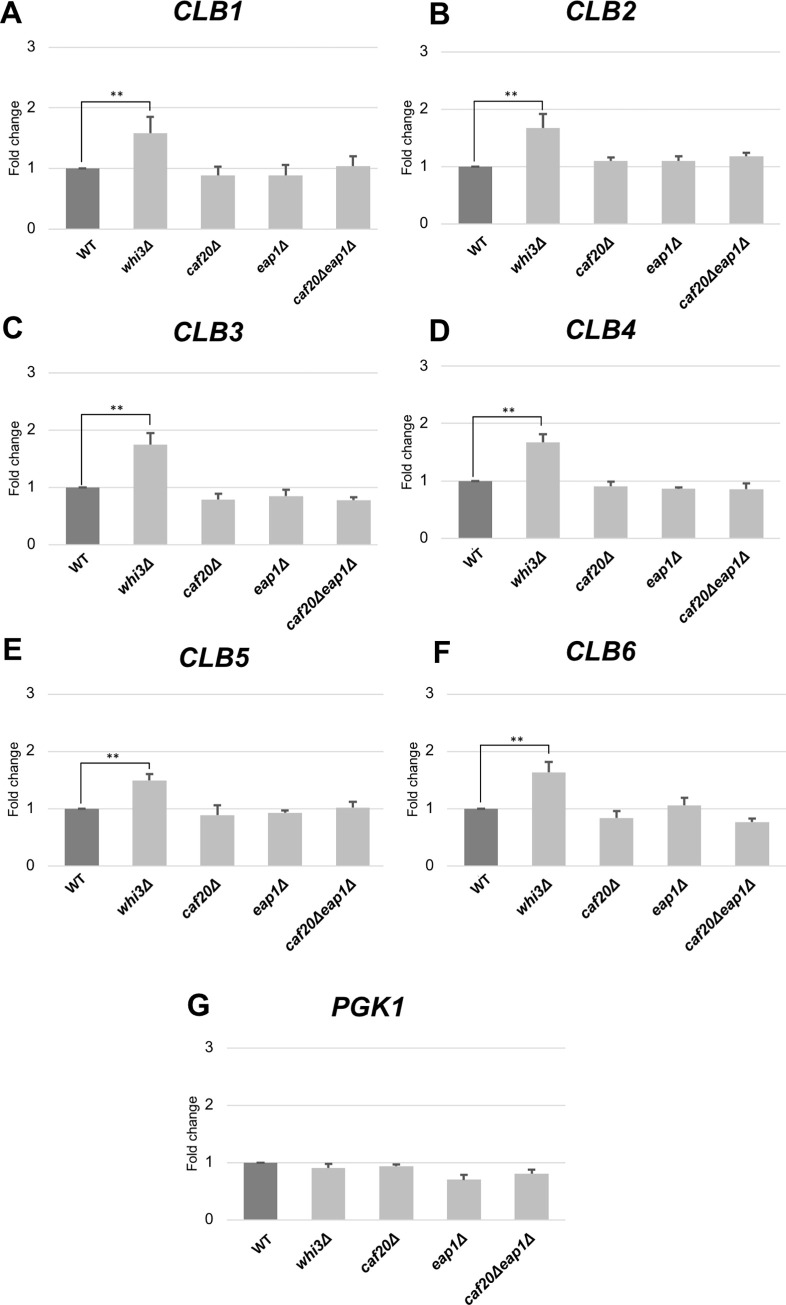
RNA stability control contributes to the proper expression of gene products. Messenger RNAs (mRNAs) in eukaryotic cells possess a 5' cap structure and the 3' poly(A) tail which are important for mRNA stability and efficient translation. The Ccr4-Not complex is a major cytoplasmic deadenylase and functions in mRNA degradation. The CLB1-6 genes in Saccharomyces cerevisiae encode B-type cyclins which are involved in the cell cycle progression together with the cyclin-dependent kinase Cdc28. The CLB genes consist of CLB1/2, CLB3/4, and CLB5/6 whose gene products accumulate at the G2-M, S-G2, and late G1 phase, respectively. These Clb protein levels are thought to be mainly regulated by the transcriptional control and the protein stability control. Here we investigated regulation of CLB1-6 expression by Ccr4. Our results show that all CLB1-6 mRNA levels were significantly increased in the ccr4Δ mutant compared to those in wild-type cells. Clb1, Clb4, and Clb6 protein levels were slightly increased in the ccr4Δ mutant, but the Clb2, Clb3, and Clb5 protein levels were similar to those in wild-type cells. Since both CLB6 mRNA and Clb6 protein levels were most significantly increased in the ccr4Δ mutant, we further analyzed the cis-elements for the Ccr4-mediated regulation within CLB6 mRNA. We found that there were destabilizing sequences in both coding sequence and 3' untranslated region (3' UTR). The destabilizing sequences in the coding region were found to be both within and outside the sequences corresponding the cyclin domain. The CLB6 3' UTR was sufficient for mRNA destabilization and decrease of the reporter GFP gene and this destabilization involved Ccr4. Our results suggest that CLB6 expression is regulated by Ccr4 through the coding sequence and 3' UTR of CLB6 mRNA.


Conflict of interest statement

The authors have declared that no competing interests exist.

Figures

Fig 1
Fig 1. The ccr4Δ mutation showed a synthetic growth defect with the mih1Δ mutation.
The strains that were heterozygous for favorite alleles were sporulated, and tetrads were dissected onto YPD plate. The growth of segregants after 4 days at 30°C is shown. Genotypes are indicated on both sides. More than 50 tetrads were dissected, and representative data are shown. (A) Tetrad analysis of strain 10BD-c4k1m1 that was heterozygous for ccr4Δ, khd1Δ, and mih1Δ alleles. The ccr4Δ khd1Δ double mutant strain showed slower growth than the ccr4Δ single mutant, and the ccr4Δ khd1Δ mih1Δ triple mutant strain was never germinated. (B) Tetrad analysis of strain 10BD-c4k1s1 that was heterozygous for ccr4Δ, khd1Δ, and swe1Δ alleles. The ccr4Δ khd1Δ swe1Δ triple mutant showed better growth than the ccr4Δ khd1Δ double mutant strain.
Fig 2
Fig 2. Expression of CLB1, CLB2, CLB3, CLB4, CLB5, and CLB6 in wild-type and ccr4Δ mutant cells.
The mRNA levels of CLB1 (A), CLB2 (B), CLB3 (C), CLB4 (D), CLB5 (E), and CLB6 (F) in ccr4Δ mutant strain growing in YPD media relative to the wild-type strain. PGK1 (G) was used as a control. mRNA levels were quantified by qRT-PCR analysis, and the relative mRNA levels were calculated using 2-ΔΔCt method normalized to ACT1 reference gene. The data show mean ± SEM (n = 3) of fold change of mRNA level from wild-type cells at 4 h of culture in YPD. *P < 0.05, **P < 0.01 as determined by Tukey’s test.
Fig 3
Fig 3. Expression of CLB1, CLB2, CLB3, CLB4, CLB5, and CLB6 in wild-type, pop2Δ, not1, not2, and not4Δ mutant cells.
The mRNA levels of CLB1 (A), CLB2 (B), CLB3 (C), CLB4 (D), CLB5 (E), and CLB6 (F) in pop2Δ, not1Δ, not2Δ, and not4Δ mutant strains growing in YPD media relative to the wild-type strain. PGK1 (G) was used as a control. mRNA levels were quantified by qRT-PCR analysis, and the relative mRNA levels were calculated using 2-ΔΔCt method normalized to ACT1 reference gene. The data show mean ± SEM (n = 3) of fold change of mRNA level from wild-type cells at 4 h of culture in YPD. *P < 0.05, **P < 0.01 as determined by Tukey’s test.
Fig 4
Fig 4. The cell-cycle regulated expression of CLBs in the ccr4Δ mutant.
The qRT-PCR analysis data of RNR1 mRNA, SIC1 mRNA, and CLB mRNAs in the cell cycle synchronized bar1Δ mutant (black circle) and bar1Δ ccr4Δ mutant (gray square). Cell cycle was arrested in G1 phase by α-factor, and, after release, cells were collected from 0min (just before releasing) to 120min. The fold change of RNR1 mRNA, S phase marker, (A) and SIC1 mRNA, late M phase marker, (B) show cell cycle successfully progress both in the bar1Δ mutant and the bar1Δ puf5Δ mutant. The fold change of B-type cyclin mRNAs, CLB1 mRNA (C), CLB2 mRNA (D), CLB3 mRNA (E), CLB4 mRNA (F), CLB5 mRNA (G), CLB6 mRNA (H) are presented.
Fig 5
Fig 5. The half-lives of CLB1-CLB6 mRNAs in wild-type and the ccr4Δ mutant.
The bar1Δ and the bar1Δ ccr4Δ mutant cells were pre-cultured in YPD medium at 28°C overnight, and transferred into fresh YPD medium, and cultured until mid-exponential phase. Then, thiolutin was added, and samples were collected by centrifuge at 0, 1, 2, 5, 10, 20, 40, 80 minutes after exposure to thiolutin. The mRNA levels at each time point were determined by qRT-PCR. The half-lives (t1/2) were calculated using Microsoft Excel. *P < 0.05, **P < 0.01 as determined by Tukey’s test.
Fig 6
Fig 6. The cell-cycle regulated expression of CLBs in the ccr4Δ mutant.
The qRT-PCR analysis data of RNR1, CLB5, and CLB6 mRNAs in the cell cycle synchronized bar1Δ mutant (black circle) and bar1Δ ccr4Δ mutant (gray square). Cell cycle was arrested in G1 phase by α-factor, and, after releasing in the presence of HU, cells were collected from 0 min (just before releasing) to 120 min. The fold change of RNR1 mRNA, S phase marker, (A) and SIC1 mRNA, late M phase marker, (B) show cell cycle successfully progress both in the bar1Δ mutant and the bar1Δ puf5Δ mutant. The fold change of B-type cyclin mRNAs, CLB1 mRNA (C), CLB2 mRNA (D), CLB3 mRNA (E), CLB4 mRNA (F), CLB5 mRNA (G), CLB6 mRNA (H) are presented.
Fig 7
Fig 7. Expression of CLB1-HA, CLB2-HA, CLB3-HA, CLB4-HA, CLB5-HA, and CLB6-HA in wild-type and ccr4Δ mutant cells harboring the CLBx-HA-CLBx 3’-UTR plasmid.
The mRNA (A) and protein (B) levels of CLB1-HA, CLB2-HA, CLB3-HA, CLB4-HA, CLB5-HA, and CLB6-HA in wild-type (WT) and ccr4Δ mutant cells growing in SC-ura media. The strains harboring the CLBx-HA-CLBx 3’ UTR plasmids were grown at 28°C. mRNA levels were quantified by qRT-PCR analysis, and the relative mRNA levels were calculated using 2-ΔΔCt method normalized to ACT1 reference gene. The data show mean ± SEM (n = 3) of fold change of mRNA level from wild-type cells at 4 H of culture in SC-ura. Protein levels were quantified by preparing cell extracts collected at log phase (4 H) for immunoblotting with anti-HA and anti-Pgk1 antibodies where Pgk1 was used as the loading control. The data show mean ± SEM (n = 3) of fold change of pr level from wild-type cells at 4 H of culture in SC-ura. *P < 0.05, **P < 0.01 as determined by Tukey’s test.
Fig 8
Fig 8. Expression of CLB1-HA, CLB2-HA, CLB3-HA, CLB4-HA, CLB5-HA, and CLB6-HA in wild-type and ccr4Δ mutant cells harboring the CLBx-HA-ADH1 3’ UTR plasmid.
The mRNA (A) and protein (B) levels of CLB1-HA, CLB2-HA, CLB3-HA, CLB4-HA, CLB5-HA and CLB6-HA in wild-type (WT) and ccr4Δ mutant strain growing in SC-ura media. The strains harboring the CLBx-HA-ADH1 3’ UTR plasmid were grown at 28°C. mRNA levels were quantified by qRT-PCR analysis, and the relative mRNA levels were calculated using 2-ΔΔCt method normalized to ACT1 reference gene. The data show mean ± SEM (n = 3) of fold change of mRNA level from wild-type cells at 4 h of culture in Sc-ura. Protein levels were quantified by preparing cell extracts collected at log phase (4 H) for immunoblotting with anti-HA and anti-Pgk1 antibodies where Pgk1 was used as the loading control. The data show mean ± SEM (n = 3) of fold change of protein level from wild-type cells at 4 H of culture in SC-ura. *P < 0.05, **P < 0.01 as determined by Tukey’s test.
Fig 9
Fig 9. Expression of GFP mRNA and protein in wild-type strain harboring the MCM2 promoter-GFP-CLBx 3’-UTR plasmids.
The mRNA (A) and protein (B) levels of in wild-type (WT) strains harboring the MCM2 promoter-GFP-CLBx 3’ UTR plasmids were grown at 30°C in SC-ura media. mRNA levels were quantified by qRT-PCR analysis, and the relative mRNA levels were calculated using 2-ΔΔCt method normalized to ACT1 reference gene. The data show mean ± SEM (n = 3) of fold change of mRNA level from wild-type cells at 4 H of culture in Sc-ura. Protein levels were quantified by preparing cell extracts collected at log phase (4 H) for immunoblotting with anti-GFP and anti-Pgk1 antibodies where Pgk1 was used as the loading control. The data show mean ± SEM (n = 3) of fold change of protein level from wild-type cells at 4 H of culture in SC-ura. *P < 0.05, **P < 0.01 as determined by Tukey’s test.
Fig 10
Fig 10. Expression of GFP mRNA and protein in wild-type and ccr4Δ mutant cells harboring the MCM2 promoter-GFP-CLBx 3’ UTR plasmids.
The mRNA (A) and protein (B) levels of GFP in wild-type (WT) and ccr4Δ strains harboring the MCM2 promoter-GFP-CLBx 3’ UTR plasmids were grown at 28°C in SC-ura media. mRNA levels were quantified by qRT-PCR analysis, and the relative mRNA levels were calculated using 2-ΔΔCt method normalized to ACT1 reference gene. The data show mean ± SEM (n = 3) of fold change of mRNA level from wild-type cells at 4 H of culture in Sc-ura. Protein levels were quantified by preparing cell extracts collected at log phase (4 H) for immunoblotting with anti-GFP and anti-Pgk1 antibodies where Pgk1 was used as the loading control. The data show mean ± SEM (n = 3) of fold change of protein level from wild-type cells at 4 H of culture in SC-ura. *P < 0.05, **P < 0.01 as determined by Tukey’s test.
Fig 11
Fig 11. Deletion analysis of the CLB6 coding sequence.
Deletion sequences were done by deletion 10 amino acid base pairs per region (Deletion 1 to 15) relative to the ND (no deletion). The Cyclin Domain 1 and 2 are highlighted as grey (A). The mRNA (B) and protein (C) levels comparing the full-length and deletion strains transformed in wild-type strain grown in SC-ura media at 30°C. Protein levels are prepared on two gels from D1-7 and 8–15 and were quantified relative to the ND gene. mRNA levels were quantified by qRT-PCR analysis, and the relative mRNA levels were calculated using 2-ΔΔCt method normalized to ACT1 reference gene. The data show mean ± SEM (n = 3) of fold change of mRNA level from wild-type cells at 4 H of culture in SC-ura. Protein levels were quantified by preparing cell extracts collected at log phase (4 H) for immunoblotting with anti-HA and anti-Pgk1 antibodies where Pgk1 was used as the loading control. The data show mean ± SEM (n = 3) of fold change of protein level from wild-type cells at 4 H of culture in SC-ura. *P < 0.05, **P < 0.01 as determined by Tukey’s test.
Fig 12
Fig 12. Deletion analysis of the CLB6 3’ UTR.
Deletion sequences were done by ~30 base pairs deletion per region (Deletion 1 to 6) starting from the 5’ end after the GFP relative to the full-length. The mRNA (B) and protein level (C) in wild-type strain harboring gene construct of MCM2-GFP-CLB6 3’ UTR were grown at 30°C in SC-ura media. mRNA levels were quantified by qRT-PCR analysis and were calculated using 2-ΔΔCt method normalized to ACT1 reference gene. Protein levels were quantified by preparing cell extracts collected at log phase (4 H) for immunoblotting with anti-GFP and anti-Pgk1 antibodies where Pgk1 was used as the loading control. It was plotted as the fold change relative to the ‘no deletion strain’ cells at 4H of culture. The data show mean ± SEM (n = 3) *P < 0.05, **P < 0.01 as determined by Tukey’s test.
Fig 13
Fig 13. Expression of GFP on gene construct of MCM2-GFP-CLB6 3’-UTR with pufΔ mutants.
The mRNA (A) and protein (B) levels of GFP in wild-type (WT), puf1Δ, puf2Δ, puf3Δ, puf4Δ, puf5Δ, puf6Δ, and ccr4Δ strains harboring the gene constructs of MCM2-GFP-CLB6 3’UTR grown at 28°C in SC-ura. mRNA levels were quantified by qRT-PCR analysis, and the relative mRNA levels were calculated using 2-ΔΔCt method normalized to ACT1 reference gene. The data show mean ± SEM (n = 3) of fold change of mRNA level from wild-type cells at 4 H of culture in SC-ura. Protein levels were quantified by preparing cell extracts collected at log phase (4 H) for immunoblotting with anti-GFP and anti-Pgk1 antibodies where Pgk1 was used as the loading control. The data show mean ± SEM (n = 3) of fold change of protein level from wild-type cells at 4 H of culture in SC-ura. *P < 0.05, **P < 0.01 as determined by Tukey’s test.
Fig 14
Fig 14. Expression of CLB1, CLB2, CLB3, CLB4, CLB5, and CLB6 in whi3Δ, caf20Δ, eap1Δ and caf20Δ eap1Δ strains.
The mRNA levels of CLB1 (A), CLB2 (B), CLB3 (C), CLB4 (D), CLB5 (E), and CLB6 (F) in ccr4Δ mutant strain growing in YPD medium relative to the wild-type strain. PGK1 (G) was used as positive control. mRNA levels were quantified by qRT-PCR analysis, and the relative mRNA levels were calculated using 2-ΔΔCt method normalized to ACT1 reference gene. The data show mean ± SEM (n = 3) of fold change of mRNA level from wild-type cells at 4 H of culture in YPD. *P < 0.05, **P < 0.01 as determined by Tukey’s test.

Similar articles

Cited by

References

    1. Lodish H, Berk A, Kaiser CA, Krieger M, Bretscher A, Ploegh H, et al.. Molecular Cell Biology Eight Edition. W.H. Freeman and Company; 2016.
    1. Valencia-Sanchez MA, Liu J, Hannon GJ, Parker R. Control of translation and mRNA degradation by miRNAs and siRNAs. Genes Dev 2006. Mar 1’20(5):515–24. doi: 10.1101/gad.1399806 - DOI - PubMed
    1. Arraiano CM, Andrade JM, Domingues S, Guinote IB, Malecki M, Matos RG, et al.. The critical role of RNA processing and degradation in the control of gene expression. FEMS Microbiology Reviews V 34 (5) 2010. doi: 10.1111/j.1574-6976.2010.00242.x - DOI - PubMed
    1. Boo SH, Kim YK. The emerging role of RNA modifications in the regulation of mRNA stability. Experimental & Molecular Medicine 52:400–408. 2020. doi: 10.1038/s12276-020-0407-z - DOI - PMC - PubMed
    1. Schoenberg DR, Maquat LE. Regulation of cytoplasmic mRNA decay. Nature Reviews Genetics 13, 246–259. 2012. doi: 10.1038/nrg3160 - DOI - PMC - PubMed

Publication types

MeSH terms