. 2022 May 6;18(5):e1010039.
doi: 10.1371/journal.pcbi.1010039. eCollection 2022 May.

Spatial dynamics of feedback and feedforward regulation in cell lineages

Affiliations

Spatial dynamics of feedback and feedforward regulation in cell lineages

Peter Uhl et al. PLoS Comput Biol. .

Abstract

Feedback mechanisms within cell lineages are thought to be important for maintaining tissue homeostasis. Mathematical models that assume well-mixed cell populations, together with experimental data, have suggested that negative feedback from differentiated cells on the stem cell self-renewal probability can maintain a stable equilibrium and hence homeostasis. Cell lineage dynamics, however, are characterized by spatial structure, which can lead to different properties. Here, we investigate these dynamics using spatially explicit computational models, including cell division, differentiation, death, and migration / diffusion processes. According to these models, the negative feedback loop on stem cell self-renewal fails to maintain homeostasis, both under the assumption of strong spatial restrictions and fast migration / diffusion. Although homeostasis cannot be maintained, this feedback can regulate cell density and promote the formation of spatial structures in the model. Tissue homeostasis, however, can be achieved if spatially restricted negative feedback on self-renewal is combined with an experimentally documented spatial feedforward loop, in which stem cells regulate the fate of transit amplifying cells. This indicates that the dynamics of feedback regulation in tissue cell lineages are more complex than previously thought, and that combinations of spatially explicit control mechanisms are likely instrumental.


Conflict of interest statement

The authors have declared that no competing interests exist.

Figures

Fig 1
Fig 1. Properties of the spatially explicit computational model with negative feedback.
(A) Dynamics of the agent-based model, depending on the carrying capacity K under the assumption that cells migrate with a high rate (large pmig) and feedback mediators move across space at a high rate (large g). The horizontal lines represent equilibrium values derived from the corresponding ODE system (2). Parameters are given as follows. For agent-based model: Pdiv = 4.17x10⁻², p(0)self = 0.7, PSdeath = 0, PDdeath = 8.3x10⁻³, pmig = 0.67, h = 1.6, c = 8.33, b = 4.17, g = 83.3; n = 100 and n = 200 for the small and large system, respectively. The average over 46 simulations are shown for each case; standard errors are too small to see. For ODEs: r = 4.17x10⁻², η = 0, α = 8.3x10⁻³, ξ = 8.33, β = 4.17, p’ = 0.7, f = 1.6, K = 100x100 and 200x200 for the small and large systems, respectively. (B) Equilibrium properties of the corresponding ODE system (2) as a function of the carrying capacity, K. Parameters were the same as in (a). (C) Dynamics of the agent-based simulation, depending on the carrying capacity K under the assumption of spatial restriction (pmig = 0, low g). Parameters were chosen as follows. Pdiv = 4.17x10⁻², p(0)self = 0.7, PSdeath = 8.3x10⁻⁵, PDdeath = 4.17x10⁻³, pmig = 0., h = 4.0x10⁻³, c = 8.33, b = 8.3x10⁻³, g = 0.83; n = 100 and n = 200 for the small and large system, respectively. The average over 46 simulations are shown for each case; standard errors are too small to see. Units of parameters are in hours.
Fig 2
Fig 2. Spatial patterns observed in the agent-based model with negative feedback.
Dark blue is empty space, light blue represents stem cells, and yellow represents differentiated cells. (A) With a stronger degree of negative feedback on the stem cell self-renewal rate, clumped spatial patterns are observed. Islands of stem and differentiated cells form, separated by empty space. Stem cells are in the minority. (B) For weaker negative feedback, these spatial patterns break down, and a uniform distribution of cells across space is observed. Also, stem cells become the dominant population. For A and B: The spatial picture is a snapshot in time at equilibrium, and the time series represents the average over 46 simulations; standard errors are too small to see. (C) The degree of clustering of cells across space can be quantified by dividing the space up into relatively small squares (10x10), and recording the number of cells per square. If the ratio of Idisp = variance / mean is greater than 1, the spatial pattern is clumped. If the ratio Idisp is less than one, the distribution is uniform. The graph shows the value of Idisp at the end of the simulation (at equilibrium). As the rate of negative feedback inhibition is increased from low to high, we observe a relatively sharp transition in the ratio Idisp, i.e. from a uniform to a clumped distribution of cells across the space. Baseline parameter values were chosen as follows. Pdiv = 4.17x10⁻², p(0)self = 0.7, PSdeath = 8.3x10⁻⁵, PDdeath = .17x10-3, pmig = 0., h = 4x10⁻³, c = 8.33, b = 8.3x10⁻³, g = 0.83; n = 200. For (A) h = 4x10⁻³, (B) h = 10−3, and for (C) the value of h was varied, as indicated. Units of rate parameters are in hours-1.
Fig 3
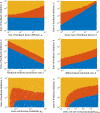
Fig 3. Parameter dependencies of outcome.
Each dot in the graph represents the long-term outcome of an individual simulation. Each simulation was run up to a time threshold, and the spatial distribution was determined by calculating Idisp, the index of dispersion. The time threshlold was determined by waiting until the temporal average of the stem cells did not change by more than 0.1% for 1000 consecutive time steps, after which the simulation was allowed to run for an amount of time that corresponds to 10 years in the simulation, to ensure that the dynamics are well in the steady state pase. Yellow indicates the extinction of the cells. Blue indicates a distribution that is characterized by Idisp < 1.5 (mostly uniform distribution). Red indicates Idisp > 1.5 (clumped distribution of cells). For each graph, two parameters were varied: the strength of negative feedback on the stem cell self-renewal probability, h, and a second parameter, as indicated in the individual graphs. The ranges of the parameters were chosen such that all three outcomes are seen, to illustrate how the different outcomes depend on parameters. Baseline parameters were chosen as follows. Pdiv = 4.17x10⁻², p(0)self = 0.7, PSdeath = 8.3x10⁻⁴, PDdeath = 4.17x10⁻³, pmig = 0., c = 8.33, b = 8.3x10⁻³, g = 0.833; n = 200. Units of rate parameters are in hours-1.
Fig 4
Fig 4
(A) Properties of the agent-based models with the feedforward control loop only. Dark blue represents empty space, light blue stem cells, green transit amplifying cells, and yellow terminally differentiated cells. (i) In the absence of stem and transit amplifying cell death, the cell population stops growing and converges to an equilibrium that is independent of the carrying capacity, K (not shown). The transit amplifying cells block stem cell divisions due to lack of available space, and this prevents the cluster of cells from expanding. The picture shown corresponds to the population at steady state. Parameters were as follows: Pdiv = 4.17x10⁻², p(0)self = 0.8, qdiv = 5.83x10⁻², PSdeath = 0, PTdeath = 0, PDdeath = 4.17x10⁻³, pmig = 0., c2 = 0.833, b2 = 8.3x10⁻³, g2 = 0.417, h2 = 2, n = 200. (ii) In the presence of cell death, however, this mechanism breaks down and the stem cells can continuously expand into empty space, provided by the death of transit amplifying cells. The picture represents a snap-shot during this cell expansion. Parameters were chosen as follows: Pdiv = 4.17x10⁻², p(0)self = 0.8, qdiv = 5.83x10⁻², PSdeath = 8.3x10⁻⁵, PTdeath = 10−4, PDdeath = 4.17x10⁻³, pmig = 0., c2 = 0.833, b2 = 8.3x10⁻³, g2 = 0.417, h2 = 2, n = 200. (B) Properties of the agent-based model that contains both the feedforward and the feedback loop, and assumes the occurrence of death for all cell populations. (i) Time series, in which the system / grid size was varied, n = 100 vs n = 150. Blue and purple show stem cells for the smaller and larger grid size, respectively. Light green and dark green show TA cells, for the smaller and larger grid size, respectively. Yellow and orange show differentiated cells, for the smaller and larger grid size, respectively. The lines present the average time series over 46 iterations of the simulation, and the dashed lines represent the average plus minus standard errors. The simulation was run for 100 years to show that this mechanism can in principle maintain tissue homeostasis for long human life-spans (in the absence of any mutations that might allow cell growth) (ii) A snapshot of the spatial configuration of cells at a specific time point during steady state. Parameters were chosen as follows. Pdiv = 4.17x10⁻², p(0)self = 0.8, qdiv = 5.83x10⁻², PSdeath = 8.3x10⁻⁵, PTdeath = 10−4, PDdeath = 4.17x10⁻³, pmig = 0., c = 8.33, b = 8.33x10⁻², g = 0, h = 6.0x10⁻², c2 = 8.33, b2 = 8.33x10⁻², g2 = 3.33, h2 = 2.5. Units of rate parameters are in hours-1.

Similar articles

Cited by

References

    1. Inaba M, Yamashita YM. Asymmetric stem cell division: precision for robustness. Cell stem cell. 2012;11(4):461–9. doi: 10.1016/j.stem.2012.09.003 - DOI - PubMed
    1. Simons BD, Clevers H. Strategies for homeostatic stem cell self-renewal in adult tissues. Cell. 2011;145(6):851–62. doi: 10.1016/j.cell.2011.05.033 . - DOI - PubMed
    1. Snippert HJ, van der Flier LG, Sato T, van Es JH, van den Born M, Kroon-Veenboer C, et al.. Intestinal crypt homeostasis results from neutral competition between symmetrically dividing Lgr5 stem cells. Cell. 2010;143(1):134–44. doi: 10.1016/j.cell.2010.09.016 . - DOI - PubMed
    1. Nicolas P, Kim KM, Shibata D, Tavare S. The stem cell population of the human colon crypt: analysis via methylation patterns. PLoS computational biology. 2007;3(3):e28. doi: 10.1371/journal.pcbi.0030028 ; PubMed Central PMCID: PMC1808490. - DOI - PMC - PubMed
    1. Lee J, Son MJ, Woolard K, Donin NM, Li A, Cheng CH, et al.. Epigenetic-mediated dysfunction of the bone morphogenetic protein pathway inhibits differentiation of glioblastoma-initiating cells. Cancer cell. 2008;13(1):69–80. doi: 10.1016/j.ccr.2007.12.005 - DOI - PMC - PubMed

Publication types