. 2022 May 10;119(19):e2117553119.
doi: 10.1073/pnas.2117553119. Epub 2022 May 6.

Single-cell-resolution map of human retinal pigment epithelium helps discover subpopulations with differential disease sensitivity

Affiliations

Single-cell-resolution map of human retinal pigment epithelium helps discover subpopulations with differential disease sensitivity

Davide Ortolan et al. Proc Natl Acad Sci U S A. .

Abstract

Regional phenotypic and functional differences in the retinal pigment epithelium (RPE) monolayer have been suggested to account for regional susceptibility in ocular diseases such as age-related macular degeneration (AMD), late-onset retinal degeneration (L-ORD), and choroideremia (CHM). However, a comprehensive description of human topographical RPE diversity is not yet available, thus limiting the understanding of regional RPE diversity and degenerative disease sensitivity in the eye. To develop a complete morphometric RPE map of the human eye, artificial intelligence–based software was trained to recognize, segment, and analyze RPE borders. Five statistically different, concentric RPE subpopulations (P1 to P5) were identified using cell area as a parameter, including a subpopulation (P4) with cell area comparable to that of macular cells in the far periphery of the eye. This work provides a complete reference map of human RPE subpopulations and their location in the eye. In addition, the analysis of cadaver non-AMD and AMD eyes and ultra-widefield fundus images of patients revealed differential vulnerability of the five RPE subpopulations to different retinal diseases.

Keywords: AMD; artificial intelligence; cell morphometry; data science; retinal degeneration.


Conflict of interest statement

The authors declare no competing interest.

Figures
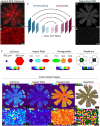
Fig. 1.
Fig. 1.
Complete morphometric analysis of an entire human RPE monolayer. (A) Representative image of an entire human RPE flatmount (red: phalloidin). Approximately 2 to 3.5 million cells were captured in about 200,000 images, projected in two-dimensional space, and tiled together. (B) Representative higher magnification image of phalloidin (red)-stained RPE cells. (C) REShAPE, a U-net convolutional neural network (CNN), recognizes and segments RPE cell borders from fluorescent images and analyzes RPE cell morphometry for the entire human RPE flatmount. (Conv 3x3, 3x3 convolutions; ReLU, rectified line unit.) (D and E) REShAPE-generated image for the entire human RPE flatmount with cell borders segmented for each RPE cell (D) and a representative higher magnification image (E). (F) Schematic representation of four distinct cell morphometry parameters (cell area, AR, hexagonality score, and number of neighbors) used for RPE cell shape analysis, specific examples highlighted. (G, I, K, and M) REShAPE-segmented cadaver human RPE flatmount images that are color-coded for cell area, AR, hexagonality score, and number of neighbors illustrate shape metrics of individual RPE cells in human eyes. Heatmaps on the top left corner of each image show range of values used for these four morphometry parameters. Arrowhead, fovea; *, optic nerve; arrow, peripheral ring of small RPE cells. (H, J, L, and N) Zoomed-in color-coded images display RPE shape metrics at single-cell level.
Fig. 2.
Fig. 2.
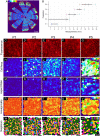
Analysis of cell area revealed the presence of five morphometrically different RPE subpopulations in human cadaver eyes. (A) A custom-made software called REShAPE Selection Tool divided segmented color-coded RPE flatmount images into five subpopulations arranged in concentric rings based on differences in cell area, from the center toward the periphery. (B) The graph describes the distance of each RPE subpopulation from the center of the eye in millimeters. Line boundaries represent the averages and the SDs calculated from the radii of the cropped circles (red corresponds to the SD of measurements of inner radii and blue to measurements of outer radii). (CA1) The panel shows zoomed-in representative images of cells for each RPE subpopulation (P1 to P5). (CG) Correspond to phalloidin (red)-stained images. (HA1) Illustrate border-segmented images color coded for cell area (HL), AR; (MQ), hexagonality (RV), and neighbors (WA1) for all five RPE subpopulations. Heatmap scale for cell area (range, 50 to 1,250 µm2) is shown on top-right corner of L, for AR (range 1 to 3 arbitrary units) on top-right corner of Q, for hexagonality (range, 1 to 10 arbitrary units) on top-right corner of V, and for neighbors (range, 1 to 9) on top-right corner of A1.
Fig. 3.
Fig. 3.
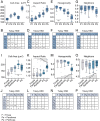
Graphs showing morphometric differences between RPE subpopulations. (AH) Morphometric data for each individual RPE cell in each of the five RPE subpopulations (P1 to P5) were collected using the REShAPE Selection Tool and quantified for cell area in square micrometers.(A), AR in arbitrary units 1 to 3 (C), hexagonality in arbitrary units 1 to 10 (E), and neighbors 1 to 14 (G) (box limits represent the first and third quartile, the central line shows the median and the whiskers indicate the 5th and 95th percentile). (B, D, F, and H) Corresponding statistical analysis of each RPE subpopulation and shape metric is presented as pairwise comparisons tables performed using Tukey test. (A linear mixed-effects model and a Tukey test for multiple comparisons were performed, n = 17; ***P < 0.001, **P < 0.01, *P < 0.05; SI Appendix, Tables S6–S9). (IP) Shape-metric comparison of P4 with the three known macular populations—fovea, parafovea, and perifovea—and P2 for cell area (I), AR (K), hexagonality (M), and neighbors (O) (box limits represent the first and third quartile, the central line shows the median and the whiskers indicate the 5th and 95th percentile. ***P < 0.001). (J, L, N, and P) Corresponding statistical analysis of each RPE subpopulation and shape metric is presented as pairwise comparisons tables performed using Tukey test. (A linear mixed-effects model and a Tukey test for multiple comparisons were performed, n = 17; ***P < 0.001, **P < 0.01, *P < 0.05; SI Appendix, Tables S10 and S11). HSD, honest significant difference; ns, not significant.
Fig. 4.
Fig. 4.
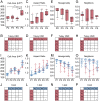
Graphs showing morphometric differences between RPE subpopulations in AMD and non-AMD donor eyes. (A, C, E, and G) Quantification of each RPE subpopulation for cell area (square micrometers) (A); AR (C); hexagonality (E); and number of neighbors (G) presented as boxplots (box limits represent the first and third quartile, the central line shows the median and the whiskers indicate the 5th and 95th percentile. **P < 0.01, *P < 0.05). (B, D, F, and H) Corresponding statistical analysis table for cell area (B), AR (D), hexagonality (F), and number of neighbors (H) presented for pairwise comparisons with Tukey test. (A linear mixed-effects model and a Tukey test for multiple comparisons were performed, n = 5; **P < 0.01, *P < 0.05; SI Appendix, Tables S16–S18). (I, K, M, and O) Quantification of each RPE subpopulation for cell area (square micrometers) (I), AR (K), hexagonality (M), and number of neighbors (O) for AMD (red) and non-AMD donors (blue) are presented side by side to show the differences (the error bars indicate the 5th and 95th percentile). (J, L, N, and P) Corresponding tables of statistical analysis for cell area (J), AR (L), hexagonality (N), and number of neighbors (P) where AMD and non-AMD measurements for each RPE subpopulation were compared with t test; *P < 0.05. HSD, honest significant difference.
Fig. 5.
Fig. 5.
Far-peripheral RPE subpopulation P5 contains sub-RPE deposits reminiscent of macular RPE P1. (A and B) Low- and high-magnification (Inset) images of P4 RPE subpopulation stained with phalloidin (white) dye (A) and RPE cell areas color coded (B) reveal lesions in non-AMD donor RPE flatmounts. (C) Three-dimensional imaging of a piece of retina and RPE over the area of RPE lesion stained with phalloidin (white) and PNA (magenta) dyes reveals intact RPE and photoreceptors in the area of lesions. Asterisks mark sub-RPE deposits in the lesion area (n = 3 donors). (D and E) The quantity of lesioned (lifted) RPE for each population was calculated as a percentage of the area of not-segmented cells for both non-AMD (D) and AMD donor (E) eyes. Far-peripheral subpopulation P5 contains more lesions than midperipheral population P3 in non-AMD eyes (n = 17). The same tendency is observed in AMD eyes, although the variability between each donor is greater (n = 5) (box limits represent the first and third quartile, the central line shows the median and the whiskers indicate the 5th and 95th percentile. One-way ANOVA and Tukey test for multiple comparisons were performed; *P < 0.05). Note that for AMD eyes our quantification does not distinguish between geographic atrophies and lesions due to sub-RPE deposits. ONL, outer nuclear layer.
Fig. 6.
Fig. 6.
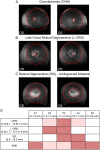
Different retinal diseases affect different RPE subpopulations. (AC) Right (OD) and Left (OS) eye fundus images of patients affected by CHM (A) and L-ORD (B) and a patient with RD with an undiagnosed mutation (C) with RPE degeneration in different regions of the eye. Red circles higlight the inner and outer boundaries of the areas of retinal degeneration. (D) Table summarizes defects in RPE subpopulations in different forms of RDs [mean ± SD of radii (in millimeters) of inner and outer limits of atrophic regions]. Red boxes correspond to fully affected RPE subpopulations, dotted red boxes correspond to partially affected subpopulations, while white boxes indicate unaffected subpopulations.

Similar articles

Cited by

References

    1. Bharti K., Miller S. S., Arnheiter H., The new paradigm: Retinal pigment epithelium cells generated from embryonic or induced pluripotent stem cells. Pigment Cell Melanoma Res. 24, 21–34 (2011). - PMC - PubMed
    1. Sharma R., Bose D., Maminishkis A., Bharti K., Retinal pigment epithelium replacement therapy for age-related macular degeneration: Are we there yet? Annu. Rev. Pharmacol. Toxicol. 60, 553–572 (2020). - PMC - PubMed
    1. Kuntz C. A., et al. , Sub-retinal pigment epithelial deposits in a dominant late-onset retinal degeneration. Invest. Ophthalmol. Vis. Sci. 37, 1772–1782 (1996). - PubMed
    1. Jacobson S. G., Cideciyan A. V., Wright E., Wright A. F., Phenotypic marker for early disease detection in dominant late-onset retinal degeneration. Invest. Ophthalmol. Vis. Sci. 42, 1882–1890 (2001). - PubMed
    1. Styles C. J., Dhillon B., Wright A. F., The diagnosis of autosomal dominant late-onset retinal degeneration in two sisters. Eye 17, 530–532 (2003). - PubMed

Publication types