

Dnmt1a is essential for gene body methylation and the regulation of the zygotic genome in a wasp
- PMID: 35522715
- PMCID: PMC9075658
- DOI: 10.1371/journal.pgen.1010181
Dnmt1a is essential for gene body methylation and the regulation of the zygotic genome in a wasp
Abstract
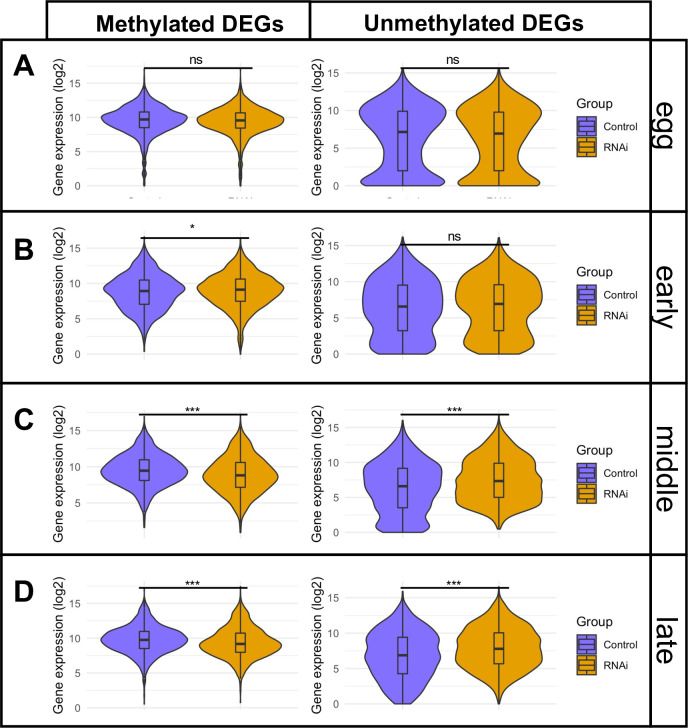
Gene body methylation (GBM) is an ancestral mode of DNA methylation whose role in development has been obscured by the more prominent roles of promoter and CpG island methylation. The wasp Nasonia vitripennis has little promoter and CpG island methylation, yet retains strong GBM, making it an excellent model for elucidating the roles of GBM. Here we show that N. vitripennis DNA methyltransferase 1a (Nv-Dnmt1a) knockdown leads to failures in cellularization and gastrulation of the embryo. Both of these disrupted events are hallmarks of the maternal-zygotic transition (MZT) in insects. Analysis of the embryonic transcriptome and methylome revealed strong reduction of GBM and widespread disruption of gene expression during embryogenesis after Nv-Dnmt1a knockdown. Strikingly, there was a strong correlation between loss of GBM and reduced gene expression in thousands of methylated loci, consistent with the hypothesis that GBM directly facilitates high levels of transcription. We propose that lower expression levels of methylated genes due to reduced GBM is the crucial direct effect of Nv-Dnmt1 knockdown. Subsequently, the disruption of methylated genes leads to downstream dysregulation of the MZT, culminating in developmental failure at gastrulation.
Conflict of interest statement
The authors have declared that no competing interests exist.
Figures


Similar articles
-
DNA methylation plays a crucial role during early Nasonia development.Insect Mol Biol. 2012 Feb;21(1):129-38. doi: 10.1111/j.1365-2583.2011.01121.x. Epub 2011 Nov 28. Insect Mol Biol. 2012. PMID: 22122805
-
Allele-Specific Transcriptome and Methylome Analysis Reveals Stable Inheritance and Cis-Regulation of DNA Methylation in Nasonia.PLoS Biol. 2016 Jul 5;14(7):e1002500. doi: 10.1371/journal.pbio.1002500. eCollection 2016 Jul. PLoS Biol. 2016. PMID: 27380029 Free PMC article.
-
Whole-genome DNA methylation profile of the jewel wasp (Nasonia vitripennis).G3 (Bethesda). 2014 Mar 20;4(3):383-8. doi: 10.1534/g3.113.008953. G3 (Bethesda). 2014. PMID: 24381191 Free PMC article.
-
Function and evolution of DNA methylation in Nasonia vitripennis.PLoS Genet. 2013;9(10):e1003872. doi: 10.1371/journal.pgen.1003872. Epub 2013 Oct 10. PLoS Genet. 2013. PMID: 24130511 Free PMC article.
-
Zygotic genome activation during the maternal-to-zygotic transition.Annu Rev Cell Dev Biol. 2014;30:581-613. doi: 10.1146/annurev-cellbio-100913-013027. Epub 2014 Aug 11. Annu Rev Cell Dev Biol. 2014. PMID: 25150012 Free PMC article. Review.
Cited by
-
Exploring the ageing methylome in the model insect, Nasonia vitripennis.BMC Genomics. 2024 Mar 22;25(1):305. doi: 10.1186/s12864-024-10211-7. BMC Genomics. 2024. PMID: 38519892 Free PMC article.
-
Neuromodulators and neuroepigenetics of social behavior in ants.Ann N Y Acad Sci. 2023 Oct;1528(1):5-12. doi: 10.1111/nyas.15055. Epub 2023 Aug 15. Ann N Y Acad Sci. 2023. PMID: 37581481 Free PMC article. Review.
-
The role of Dmnt1 during spermatogenesis of the insect Oncopeltus fasciatus.Epigenetics Chromatin. 2023 Jul 1;16(1):28. doi: 10.1186/s13072-023-00496-5. Epigenetics Chromatin. 2023. PMID: 37393253 Free PMC article.
-
Annelid methylomes reveal ancestral developmental and aging-associated epigenetic erosion across Bilateria.Genome Biol. 2024 Aug 1;25(1):204. doi: 10.1186/s13059-024-03346-z. Genome Biol. 2024. PMID: 39090757 Free PMC article.
-
5mC modification orchestrates choriogenesis and fertilization by preventing prolonged ftz-f1 expression.Nat Commun. 2023 Dec 12;14(1):8234. doi: 10.1038/s41467-023-43987-5. Nat Commun. 2023. PMID: 38086980 Free PMC article.
