Review
. 2023 Feb 1;96(1142):20220063.
doi: 10.1259/bjr.20220063. Epub 2022 May 10.

Imaging of bone marrow pitfalls with emphasis on MRI

Affiliations
Review

Imaging of bone marrow pitfalls with emphasis on MRI

Asif Saifuddin et al. Br J Radiol. .

Abstract

Normal marrow contains both hematopoietic/red and fatty/yellow marrow with a predictable pattern of conversion and skeletal distribution on MRI. Many variations in normal bone marrow signal and appearances are apparent and the reporting radiologist must differentiate these from other non-neoplastic, benign or neoplastic processes. The advent of chemical shift imaging has helped in characterising and differentiating more focal heterogeneous areas of red marrow from marrow infiltration. This review aims to cover the MRI appearances of normal marrow, its evolution with age, marrow reconversion, variations of normal marrow signal, causes of oedema-like marrow signal, and some common non-neoplastic entities, which may mimic marrow neoplasms.


Figures

Figure 1.
Figure 1.
A 13-year-old girl presenting with left knee pain. (a) Sagittal T1W TSE and (b) coronal STIR MR images show a bone marrow oedema pattern either side-of the proximal tibial physis (arrows), the features being those of a focal periphyseal oedema zone (FOPE) lesion.
Figure 2.
Figure 2.
A 19-year-old female who presented with medial shin pain and swelling. (a) Coronal T1W TSE and (b) STIR MR images show prominent oedema-like marrow signal intensity (arrows) in the proximal tibial metaphysis and reactive pes anserinus bursitis (arrowheads). (c) Coronal CT MPR demonstrates the intracortical osteoid osteoma nidus (arrow) with associated endosteal sclerosis and periosteal response (arrowheads).
Figure 3.
Figure 3.
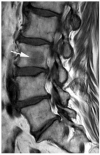
A 65-year-old female referred for investigation of an incidental lesion in the L3 vertebral body. Sagittal T1W TSE MR image of the lumbar spine shows an oval lesion (arrow) which is hyperintense to both the intervertebral disc and skeletal muscle consistent with a focal area of red marrow.
Figure 4.
Figure 4.
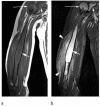
A 37-year-old male with known myelodysplastic syndrome who presented with right shoulder pain. (a) Coronal T1W TSE and (b) axial SPAIR MR images show diffuse reduction of T1W marrow SI in the proximal humeral metaphysis and glenoid (arrows-a) with corresponding increased marrow SI on the SPAIR sequence (arrows). The marrow is still hyperintense to skeletal muscle on T1 indicating marrow reconversion as opposed to marrow replacement from a neoplastic process.
Figure 5.
Figure 5.
A 10-year-old boy with a Ewing sarcoma arising from the right pubic bone. (a) Coronal T1W TSE MR image at presentation shows the primary tumour (arrow) with normal fatty marrow in the imaged portion of the pelvis and proximal femora. (b) Coronal T1W TSE MR image of the pelvis and (c) Sagittal T1W TSE MR image of the spine following neoadjuvant chemotherapy show widespread diffuse reduction of marrow SI due to marrow hyperplasia following granulocyte-colony stimulating factor treatment, but mimicking metastatic disease.
Figure 6.
Figure 6.
A 20-year-old female with known sickle cell disease imaged for right arm pain due to a possible bone tumour. (a) Coronal T1W TSE and (b) STIR MR images show an expansile lesion in the humeral diaphysis (arrows) with an associated inflammatory soft tissue mass (arrowheads-b). The lesion demonstrates a ‘penumbra sign’ on T1W, the overall features being consistent with subacute osteomyelitis. Note the underlying red marrow hyperplasia (thin arrows).
Figure 7.
Figure 7.
A 93-year-old male with known bladder cancer who presented with an undisplaced fracture of the right femoral neck. Marrow changes were thought to be secondary to metastases. (a) Coronal T1W TSE MR image of the pelvis shows heterogeneous reduction of T1W marrow SI (arrows). (b) Coronal CT MPR of the abdomen and pelvis shows diffuse medullary sclerosis throughout the spine (arrows) and moderate splenomegaly (arrowhead), the combined features being consistent with myelofibrosis.
Figure 8.
Figure 8.
A 78-year-old female with known breast cancer. (a) Sagittal T1W TSE and (b) coronal T2W FSE MR images of the lumbar spine show diffuse profound reduction of marrow SI, shown on biopsy to be due to osteoblastic metastatic disease.
Figure 9.
Figure 9.
A 79-year-old male with an incidentally identified left sacral alar marrow lesion. (a) Coronal T1W TSE, (b) sagittal T2W FSE and (c) coronal STIR MR images show an irregular oval lesion (arrows-a,b) which is slightly hyperintense to skeletal muscle on T1W and hypointense on T2W, but is occult on STIR. There is no reactive marrow oedema. (d) In-phase and (e) out-of-phase T1W GrE chemical shift imaging shows very marked SI drop on the out-of-phase sequence calculated at 85% indicating a significant fat content allowing a confident diagnosis of FNMH.
Figure 10.
Figure 10.
A 51-year-old male being investigated for low back pain. (a) Sagittal T2W FSE and (b) axial T1W TSE MR images show an incidental area of reduced marrow SI in the left side-of T12 (arrows-a,b). (c) In-phase and (d) out-of-phase T1W GrE chemical shift imaging shows apparent increased SI on the out-of-phase sequence. However, following actual ROI measurements, a SI drop of 58% was calculated indicating a significant fat content allowing a diagnosis of focal nodular marrow hyperplasia.
Figure 11.
Figure 11.
A 49-year-old female investigated for low back pain. (a) Coronal T1W TSE and (b) axial T2W FSE MR images of the lumbosacral junction show an area of reduced T1W and T2W SI in the left side-of L5 (arrows) which has a rim of T2W hyperintensity (arrowhead-b) consistent with a ‘halo’ sign. Biopsy revealed a diagnosis of breast metastasis.
Figure 12.
Figure 12.
A 46-year-old male who presented with non-traumatic left hip pain. (a) Coronal PDW FSE, (b) axial SPAIR and (c) axial oblique T2*W GrE MR images of the left acetabulum demonstrate no obvious marrow lesion on the PDW FSE image although there is mild increased SI in the adjacent soft tissues (arrows-a). Increased marrow SI is seen on the SPAIR image (arrow-b) which could be consistent with oedema-like marrow SI, but the increased SI on the T2*W GrE image (arrow-c) is not consistent with OLMSI. No T1W TSE sequence had been obtained, and a diagnosis of occult fracture was made. A year later, the patient re-presented with progression of the marrow abnormality and a large extraosseous soft issue mass, diagnosed as high-grade chondrosarcoma.
Figure 13.
Figure 13.
A 66-year-old female who presented with acute onset low back pain. (a) Sagittal T1W TSE and (b) sagittal STIR MR images demonstrates oedema-like marrow signal intensity in the L3 vertebra (arrows) with some residual marrow fat evident. A transverse hypointense fracture line (arrowhead-b) is also present, and there is a healed benign-vertebral compression fracture at the level below. The combined features are consistent with an acute benign vertebral compression fracture.
Figure 14.
Figure 14.
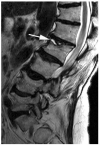
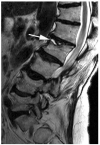
An elderly patient who presented with low back pain. Sagittal T2W FSE MR image shows a linear area of fluid SI (arrow) at the anterosuperior aspect of the L2 vertebral body where there is a compression fracture of the superior endplate, the ‘fluid sign’ being significantly associated with benign vertebral compression fractures.
Figure 15.
Figure 15.
A 77-year-old female who presented with left buttock pain. (a) Coronal oblique T1W TSE and (b) axial SPAIR MR images demonstrate oedema-like marrow signal intensity within the left sacral ala (arrows) together with a hypointense fracture line (arrowhead-b) running perpendicular to the cortex indicative of a sacral insufficiency fracture.
Figure 16.
Figure 16.
(a) A 26-year-old female who presented with acute right hip pain. Coronal T1W TSE MR image shows a fracture (arrows) through the inferior aspect of the femoral neck with oedema-like marrow signal intensity in the adjacent bone (arrowheads), indicative of a non-pathological fracture. (b) A 79-year-old male who presented with acute left hip pain. Coronal T1W TSE MR image shows a displaced intertrochanteric fracture (arrow) with a relatively well-defined area of marrow replacement in the adjacent bone (arrowheads), indicative of a pathological fracture.
Figure 17.
Figure 17.
A 3-year-old boy who presented with knee pain and swelling. (a) Sagittal T1W TSE and (b) axial STIR MR images show prominent oedema-like marrow signal intensity (arrows) in the distal femoral metaphysis with focal residual marrow fat (arrowhead-a), periosteal elevation and soft tissue oedema (arrowheads-b) due to acute osteomyelitis.
Figure 18.
Figure 18.
A 12-year-old girl referred for the investigation of multifocal skeletal lesions. (a) Sagittal T1W TSE and (b) axial SPAIR MR images of the spine demonstrate oedema-like marrow signal intensity (arrows) within the T12 vertebra. (c) Coronal STIR MR image of the knees shows further oedema-like marrow signal intensity lesions around both knees, the combined features being typical of CRMO.
Figure 19.
Figure 19.
A 36-year-old female being investigated for low back pain. (a) Sagittal T1W TSE and (b) axial T2W FSE MR images of the lumbar spine demonstrates oedema-like marrow signal intensity (arrows) within the L4 and L5 vertebrae. (c) Sagittal CT MPR demonstrates diffuse sclerosis of L4 indicative of osteitis (arrow) and hyperostosis at the anteroinferior margin of L4 (arrowhead), the combined features being typical of SAPHO.
Figure 20.
Figure 20.
A 46-year-old female who was investigated for knee pain. (a) Sagittal T1W TSE and (b) coronal STIR MR images show an irregular area of oedema-like marrow signal intensity (arrows) in the fibular head with central fat SI (arrowheads), consistent with an immature marrow infarct.

Similar articles

Cited by

References

    1. Chiarilli MG, Delli Pizzi A, Mastrodicasa D, Febo MP, Cardinali B, Consorte B, et al. . Bone marrow magnetic resonance imaging: physiologic and pathologic findings that radiologist should know. Radiol Med 2021; 126: 264–76. doi: 10.1007/s11547-020-01239-2 - DOI - PubMed
    1. Nouh MR, Eid AF. Magnetic resonance imaging of the spinal marrow: basic understanding of the normal marrow pattern and its variant. WJR 2015; 7: 448. doi: 10.4329/wjr.v7.i12.448 - DOI - PMC - PubMed
    1. Laor T, Jaramillo D. MR imaging insights into skeletal maturation: what is normal? Radiology 2009; 250: 28–38. doi: 10.1148/radiol.2501071322 - DOI - PubMed
    1. Chan BY, Gill KG, Rebsamen SL, Nguyen JC. MR imaging of pediatric bone marrow. Radiographics 2016; 36: 1911–30. doi: 10.1148/rg.2016160056 - DOI - PubMed
    1. Bracken J, Nandurkar D, Radhakrishnan K, Ditchfield M. Normal paediatric bone marrow: magnetic resonance imaging appearances from birth to 5 years: MRI appearance of normal marrow from 0-5 years. J Med Imaging Radiat Oncol 2013; 57: 283–91. - PubMed

MeSH terms