. 2022 Jul 6;3(4):316-329.
doi: 10.1158/2643-3230.BCD-21-0128.

Distinct Patterns of Clonal Evolution Drive Myelodysplastic Syndrome Progression to Secondary Acute Myeloid Leukemia

Affiliations

Distinct Patterns of Clonal Evolution Drive Myelodysplastic Syndrome Progression to Secondary Acute Myeloid Leukemia

Tiffany Guess et al. Blood Cancer Discov. .

Abstract

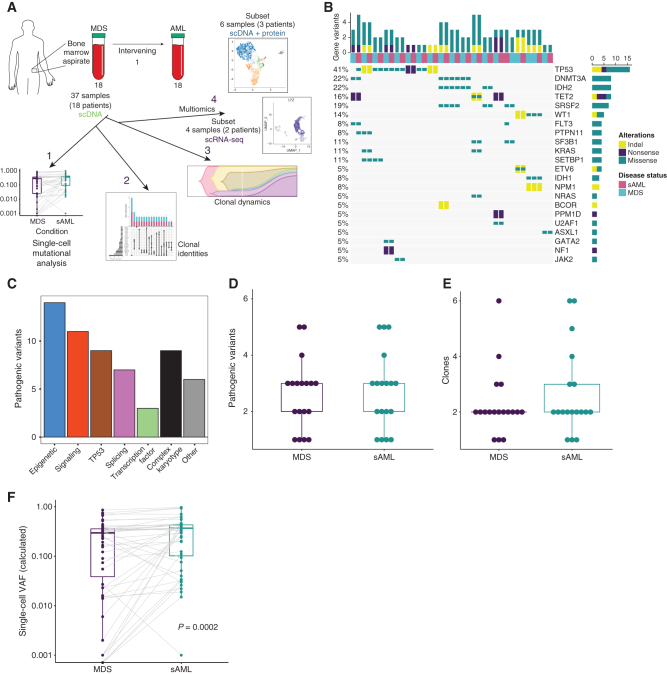
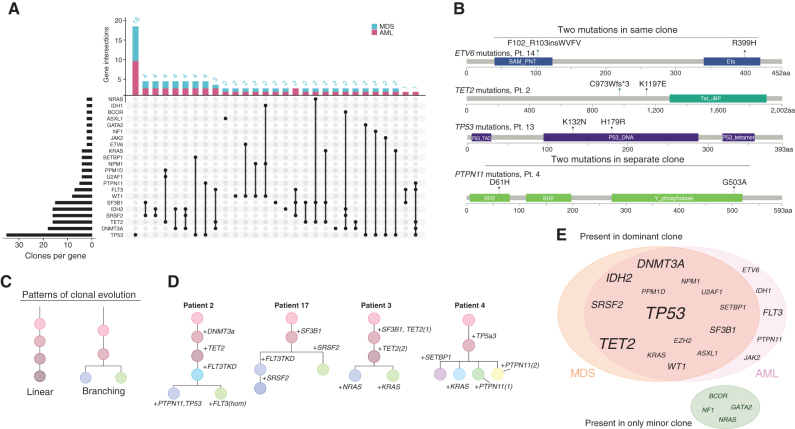
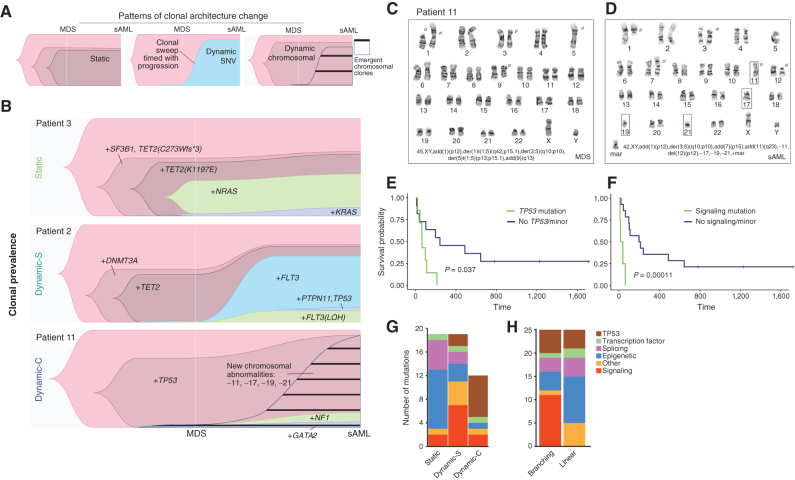
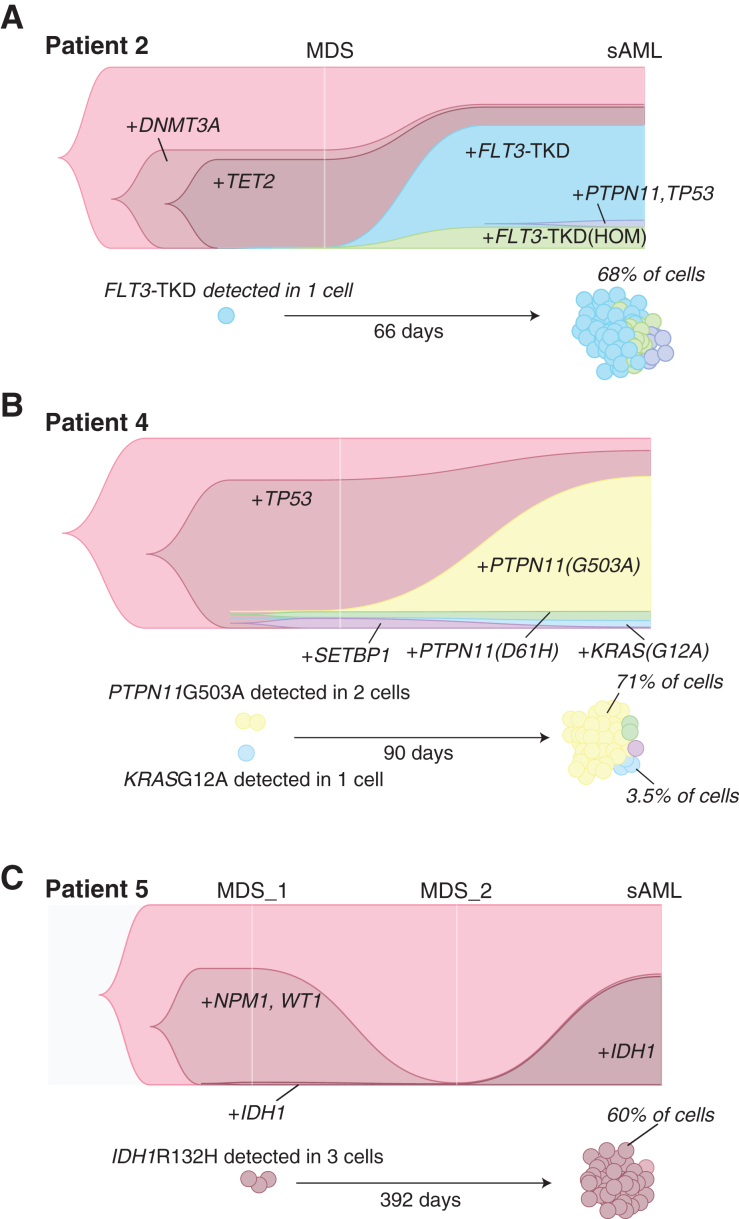
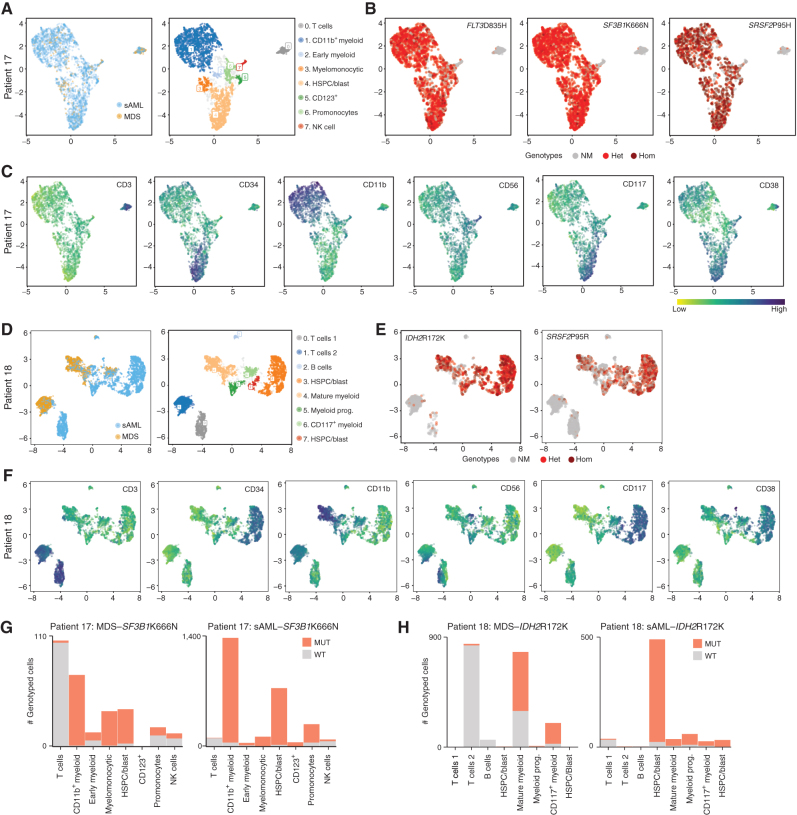
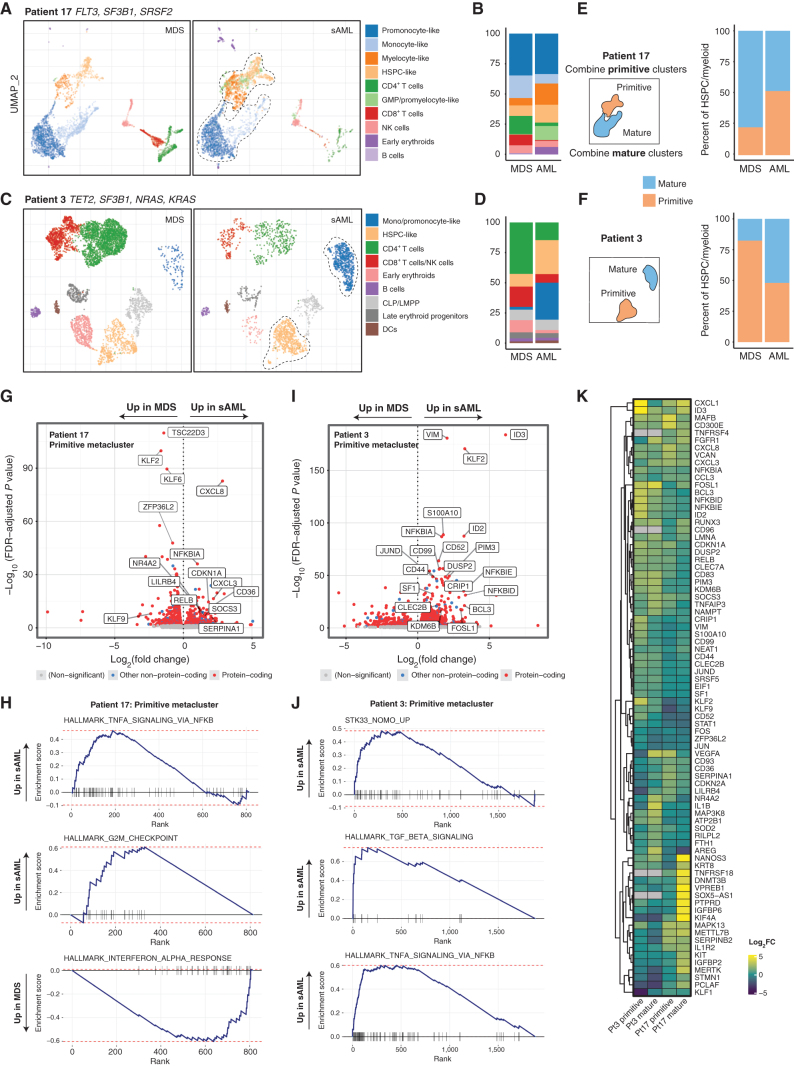
Clonal evolution in myelodysplastic syndrome (MDS) can result in clinical progression and secondary acute myeloid leukemia (sAML). To dissect changes in clonal architecture associated with this progression, we performed single-cell genotyping of paired MDS and sAML samples from 18 patients. Analysis of single-cell genotypes revealed patient-specific clonal evolution and enabled the assessment of single-cell mutational cooccurrence. We discovered that changes in clonal architecture proceed via distinct patterns, classified as static or dynamic, with dynamic clonal architectures having a more proliferative phenotype by blast count fold change. Proteogenomic analysis of a subset of patients confirmed that pathogenic mutations were primarily confined to primitive and mature myeloid cells, though we also identify rare but present mutations in lymphocyte subsets. Single-cell transcriptomic analysis of paired sample sets further identified gene sets and signaling pathways involved in two cases of progression. Together, these data define serial changes in the MDS clonal landscape with clinical and therapeutic implications.

Significance: Precise clonal trajectories in MDS progression are made possible by single-cell genomic sequencing. Here we use this technology to uncover the patterns of clonal architecture and clonal evolution that drive the transformation to secondary AML. We further define the phenotypic and transcriptional changes of disease progression at the single-cell level. See related article by Menssen et al., p. 330 (31). See related commentary by Romine and van Galen, p. 270. This article is highlighted in the In This Issue feature, p. 265.


Figures

Figure 1. Longitudinal analysis using scDNA-seq of patients progressing from MDS to sAML. A, Illustration depicting the sample workflow. B, Oncoprint of 37 patient samples generated using scDNA-seq data. Each column is a unique sample in the cohort and disease status per legend at right. Mutated genes are listed on the right of the Oncoprint, and each type of alteration is color-coded (indels/yellow, nonsense/purple, missense/teal). The percentage of samples mutated for each gene is listed on the left, and the number of genes with variants per sample is along the top. C, Bar chart depicting the number of mutations in each category in the cohort. D, Boxplot indicating the number of pathogenic variants identified at each disease state (for all boxplots in this figure, centerline represents the median, box represents the interquartile range (IQR), whiskers, 1.5 × IQR). E, Boxplot depicting the number of clones identified at each disease state. F, Boxplots representing the calculated VAFs for pathogenic variants at MDS and their respective increase or decrease at sAML. The overall difference in VAFs was calculated using the Wilcoxon rank-sum test (P = 0.0002).
Figure 1.
Longitudinal analysis using scDNA-seq of patients progressing from MDS to sAML. A, Illustration depicting the sample workflow. B, Oncoprint of 37 patient samples generated using scDNA-seq data. Each column is a unique sample in the cohort and disease status per legend at right. Mutated genes are listed on the right of the Oncoprint, and each type of alteration is color-coded (indels/yellow, nonsense/purple, missense/teal). The percentage of samples mutated for each gene is listed on the left, and the number of genes with variants per sample is along the top. C, Bar chart depicting the number of mutations in each category in the cohort. D, Box plot indicating the number of pathogenic variants identified at each disease state (for all box plots in this figure, centerline represents the median, box represents the interquartile range (IQR), whiskers, 1.5 × IQR). E, Box plot depicting the number of clones identified at each disease state. F, Box plots representing the calculated VAFs for pathogenic variants at MDS and their respective increase or decrease at sAML. The overall difference in VAFs was calculated using the Wilcoxon rank-sum test (P = 0.0002).
Figure 2. Single-cell mutational identities define clonal evolution. A, UpSet plot depicting comutational occurrences in MDS and sAML clones. The number of times a gene was involved in a clone is listed on the left side of the plot for the entire cohort. The number of times each gene combination was detected in a clone is listed at the top of the plot. B, Illustration of multiple mutations within the same gene. This phenomenon was observed in four patients, three instances occurring within the same clone and one occurring in different clones. Specific gene residues are listed in each instance. C, Patterns of clonal evolution depicted as phylogenies D, Phylogenies for samples with a branching evolution and signaling mutations. E, Venn diagram of variants in the dominant clone. Mutations in the genes listed in the green circle occurred only in minor clones at either MDS or sAML. Font size is representative of the number of times mutations were observed in each gene.
Figure 2.
Single-cell mutational identities define clonal evolution. A, UpSet plot depicting comutational occurrences in MDS and sAML clones. The number of times a gene was involved in a clone is listed on the left side of the plot for the entire cohort. The number of times each gene combination was detected in a clone is listed at the top of the plot. B, Illustration of multiple mutations within the same gene. This phenomenon was observed in four patients, three instances occurring within the same clone and one occurring in different clones. Specific gene residues are listed in each instance. C, Patterns of clonal evolution depicted as phylogenies. D, Phylogenies for samples with a branching evolution and signaling mutations. E, Venn diagram of variants in the dominant clone. Mutations in the genes listed in the green circle occurred only in minor clones at either MDS or sAML. Font size is representative of the number of times mutations were observed in each gene.
Figure 3. scDNA-seq characterizes clonal trajectories during disease progression. A, Representative Timescape plots of the three types of clonal progression observed in the cohort. B, Clonal prevalence over time of three patients, each with a distinct pattern of clonal progression from MDS to sAML: Static, Dynamic SNV, and Dynamic Chromosomal, respectively. The leftmost clone in each plot is the parent clone from which all cells were derived (no mutations detected). Karyotypes at (C) MDS and (D) sAML for patient 11 demonstrating dynamic-chromosomal clonal progression. E, Kaplan–Meier curve of sAML survival when the signaling mutation was present in the dominant clone. F, Kaplan–Meier curve for TP53 samples when present in the dominant clone (for both Kaplan–Meier curve, log-rank test P value is shown). G and H, Mutation type distribution per clonal architecture and clonal evolution pattern.
Figure 3.
scDNA-seq characterizes clonal trajectories during disease progression. A, Representative Timescape plots of the three types of clonal progression observed in the cohort. B, Clonal prevalence over time of three patients, each with a distinct pattern of clonal progression from MDS to sAML: Static, Dynamic SNV, and Dynamic Chromosomal, respectively. The leftmost clone in each plot is the parent clone from which all cells were derived (no mutations detected). Karyotypes at (C) MDS and (D) sAML for patient 11 demonstrating dynamic-chromosomal clonal progression. E, Kaplan–Meier curve of sAML survival when the signaling mutation was present in the dominant clone. F, Kaplan–Meier curve for TP53 samples when present in the dominant clone (for both Kaplan–Meier curve, log-rank test P value is shown). G and H, Mutation type distribution per clonal architecture and clonal evolution pattern.
Figure 4. Subclonal expansion of rare cells in dynamic architectural change. A, Patient 2 clonal prevalence and depiction of the expansion of rare clones with FLT3TKD from MDS to sAML. B, Patient 4 rare cell expansion of the PTPN11 subclone. C, Patient 5, rare cell expansion of the IDH1mut subclone.
Figure 4.
Subclonal expansion of rare cells in dynamic architectural change. A, Patient 2 clonal prevalence and depiction of the expansion of rare clones with FLT3-TKDmut from MDS to sAML. B, Patient 4 rare cell expansion of the PTPN11mut subclone. C, Patient 5, rare cell expansion of the IDH1mut subclone.
Figure 5. Combined protein and DNA analysis reveals mutational identities of both myeloid and lymphoid lineages. A, UMAP embeddings (patient 17) mapped on cell-surface marker levels colored by samples or by HDBSCAN clusters. Clusters were identified by immunophenotype and named for cell type by immunophenotype. B, Genotypes are shown for each mapped cell (only cells for which each genotype was known). Code for each variant is no mutation (NM), heterozygous (Het), or homozygous (Hom). C, Surface-marker expression of major markers used to define cell type. D–F, Similar to A–C, but with patient 18. G and H, Cell cluster–based analysis of the proportion of mutated cells MDS to sAML for SF3B1 (patient 17) or IDH2 (patient 18).
Figure 5.
Combined protein and DNA analysis reveals mutational identities of both myeloid and lymphoid lineages. A, UMAP embeddings (patient 17) mapped on cell-surface marker levels colored by samples or by HDBSCAN clusters. Clusters were identified by immunophenotype and named for cell type by immunophenotype. B, Genotypes are shown for each mapped cell (only cells for which each genotype was known). Code for each variant is no mutation (NM), heterozygous (Het), or homozygous (Hom). C, Surface-marker expression of major markers used to define cell type. D–F, Similar to A–C, but with patient 18. G and H, Cell cluster–based analysis of the proportion of mutated cells MDS to sAML for SF3B1 (patient 17) or IDH2 (patient 18).
Figure 6. Single-cell RNA-seq of longitudinal samples identify transcriptional gene sets that accompany disease progression. A, Gene expression-derived UMAP embedding of all cells from scRNA-seq of two samples from patient 17, clustered with HDBSCAN and then labeled by cell type according to transcriptional signature. The dotted line encapsulates primitive and mature cells (for E, F). B, Number of cells per cluster shown and change from MDS to sAML. C and D, UMAP and cluster distribution for patient 3 as in A–B. E and F, Cells mapped from each time point and patient separately with a depiction of the creation of metaclusters that are either labeled primitive or mature. G, Differentially expressed genes for primitive metacluster for patient 17, with selected top significant genes labeled. H, GSEA plots for patient 17 primitive metacluster. I, Differentially expressed genes for patient 3 primitive metacluster. J, Patient 3 GSEA plots for primitive metacluster. K, Heatmap depicting differentially expressed genes across all metaclusters with heat based on log2 fold change increase.
Figure 6.
scRNA-seq of longitudinal samples identify transcriptional gene sets that accompany disease progression. A, Gene expression-derived UMAP embedding of all cells from scRNA-seq of two samples from patient 17, clustered with HDBSCAN and then labeled by cell type according to transcriptional signature. The dotted line encapsulates primitive and mature cells (for E, F). B, Number of cells per cluster shown and change from MDS to sAML. C and D, UMAP and cluster distribution for patient 3 as in A–B. E and F, Cells mapped from each time point and patient separately with a depiction of the creation of metaclusters that are either labeled primitive or mature. G, Differentially expressed genes for primitive metacluster for patient 17, with selected top significant genes labeled. H, GSEA plots for patient 17 primitive metacluster. I, Differentially expressed genes for patient 3 primitive metacluster. J, Patient 3 GSEA plots for primitive metacluster. K, Heatmap depicting differentially expressed genes across all metaclusters with heat based on log2 fold change increase.

Comment in

References

    1. Kuykendall A, Duployez N, Boissel N, Lancet JE, Welch JS. Acute myeloid leukemia: the good, the bad, and the ugly. Am Soc Clin Oncol Educ Book 2018;38:555–73. - PubMed
    1. Bennett JM. Secondary acute myeloid leukemia. Leuk Res 1995;19:231–2. - PubMed
    1. Weinberg OK, Seetharam M, Ren L, Seo K, Ma L, Merker JD, et al. . Clinical characterization of acute myeloid leukemia with myelodysplasia-related changes as defined by the 2008 WHO classification system. Blood 2009;113:1906–8. - PubMed
    1. Nowell PC. The clonal evolution of tumor cell populations. Science 1976;194:23–8. - PubMed
    1. Greaves M, Maley CC. Clonal evolution in cancer. Nature 2012;481:306–13. - PMC - PubMed

Publication types