. 2022 May;12(5):e825.
doi: 10.1002/ctm2.825.

HSP90 N-terminal inhibitors target oncoprotein MORC2 for autophagic degradation and suppress MORC2-driven breast cancer progression

Affiliations

HSP90 N-terminal inhibitors target oncoprotein MORC2 for autophagic degradation and suppress MORC2-driven breast cancer progression

Fan Yang et al. Clin Transl Med. 2022 May.

Abstract

Aims: MORC family CW-type zinc finger 2 (MORC2), a GHKL-type ATPase, is aberrantly upregulated in multiple types of human tumors with profound effects on cancer aggressiveness, therapeutic resistance, and clinical outcome, thus making it an attractive drug target for anticancer therapy. However, the antagonists of MORC2 have not yet been documented.

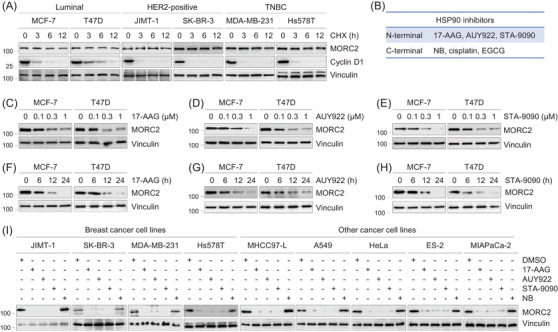
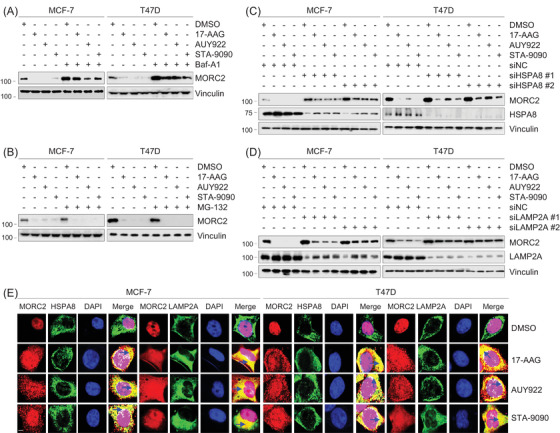
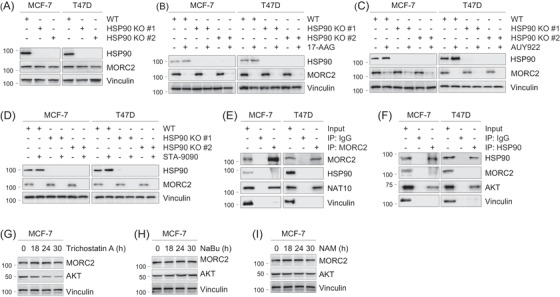
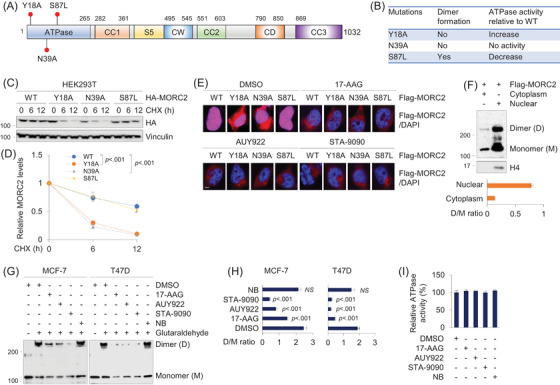
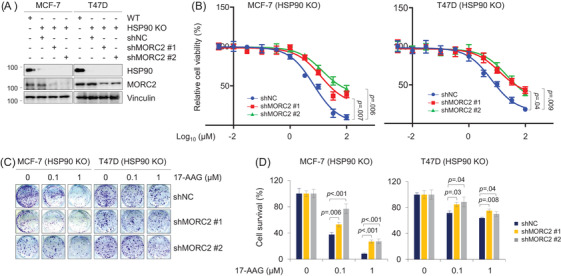
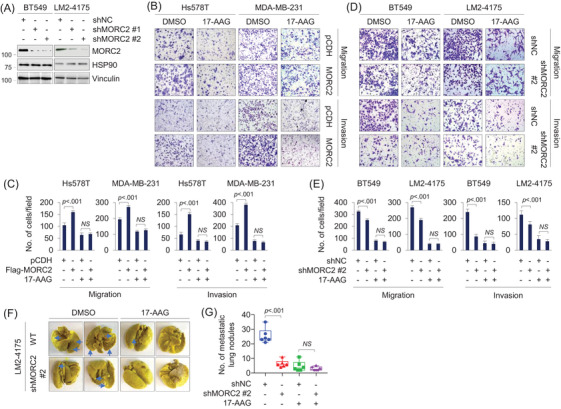
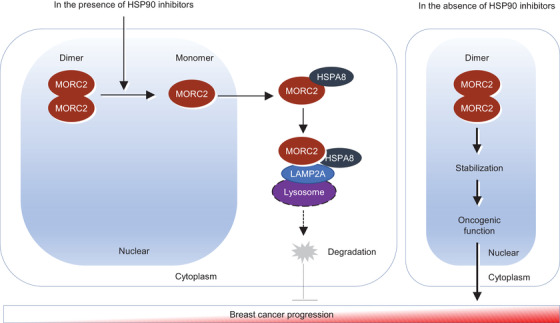
Methods and results: We report that MORC2 is a relatively stable protein, and the N-terminal homodimerization but not ATP binding and hydrolysis is crucial for its stability through immunoblotting analysis and Quantitative real-time PCR. The N-terminal but not C-terminal inhibitors of heat shock protein 90 (HSP90) destabilize MORC2 in multiple cancer cell lines, and strikingly, this process is independent on HSP90. Mechanistical investigations revealed that HSP90 N-terminal inhibitors disrupt MORC2 homodimer formation without affecting its ATPase activities, and promote its lysosomal degradation through the chaperone-mediated autophagy pathway. Consequently, HSP90 inhibitor 17-AAG effectively blocks the growth and metastatic potential of MORC2-expressing breast cancer cells both in vitro and in vivo, and these noted effects are not due to HSP90 inhibition.

Conclusion: We uncover a previously unknown role for HSP90 N-terminal inhibitors in promoting MORC2 degradation in a HSP90-indepentent manner and support the potential application of these inhibitors for treating MORC2-overexpressing tumors, even those with low or absent HSP90 expression. These results also provide new clue for further design of novel small-molecule inhibitors of MORC2 for anticancer therapeutic application.

Keywords: HSP90 inhibitor; MORC2; breast cancer; chaperone-mediated autophagy; protein degradation.


Conflict of interest statement

The authors declare that they have no conflict of interest.

Figures

FIGURE 1
FIGURE 1
HSP90 N‐terminal, but not C‐terminal, inhibitors downregulate MORC2 in multiple cancer cell lines. (A) Cells were treated with 100 μg/ml of CHX for 0, 3, 6 and 12 h, and total cellular lysates were harvested for immunoblotting analysis with the indicated antibodies. (B) Six HSP90 inhibitors used in this study. (C–E) MCF‐7 and T47D cells were treated with or without 17‐AAG (C), AUY922 (D) and STA‐9090 (E) at the indicated doses for 24 h. Total cellular lysates were harvested for immunoblotting analysis with the indicated antibodies. (F–H) MCF‐7 and T47D cells were treated with or without 1 μM of 17‐AAG (F), AUY922 (G) and STA‐9090 (H) for the indicated times. Total cellular lysates were harvested for immunoblotting analysis with the indicated antibodies. (I) Nine different cancer cell lines were treated with DMSO or 1 μM of 17‐AAG, AUY922, STA‐9090 or 10 μM of NB for 24 h. Total cellular lysates were harvested for immunoblotting analysis with the indicated antibodies
FIGURE 2
FIGURE 2
HSP90 N‐terminal inhibitors induce lysosomal degradation of MORC2 through the CMA pathway. (A) MCF‐7 and T47D cells were treated with DMSO or 1 μM of 17‐AAG, AUY922, STA‐9090 alone or in combination with 100 nM Baf A1 for 24 h. Total cellular lysates were harvested for immunoblotting analysis with the indicated antibodies. (B) MCF‐7 and T47D cells were treated with DMSO or 1 μM of 17‐AAG, AUY922, STA‐9090 alone or in combination with 10 μM MG‐132 for 24 h. Total cellular lysates were harvested for immunoblotting analysis with the indicated antibodies. (C,D) MCF‐7 and T47D cells were transfected with control siRNA (siNC) or two independent siRNAs targeting HSPA8 (siHSPA8) or LAMP2A (siLAMP2A). After 24 h of transfection, cells were treated with DMSO or 1 μM of 17‐AAG, AUY922 or STA‐9090 for 24 h. Total cellular lysates were harvested for immunoblotting analysis. (E) MCF‐7 and T47D cells were transfected with Flag‐MORC2. After 24 h of transfection, cells were treated with DMSO or 1 μM of 17‐AAG, AUY922 or STA‐9090 for 24 h, and then subjected to immunofluorescent staining with the anti‐Flag (red), anti‐HSPA8 (green) and anti‐LAMP2A (green) antibodies. DNA was counterstained with DAPI. Scale bar, 10 μm. The dark blue arrows in the merged images indicate the co‐localization of MORC2 with HSPA8 or LAMP2A in the cytoplasm (yellow colour)
FIGURE 3
FIGURE 3
Downregulation of MORC2 by HSP90 N‐terminal inhibitors is independent on HSP90. (A) Both HSP90α and HSP90β genes were knocked out in MCF‐7 and T47D cells using CRISPR/Cas9 technology. Immunoblotting analysis was performed with the indicated antibodies. (B–D) WT and HSP90 KO MCF‐7 and T47D cells were treated with DMSO or 1 μM of 17‐AAG, AUY922 or STA‐9090 for 24 h. Total cellular lysates were harvested for immunoblotting analysis. (E,F) Lysates from MCF‐7 and T47D cells were subjected to Co‐IP assays and immunoblotting analysis with the indicated antibodies. (G) MCF‐7 cells were treated with or without 5 μM of trichostatin A for the indicated times. Total cellular lysates were harvested for immunoblotting analysis with the indicated antibodies. (H) MCF‐7 cells were treated with or without 10 mM of sodium butyrate (NaBu) for the indicated times. Total cellular lysates were harvested for immunoblotting analysis with the indicated antibodies. (I) MCF‐7 cells were treated with or without 5 mM of NAM for the indicated times. Total cellular lysates were harvested for immunoblotting analysis with the indicated antibodies
FIGURE 4
FIGURE 4
HSP90 N‐terminal inhibitors disrupt MORC2 dimerization in breast cancer cells. (A) Graphic representation of MORC2 domains and site mutagenesis. (B) Summary of the effects of Y18A, N39A and S87L mutations on the dimer formation and ATPase activities of MORC2. (C,D) HEK293T cells were transfected with various HA‐MORC2 plasmids (WT, Y18A, N39A or S87L). After 36 h of transfection, cells were treated with 100 μg/ml of CHX for the indicated times and then subjected to immunoblotting analysis with the indicated antibodies (C). Relative HA‐MORC2 expression levels (HA‐MORC2/Vinculin) are shown in (D). (E) HEK293T cells were transfected with Flag‐MORC2 (WT, Y18A, N39A and S87L). After 24 h of transfection, cells were treated with DMSO or 1 μM of 17‐AAG, AUY922 or STA‐9090 for 24 h, and then subjected to immunofluorescent staining with an anti‐Flag antibody. The nuclei were counterstained with DAPI. Scale bar, 10 μm. (F) HEK293T cells we transfected with Flag‐MORC2. After 48 h of transfection, cells were subjected to cytosol‐nucleus cell fractionation assays, followed by chemical cross‐linking experiment. The quantitative results (dimer/monomer ratio) are shown below. (G,H) MCF‐7 and T47D cells were treated with DMSO or 1 μM of 17‐AAG, AUY922, STA‐9090 or 10 μM of NB for 12 h. Total cellular lysates were harvested for cross‐linking reactions with glutaraldehyde (G). Dimer/monomer ratio is shown (H). (I) Immunoprecipitated Flag‐MORC2 was incubated with 1 μM 17‐AAG, AUY922, STA‐9090 and NB for 1 h at room temperature in the presence of 4 mM ATP. The absorbance at 620 nm was read and analysed
FIGURE 5
FIGURE 5
Knockdown of MORC2 reduces the sensitivity of breast cancer cells to 17‐AAG (A) Immunoblotting analysis of HSP90 KO MCF‐7 and T47D cells stably expressing shNC and shMORC2 with the indicated antibodies. The quantitation of immunoblotting bands was performed using ImageJ software. (B) HSP90 KO MCF‐7 and T47D cells stably expressing shNC and shMORC2 were treated with increasing doses of 17‐AAG for 3 days. Cell viability was assessed using CCK‐8 kit. Cell viability (%) was plotted against the log concentration of 17‐AAG. Each dot and error bar on the curves represents mean ± SD (n = 3). All experiments were repeated three times. (C,D) HSP90 KO MCF‐7 and T47D cells stably expressing shNC and shMORC2 were treated with 17‐AAG at the indicated doses and subjected to colony formation survival assays (C). Quantitative results are shown in (D)
FIGURE 6
FIGURE 6
17‐AAG suppresses MORC2‐indcued breast cancer migration, invasion and metastasis. (A) Immunoblotting analysis of BT549 and LM2‐4175 cells stably expressing shNC and shMORC2 with the indicated antibodies. The quantitation of immunoblotting bands was performed using ImageJ software. (B,C) Hs578T and MDA‐MB‐231 cells stably expressing pCDH and Flag‐MORC2 were subjected to Transwell migration and Matrigel invasion assays in the presence or absence of 1 μM of 17‐AAG. Representative images are shown in (C) and corresponding quantitative results are shown in (C). (D,E) BT549 and LM2‐4175 cells stably expressing shNC and shMORC2 were subjected to Transwell migration and Matrigel invasion assays in the presence or absence of 1 μM of 17‐AAG. Representative images are shown in (E) and corresponding quantitative results are shown in (E). (F,G) LM2‐4175 cells stably expressing shNC and shMORC2 were injected into nude mice (n = 6) through the tail vein and treated with DMSO or 17‐AAG (60 mg/kg/d). The lungs were harvested after 3 weeks of treatment. Representative images of lung metastasis and corresponding quantitative results of lung nodules are shown in (F) and (G), respectively
FIGURE 7
FIGURE 7
The proposed working model. HSP90 N‐terminal inhibitors target MORC2 for lysosomal degradation through disrupting its N‐terminal homodimerization, and consequently, block MORC2‐mediated breast cancer progression (left). In contrast, in the absence of HSP90 N‐terminal inhibitors, dimer formation leads to an increase of protein stability of MORC2, thus manifesting its oncogenic functions (right)

Similar articles

Cited by

References

    1. Bell O, Tiwari VK, Thoma NH, Schubeler D. Determinants and dynamics of genome accessibility. Nat Rev Genet. 2011;12(8):554‐564. - PubMed
    1. Narlikar GJ, Sundaramoorthy R, Owen‐Hughes T. Mechanisms and functions of ATP‐dependent chromatin‐remodeling enzymes. Cell. 2013;154(3):490‐503. - PMC - PubMed
    1. Dutta R, Inouye M. GHKL, an emergent ATPase/kinase superfamily. Trends Biochem Sci. 2000;25(1):24‐28. - PubMed
    1. Li DQ, Nair SS, Kumar R. The MORC family: new epigenetic regulators of transcription and DNA damage response. Epigenetics. 2013;8(7):685‐693. - PMC - PubMed
    1. Tchasovnikarova IA, Timms RT, Douse CH, et al. Hyperactivation of HUSH complex function by Charcot‐Marie‐Tooth disease mutation in MORC2. Nat Genet. 2017;49(7):1035‐1044. - PMC - PubMed

Publication types

MeSH terms