. 2022 May;12(5):e738.
doi: 10.1002/ctm2.738.

NAT10-mediated mRNA N4-acetylcytidine modification promotes bladder cancer progression

Affiliations

NAT10-mediated mRNA N4-acetylcytidine modification promotes bladder cancer progression

Ganping Wang et al. Clin Transl Med. 2022 May.

Abstract

Background: Dysregulation of the epitranscriptome causes abnormal expression of oncogenes in the tumorigenic process. Previous studies have shown that NAT10 can regulate mRNA translation efficiency through RNA acetylation. However, the role of NAT10-mediated acetylation modification in bladder cancer remains elusive.

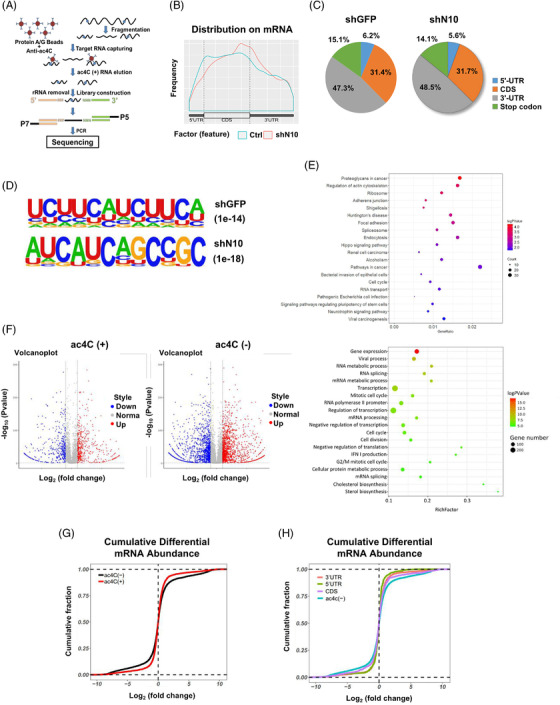
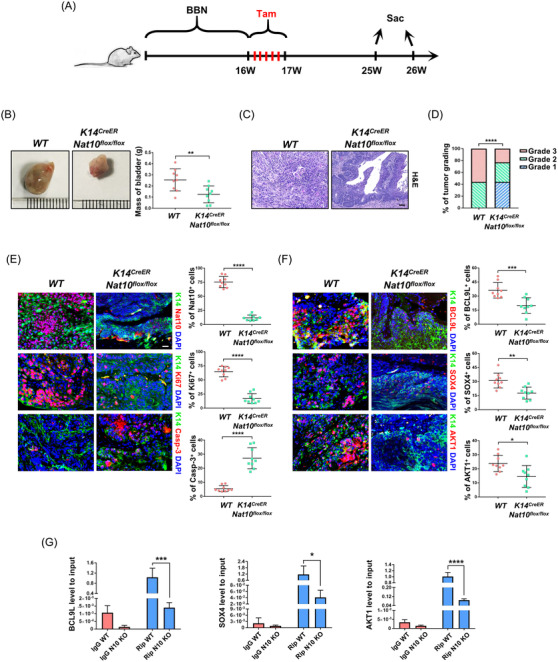
Methods: The clinical value of NAT10 was estimated according to NAT10 expression pattern based on TCGA data set and the tumor tissue array. Acetylated RNA immunoprecipitation sequencing was utilized to explore the role of NAT10 in mRNA ac4C modification. Translation efficiency and mRNA stability assay were applied to study the effect of NAT10-deletion on target genes. The nude mouse model and genetically engineered mice were conducted to further verify the characteristics of NAT10 in promoting BLCA progression and regulating downstream targets.

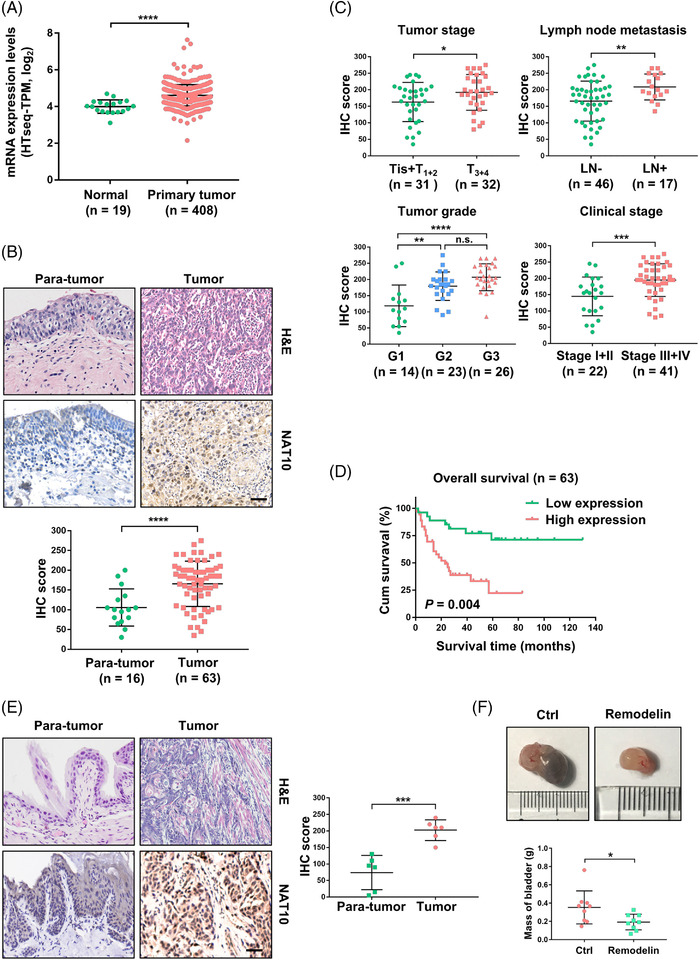
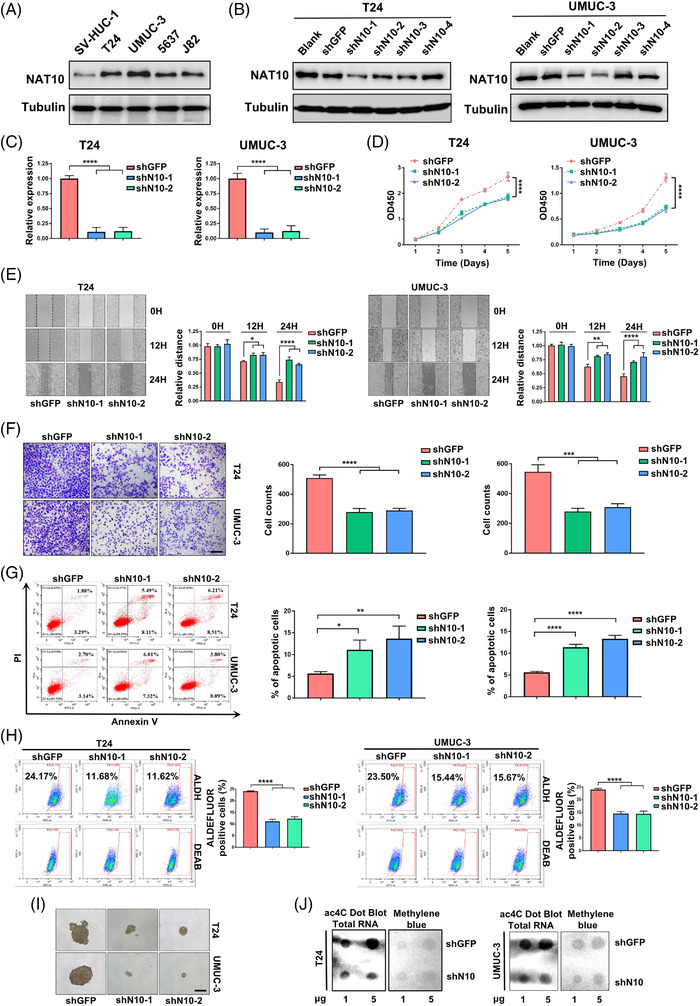
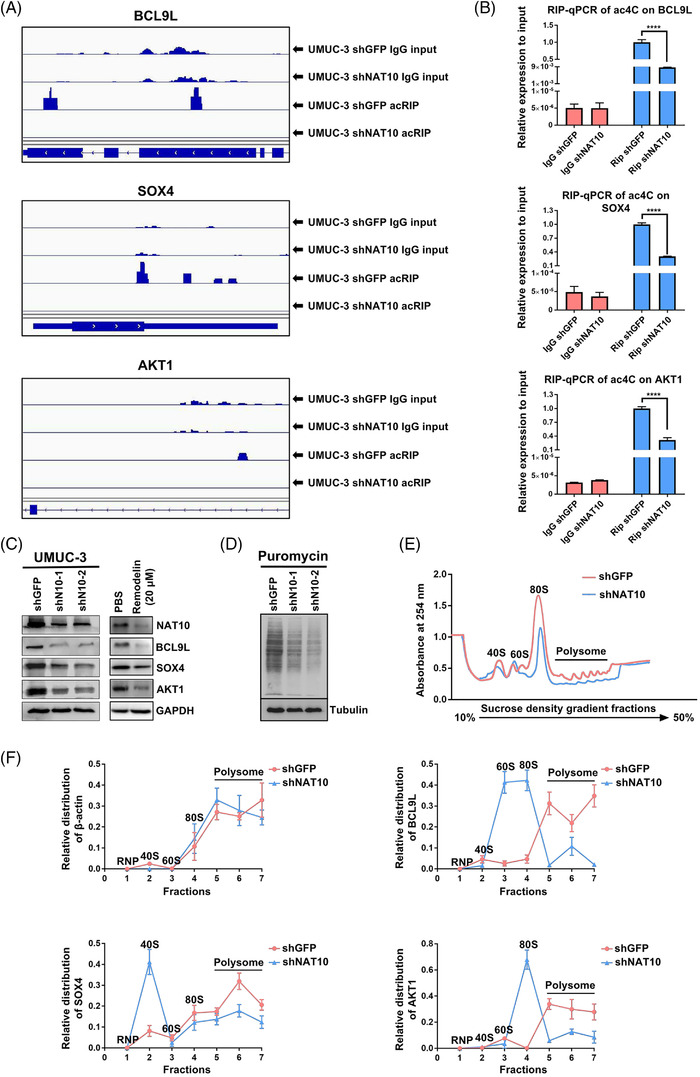
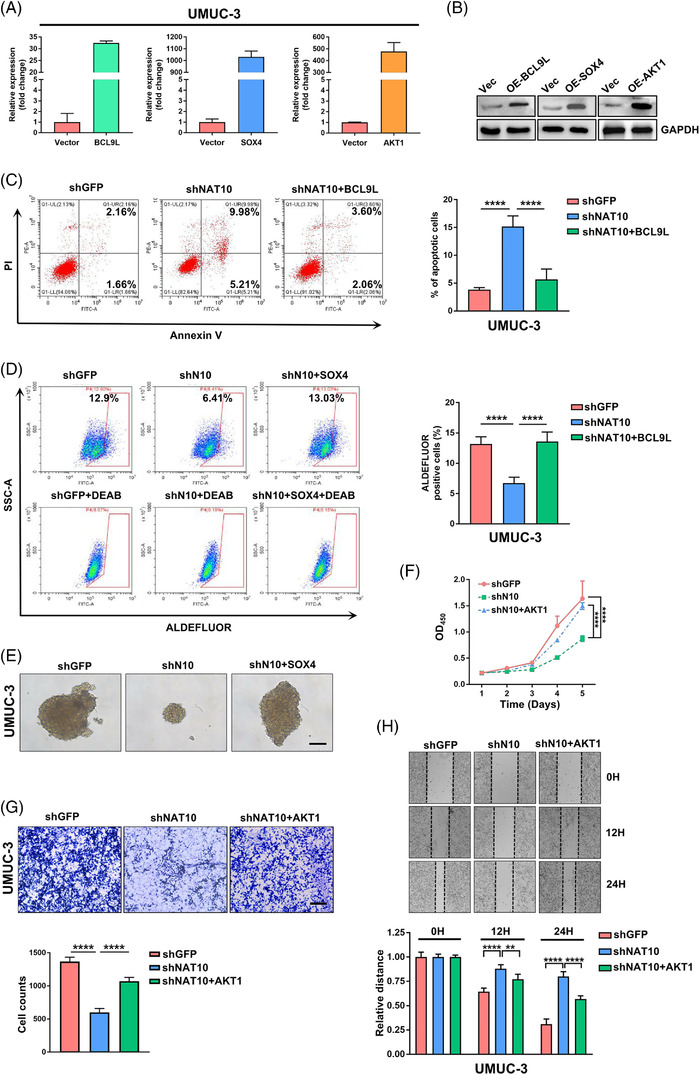
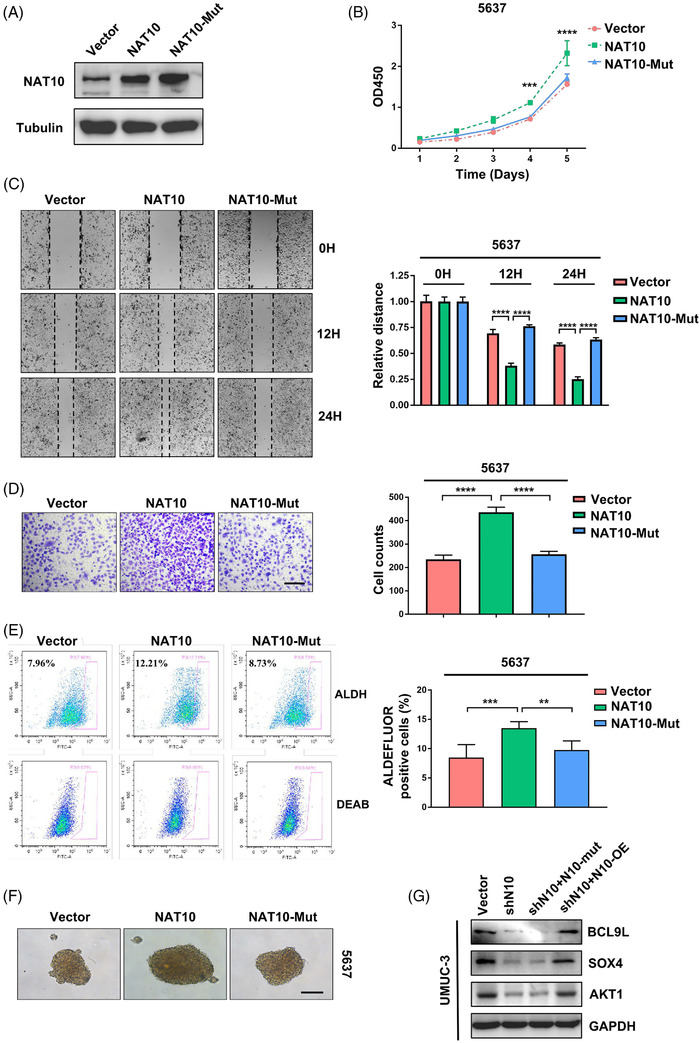
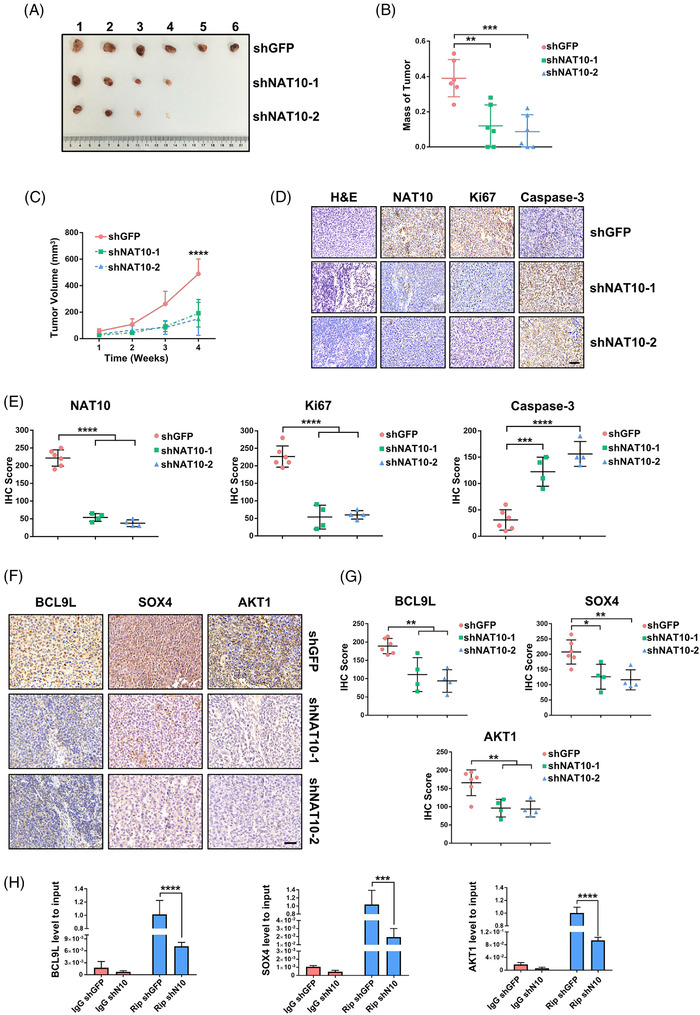
Results: NAT10 was essential for the proliferation, migration, invasion, survival and the stem-cell-like properties of bladder cancer cell lines. NAT10 was responsible for mRNA ac4C modification in BLCA cells, including BCL9L, SOX4 and AKT1. Deficient NAT10 in both xenograft and transgenic mouse models of bladder cancer reduced the tumor burden. Furthermore, acetylated RNA immunoprecipitation sequencing data and RNA immunoprecipitation qPCR results revealed that NAT10 is responsible for a set of ac4C mRNA modifications in bladder cancer cells. Inhibition of NAT10 led to a loss of ac4C peaks in these transcripts and represses the mRNA's stability and protein expression. Mechanistically, the ac4C reduction modification in specific regions of mRNAs resulting from NAT10 downregulation impaired the translation efficiency of BCL9L, SOX4 and AKT1 as well as the stability of BCL9L, SOX4.

Conclusions: In summary, these findings provide new insights into the dynamic characteristics of mRNA's post-transcriptional modification via NAT10-dependent acetylation and predict a role for NAT10 as a therapeutic target in bladder cancer.

Highlights: NAT10 is highly expressed in BLCA patients and its abnormal level predicts bladder cancer progression and low overall survival rate. NAT10 is necessary and sufficient for BLCA tumourigenic properties. NAT10 is responsible for ac4C modification of target transcripts, including BCL9L, SOX4 and AKT1. NAT10 may serve as an effective and novel therapeutic target for BLCA.

Keywords: N4-acetylcytidine; NAT10; bladder cancer; mRNA.


Conflict of interest statement

The authors have declared that no conflict of interest exists.

Figures

FIGURE 1
FIGURE 1
NAT10 is overexpressed in bladder urothelial carcinoma. (A) The mRNA level of NAT10 in bladder urothelial carcinoma based on TCGA dataset. (B) Representative H&E staining and IHC images of bladder cancer tissue microarrays to show the histology and expression of NAT10 in tumours or corresponding normal tissues. (C) The relationship between NAT10 expression and clinical features in patients with bladder cancer according to the tissue microarray. (D) Effect of NAT10 expression level on BLCA patient overall survival. (E) Representative H&E staining and NAT10 IHC images in mouse bladder cancer tissues and the corresponding normal tissues and the IHC score quantification (n = 6). Scale bars: 50 μm. (F) Representative images showing NAT10 inhibitor Remodelin significantly prevented bladder tumour growing (*p < .05, n = 9)
FIGURE 2
FIGURE 2
Knockdown of NAT10 suppresses tumourigenesis of BLCA cells. (A) Detection of NAT10 protein expression in uroepithelial cells and bladder cancer cell lines. (B) Validation of shRNAs against NAT10 knockdown efficiency by Western Blot in T24 and UMUC‐3 cell lines. (C) Determination of mRNA level after knocking down NAT10 by qPCR. The level of NAT10 mRNA is decreased by about 89% (shNAT10‐1) and 88% (shNAT10‐2) respectively in T24 cells. In UMUC‐3 cells, NAT10 mRNA is reduced by 90% (shNAT10‐1) and 88% (shNAT10‐2) (****p < .0001, n = 3). (D) Knockdown of NAT10 markedly inhibits proliferation of T24 and UMUC‐3 cells (****p < .0001, n = 3). (E) Migration capacity is significantly reduced follow by attenuation of NAT10 in bladder cancer cells (*p < .05, **p < .01, ****p < .0001, n = 3). (F) Downregulation of NAT10 weakens the ability of invasion in bladder cancer cell lines (****p < .0001, n = 3). (G) Inhibition of NAT10 induces the apoptosis of T24 and UMUC‐3 cells. The rate of apoptotic cells increases from 5.65% (shGFP) to 11.1% (shNAT10‐1) and 13.68% (shNAT10‐2) in T24 cells, while the proportion of apoptotic UMUC‐3 cells rises from 5.62% (shGFP) to 11.37% (shNAT10‐1) and 13.31% (shNAT10‐2) (*p < .05, **p < .01, ****p < .0001, n = 3). (H) Knockdown of NAT10 results in the reduction of cell stemness. With the use of shNAT10‐1 and shNAT10‐2 to block NAT10 expression, the percentage of ALDHbr T24 cells falls from 24.17% to 11.66% (shNAT10‐1) and 11.62 (shNAT10‐2). The rate of ALDHbr UMUC‐3 cells is decreased from 23.50% to 15.44% (shNAT10‐1) and 15.67% (shNAT10‐2) after knockdown of NAT10 (****p < .0001, n = 3; DEAB, diethylaminobenzaldehyde, an inhibitor for human ALDH). (I) Knockdown of NAT10 attenuated the ability of sphere formation in BLCA cells. Scale bars: 100 μm (n = 3). (J) Knockdown of NAT10 markedly inhibits total RNA ac4C abundance in T24 and UMUC‐3 cells
FIGURE 3
FIGURE 3
ac4C‐modified transcripts in BLCA cell lines are detected by acRIP‐sEquation (A) Schematic of acRIP‐seq for UMUC‐3 cells. (B) The distribution of ac4C‐containing peaks across mRNA in both control and NAT10 knockdown UMUC‐3 cells is displayed in metageneplot. (C) Representative pie chart of peak distribution exhibiting the proportion of total ac4C peaks in the indicated regions including 5′‐untranslated region (5′‐UTR), coding sequence (CDS), 3′‐ untranslated region (3′‐UTR) and stop codon. (D) Consensus motif of control and NAT10‐knockdown cells identified by HOMER. (E) Representative Pathway‐Analysis terms showing pathways of related genes significantly enriched by ac4C. (F) Volcano plots of differentially mRNA in control and NAT10 knockdown UMUC‐3 cells segregated by ac4C status. (G) Cumulative distribution function (CDF) plot showing differential expression of ac4C (–) or ac4C (+) transcripts in control and NAT10 knockdown UMUC‐3 cells. (H) CDF plot showing expression changes of protein‐coding genes in control and NAT10 knockdown UMUC‐3 cells for ac4C (–) and ac4C transcripts with peaks locate in the CDS, 5′UTR or 3′UTR
FIGURE 4
FIGURE 4
NAT10 regulates target genes in an N4‐acetylcytidine‐dependent manner. (A) Integrative Genomics Viewer (IGV) tracks displaying read distributions across target transcripts from acRIP‐sEquation. (B) Measuring the alteration of ac4C‐modified mRNA in BCL9L, SOX4 and AKT1 with or without knockdown of NAT10 through RIP‐qPCR (****p < .0001, n = 3). (C) Detection of BCL9L, SOX4 and AKT1 protein level by WB after blocking NAT10 expression. (D) Representative images of puromycin assay for determining the translation efficiency with Tubulin as equal loading control. (F) Polysome profile assay shows an overall decreased tendency of translation efficiency after knockdown of NAT10 in UMUC‐3 cells. (F) qPCR showing the changed relative distribution of BCL9L, SOX4 and AKT1 mRNA in different polysome gradient fractions between negative control and NAT10‐deficient cells. Beta‐actin without ac4C modification is used as control mRNA
FIGURE 5
FIGURE 5
BCL9L, SOX4 and AKT1 partially restore cell phenotypes in NAT10‐depleted cells. (A) qPCR is used to measure the level of mRNA after transfection with BCL9L, SOX4 and AKT1 plasmids in UMUC‐3 cells. (B) Detection of BCL9L, SOX4 and AKT1 protein expression after transfection overexpressed plasmids by Western Blotting. (C) Apoptotic cell ratio in bladder cancer is tested using Annexin V‐FITC/PI kit. The stained cells are analysed by flow cytometry (****p < .0001, n = 3). (D) ALDEFLUOR assay is applied to assess the stemness of UMUC‐3 cells in control group, shNAT10 group, shNAT10 with overexpressed SOX4 group, respectively. Cells treatment with DEAB reagent is used as a negative control for ALDHbr staining. (****p < .0001, n = 3). (E) Transfection of SOX4 partially restores the sphere‐forming ability of UMUC‐3 cells after NAT10 knockdown. Scale bars: 100 μm. (F) The capacity of proliferation is detected using CCK‐8 assay under evaluation with OD450. (****p < .0001, n = 3). (G) Transwell experiments show that knockdown of NAT10 impairs invasion ability of UMUC‐3 cells while overexpression of AKT1 can partially restore cellular invasion capacity. (***p < .001, ****p < .0001, n = 3). (H) Transfection of AKT1 partially rescues the migration ability of UMUC‐3 cells after NAT10 knockdown through wound healing assay (**p < .01, ****p < .0001, n = 3)
FIGURE 6
FIGURE 6
Overexpression of NAT10 promotes tumourigenic ability of 5637 cells. (A) The expression of NAT10 is examined after transfection of plasmids containing NAT10 sequence by Western Blot. (B) CCK‐8 kit is utilised to determine the proliferation in 5637 cells transfected vector, NAT10‐overexpressed plasmid and NAT10‐mutant‐overexpressed plasmid respectively (***p < .001, ****p < .0001, n = 3). (C) Wound healing assay demonstrate that forced expression of NAT10 but not NAT10‐mutant promotes the ability of migration of 5637 cell line (****p < .0001, n = 3). (D) In vitro transwell assay showing NAT10 increases invasiveness of 5637 cells (****p < .0001). (E) NAT10 contributes to the improvement of stemness in 5637 cells is determined by in vitro ALDEFLUOR assay (**p < .01, ***p < .001, n = 3). (F) NAT10 overexpression promotes the sphere‐forming ability of 5637 cells. Scale bars: 100 μm. (G) Western blot is used to test the level of downstream targets after overexpression of NAT10 or NAT10‐mutant in shN10 UMUC‐3 cells
FIGURE 7
FIGURE 7
Establishment of the xenograft mouse model validates that NAT10 facilitates growth and progression of BLCA. (A) Tumour images of xenograft nude mice model subcutaneously injected with UMUC‐3 cells. (B) Mass of tumours in shGFP, shNAT10‐1 or shNAT10‐2 group at the endpoint is shown (**p < .01, ***p < .001, n = 6). (C) Tumour volume is recorded from the first week, once a week for a total of 4 weeks (**p < .01, ****p < .0001, n = 6). (D) Representative images for H&E and IHC staining in nude mouse sections. Scale bars: 50 μm. (E) IHC score is computed according to immunostaining intensity and frequency on xenograft model sections (***p < .001, ****p < .0001, n = 6). (F) IHC staining showing the expression level of targets regulated by NAT10 in vivo. Scale bars: 50 μm. (G) The level of BCL9L, SOX4 and AKT1 is evaluated based on IHC staining (**p < .01, n = 6). (H) The level of BCL9L, SOX4 and AKT1 mRNA enriched by ac4C is examined by Rip‐qPCR experiments (***p < .001, ****p < .0001, n = 6)
FIGURE 8
FIGURE 8
Ablation of Nat10 in K14+ cancer stem cells restrains BLCA progression. (A) Schematic diagram showing the experimental procedures for induction of BLCA and conditional knockout of Nat10 in transgenic mice. (B) Representative images for bladder tissues from WT or Nat10 KO mice showing the effect of Nat10 deletion on the tumour burden (**p < .01, n = 9). (C) H&E staining of wild‐type and K14CreER ; Nat10flox/flox mice showing the bladder cancer histological patterns. Scale bars: 100 μm. (D) Tumour grading statistics indicates that knockout of Nat10 in K14 expressing cells delays bladder cancer progression (****p < .0001, n = 9). (E) Immunofluorescent staining of K14 (green), NAT10, Ki67, Caspase‐3 (red) and DAPI (blue) in WT and Nat10 knockout mice respectively. Scale bars: 50 μm (****p < .0001, n = 9). (F) Representative images for immunostaining of K14 (green), BCL9L, SOX4, AKT1 (red) and DAPI (blue) in wild‐type and K14CreER; Nat10flox/flox mice respectively (*p < .05, **p < .01 and ***p < .001, n = 9). (G) RIP‐qPCR experiments were applied to detect the changes of ac4C‐modified targets with or without deficiency of Nat10 in mice carrying bladder cancer (*p < .05, ***p < .001 and ****p < .0001, n = 9)

Similar articles

Cited by

References

    1. Siegel RL, Miller KD, Jemal A. Cancer statistics, 2019. CA Cancer J Clin. 2019;69:7‐34. - PubMed
    1. He YT, Li DJ, Liang D, et al. Incidence and mortality of bladder cancer in China, 2014. Chin J Oncol. 2018;40:647‐652. - PubMed
    1. Lenis AT, Lec PM, Chamie K, Mshs MD. Bladder cancer: a review. JAMA. 2020;324:1980‐1991. - PubMed
    1. Chen Y, Hong T, Wang S, Mo J, Tian T, Zhou X. Epigenetic modification of nucleic acids: from basic studies to medical applications. Chem Soc Rev. 2017;46:2844‐2872. - PubMed
    1. Huang H, Weng H, Chen J. m(6)A modification in coding and non‐coding RNAs: roles and therapeutic implications in cancer. Cancer Cell. 2020;37:270‐288. - PMC - PubMed

Publication types