. 2022 May;12(5):e798.
doi: 10.1002/ctm2.798.

Single-cell profiling-guided combination therapy of c-Fos and histone deacetylase inhibitors in diffuse large B-cell lymphoma

Affiliations

Single-cell profiling-guided combination therapy of c-Fos and histone deacetylase inhibitors in diffuse large B-cell lymphoma

Luqiao Wang et al. Clin Transl Med. 2022 May.

Abstract

Background: Diffuse large B-cell lymphoma (DLBCL) is the most common subtype of non-Hodgkin lymphoma. Histone deacetylase inhibitors (HDACis) have been widely applied in multiple tumours, but the expected efficacy was not observed in DLBCL. Therefore, this study is aimed to explore superior HDACis and optimise a relative combinational therapeutic strategy.

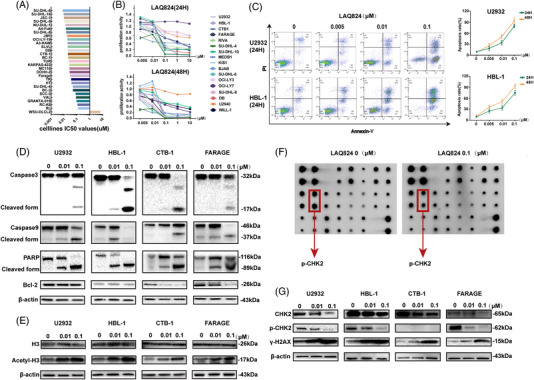
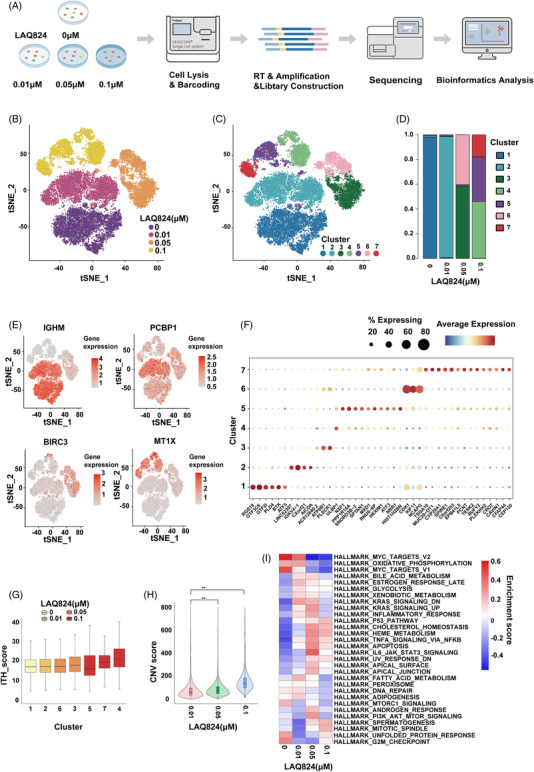
Methods: The antitumour effects of the drug were evaluated by Cell Counting Kit-8 (CCK-8) assay and apoptosis analysis. Single-cell RNA sequencing (scRNA-Seq) was used to analyse the intratumoural heterogeneity of DLBCL cells. Whole-exome sequencing and RNA sequencing were performed to analyse the genetic and transcriptional features. Western blotting, qRT-PCR, protein array, immunohistochemistry, and chromatin immunoprecipitation assays were applied to explore the involved pathways. The antitumour effects of the compounds were assessed using subcutaneous xenograft tumour models.

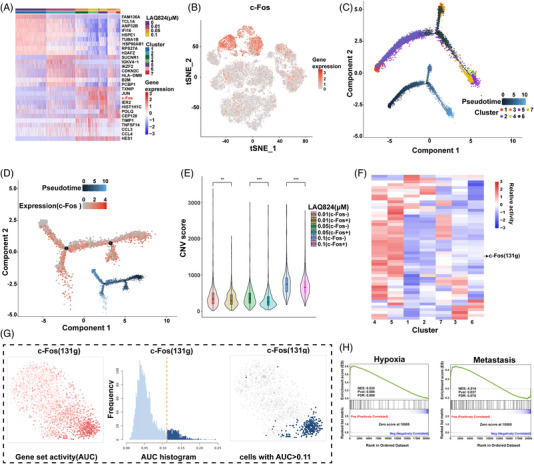
Results: LAQ824 was screened and confirmed to kill DLBCL cells effectively. Using scRNA-Seq, we characterised the heterogeneity of DLBCL cells under different drug pressures, and c-Fos was identified as a critical factor in the survival of residual tumour cells. Moreover, we demonstrated that combinatorial treatment with LAQ824 and a c-Fos inhibitor more potently inhibited tumour cells both in vitro and in vivo.

Conclusion: Altogether, we found an HDACi, LAQ824, with high efficacy in DLBCL and provided a promising HDACi-based combination therapy strategy.

Keywords: combination treatment; diffuse large B-cell lymphoma; histone deacetylase inhibitor; single-cell RNA sequencing.


Conflict of interest statement

The authors declare that they have no conflict of interest.

Figures

FIGURE 1
FIGURE 1
LAQ824 inhibited proliferation and induced apoptosis in diffuse large B‐cell lymphoma (DLBCL) cells. (A) IC50 values of LAQ824 in 29 DLBCL cell lines. We screened out small molecule compounds with low IC50 values in 29 DLBCL cell lines from the genomics of drug sensitivity in the cancer database and found that the histone deacetylase inhibitor dacinostat (LAQ824) inhibited the viability of most DLBCL cell lines. (B) Cell Counting Kit 8 detects the proliferation ability of 17 DLBCL cell lines after 24 and 48 hours of treatments with different concentrations of LAQ824; (C) Apoptosis (annexin V+/DAPI− plus annexin V+/DAPI+) of DLBCL cell lines treated with different concentrations of LAQ824 was detected by flow cytometry. (D) The expression levels of the apoptotic proteins caspase3/9 and PARP, their cleaved form, and the antiapoptotic protein BCL‐2 were detected by western blotting after treatment with different concentrations of LAQ824 for 24 hours. (E) Western blot analysis of the acetylation of H3 in DLBCL cells treated with LAQ824. Total H3 and β‐actin were similarly analysed. (F) The protein array analysed the related protein expression of DLBCL cells after treatment with LAQ824. Representative images of protein array analysis showed that the phosphorylated checkpoint kinase 2 in DLBCL cells treated with LAQ824 was decreased compared to the control group. (G) The array results were further verified by western blotting, and the expression of γH2AX, a marker of DNA double‐strand breaks, was detected in the cells treated with LAQ824. All experiments were performed three times. Data are represented as the mean ± standard deviation. * P < .05, ** P < .01, *** P < .001 versus the control group
FIGURE 2
FIGURE 2
Single‐cell RNA sequencing (scRNA‐Seq) analysis of diffuse large B‐cell lymphoma (DLBCL) cells treated with LAQ824. (A) Schematic of the scRNA‐Seq experiment where the DLBCL cell line U2932 was treated with multiple concentrations (0/0.01/0.05/0.1 μM) of LAQ824 in vitro for 24 hours and subjected to the GEXSCOPE® platform (Singleron). (B–D) t‐stochastic neighbor embedding (tSNE) visualisation of 11,420 cells labelled by different concentrations of LAQ824 (n = 4) and by different cell subtypes (n = 7), and the proportion and distribution of each subgroup in different samples are shown. (E) Gene expression levels of marker genes associated with concentrations of LAQ824 that were identified by clustering and visualised with tSNE. (F) Dot plot illustrating the differences in gene expression in different cell subgroups of each group of samples. (G) Intratumoural heterogeneity analysis of different cell subpopulations. (H) The copy number variation score for DLBCL cells treated with different concentrations of LAQ824 was analysed. (I) Gene set variation analysis using hallmark gene sets was performed on scRNA‐Seq data. Gene set variation analysis enrichment scores calculated by each gene set of single cells using log2 (UMI + 1) data are shown
FIGURE 3
FIGURE 3
LAQ824 induced upregulation of c‐Fos expression in diffuse large B‐cell lymphoma (DLBCL) cells. (A) Heatmap showing the differentially expressed genes in different samples and each cluster (labelled by different samples and each cluster as in Figure 1B,C), and c‐Fos was significantly upregulated in the .1 μM LAQ824 treatment group. (B) The t‐stochastic neighbor embedding (tSNE) plot shows the expression level of c‐Fos in different samples. (C) Pseudo‐time trajectories developed through Monocle2 analysis for DLBCL cells treated with different concentrations of LAQ824. (D) Monocle‐based pseudo‐time ordering predicts that DLBCL cells exposed to .1 μM LAQ824 move along different trajectories, and the expression pattern of c‐Fos is plotted along the pseudo‐time axis. (E) The copy number variation score for different c‐Fos‐positive and c‐Fos‐negative samples was analysed. (F) Using SCENIC, we identified transcription factors (TFs) unique to each cluster. Heatmap of the t values of area under the curve (AUC) scores of expression regulation by transcription factors of each cluster, as estimated using SCENIC. (G) SCENIC analysis predicts TFs such as c‐Fos as central hubs in DLBCL cells treated with LAQ824. TF regulon activities were quantified using AUCell. (H) Gene Set Enrichment Analysis (GSEA) shows the top enriched pathways in a cluster with high expression of c‐Fos. NES denotes the normalised enrichment score. *P < 0.05, **P < 0.01, ***P < 0.001 versus the control group
FIGURE 4
FIGURE 4
Overexpression of c‐Fos helps diffuse large B‐cell lymphoma (DLBCL) cells resist the pressure of LAQ824. (A and B) The expression levels of c‐Fos mRNA and protein in DLBCL cell lines treated with different concentrations of LAQ824. (C, D) qRT–PCR results showed that LAQ824 induced upregulation of c‐Fos mRNA expression in other DLBCL cell lines. Correlation between c‐Fos mRNA expression level and IC50 of LAQ824 in different DLBCL cell lines. (E) Correlation analysis of IC50 values of LAQ824 (Sanger GDSC1) and c‐Fos expression levels (Expression Public 21Q1) in multiple myeloma (MM), acute myeloid leukaemia (AML), and lymphoma cell lines. (F, G) qRT–PCR and immunoblot analysis of c‐Fos in U2932, HBL1, CTB, and FARAGE cell lines at 48 hours after transfection with a siRNA targeting c‐Fos or a control siRNA and treated with LAQ824 (0.1 μM) simultaneously. β‐actin served as controls. (H) Cell Counting Kit 8 analysis of proliferation activity in U2932, HBL1, CTB, and FARAGE cell lines transfected as in (D) and treated with LAQ824 (0.1 μM). (I) LAQ824 (0/0.01/0.1 μM) combined with a c‐Fos inhibitor (0.01 μM CDF) synergistically inhibited proliferation in different DLBCL cell lines. C: CDF (0.01 μM). All experiments were performed three times. Data are represented as the mean ± SD. * P < 0.05, ** P < 0.01, *** P <0.001 versus the control group. NS, not statistically significant
FIGURE 5
FIGURE 5
Whole‐exome sequencing analysis of the association between genetics and drug response. (A) Oncoplot for the top 50 mutated genes in the 17 diffuse large B‐cell lymphoma (DLBCL) cell lines. Each row represents a gene, and each column represents the samples. (B) Mutually exclusive and co‐occurring gene pairs in DLBCL cell lines are displayed as a triangular matrix. Green indicates a tendency towards co‐occurrence, whereas pink indicates a tendency towards exclusiveness. (C) The IC50 values of LAQ824/fold change of c‐Fos mRNA in DLBCL cell lines treated with LAQ824 and tumour mutation burden (TMB) in DLBCL cell lines were correlated using Pearson's r correlation coefficient, indicated by the numbers in the heatmap. (D) Oncoplot plot showing the relationship between the fold change of c‐Fos mRNA in DLBCL cell lines treated with LAQ824 and mutated genes. (E) Oncoplot plot showing the relationship between the IC50 values of LAQ824 and mutated genes. (F) Mutated pathways involving genes associated with Hippo signalling in DLBCL cell lines with relatively high IC50 values of LAQ824
FIGURE 6
FIGURE 6
The mechanism by which LAQ824 induces c‐Fos expression and the expression of c‐Fos in other histone deacetylase inhibitors (HDACis). (A) Western blot analysis of the protein expression levels of p‐H3S10 and acetyl‐H3K9 in diffuse large B‐cell lymphoma (DLBCL) cell lines treated with different concentrations of LAQ824. (B) Schematic diagram of different positions of the c‐Fos gene detected in chromatin immunoprecipitation (ChIP) analysis. (C) The CUT&RUN Assay Kit was used to detect the phosphorylation of H3S10 and the acetylation of H3K9 at different positions of the c‐Fos gene in DLBCL cells (U2932) treated with different concentrations of LAQ824. (D) qRT–PCR detected the mRNA expression level of c‐Fos in DLBCL cell lines of ABC type (U2932) and GCB type (CTB1) treated with different HDACis. (E) Western blot analysis of the protein expression levels of ABC‐type (U2932) and GCB‐type (CTB1) DLBCL cell lines treated with different HDAC inhibitors. All experiments were performed three times. Data are represented as the mean ± standard deviation. * P < 0.05, ** P < 0.01, *** P < 0.001 versus the control group
FIGURE 7
FIGURE 7
LAQ824 and c‐Fos inhibitor synergistically inhibit diffuse large B‐cell lymphoma (DLBCL) growth in vivo. (A) 18F‐FLT PET images showed that nonobese diabetic, severe combined immune deficiency (NOD SCID) mice transplanted with the DLBCL cell line U2932 were treated with LAQ824 (75 mg/kg, once every 5 days), LAQ824 and CDF (10 mg/kg, once a day) combined with vehicle. (B) Illustration of the tumours in each group described above that were removed on day 24. Magnification bar, 10 mm. (C) Tumour volume in mice treated with vehicle only (black), LAQ824 (blue), or LAQ824 in combination with difluorobenzocurcumin (CDF) (red). Data are represented as mean ± SD (n = 6 mice per group, significant vs. vehicle group; * P < .05, ** P < .01, *** P < .001). (D) Tumour tissue sections were subjected to immunochemistry for c‐Fos, checkpoint kinase 2, p‐H3S10, and Ki67 expression (original magnification 200×, scale bar = 100 μm). (E) Representative immunohistochemical (IHC) staining for c‐Fos in initially diagnosed and relapsed or refractory DLBCL patients (original magnification 400×, scale bar = 200 μm). (F) Graph picturing the potential mechanism of combinatorial treatment with LAQ824 and a c‐Fos inhibitor to synergistically inhibit DLBCL cell growth

Comment in

Similar articles

Cited by

References

    1. Swerdlow SH, Campo E, Pileri SA, et al. The 2016 revision of the World Health Organization classification of lymphoid neoplasms. Blood. 2016;127(20):2375‐2390. - PMC - PubMed
    1. Miyazaki K. Treatment of diffuse large B‐cell lymphoma. J Clin Exp Hematop. 2016;56(2):79‐88. - PMC - PubMed
    1. McNally DR, Elemento O, Melnick A. Dissecting bulk transcriptomes of diffuse large B cell lymphoma. Cancer Cell. 2021;39(10):1305‐1307. - PubMed
    1. Romanski A, Bacic B, Bug G, et al. Use of a novel histone deacetylase inhibitor to induce apoptosis in cell lines of acute lymphoblastic leukemia. Haematologica. 2004;89(4):419‐426. - PubMed
    1. Kim MS, Kwon HJ, Lee YM, et al. Histone deacetylases induce angiogenesis by negative regulation of tumor suppressor genes. Nat Med. 2001;7(4):437‐443. - PubMed

Publication types

MeSH terms

Substances

LinkOut - more resources