. 2022 May 5;29(5):760-775.e10.
doi: 10.1016/j.stem.2022.04.007.

Antigen presentation safeguards the integrity of the hematopoietic stem cell pool

Affiliations

Antigen presentation safeguards the integrity of the hematopoietic stem cell pool

Pablo Hernández-Malmierca et al. Cell Stem Cell. .

Abstract

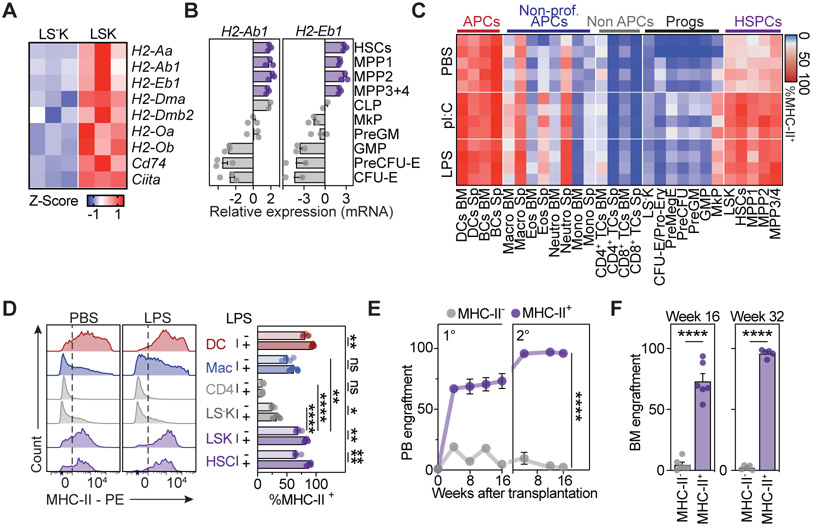
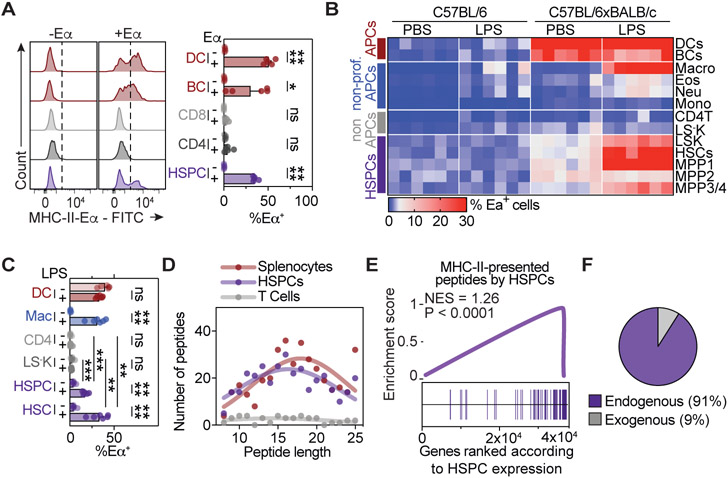
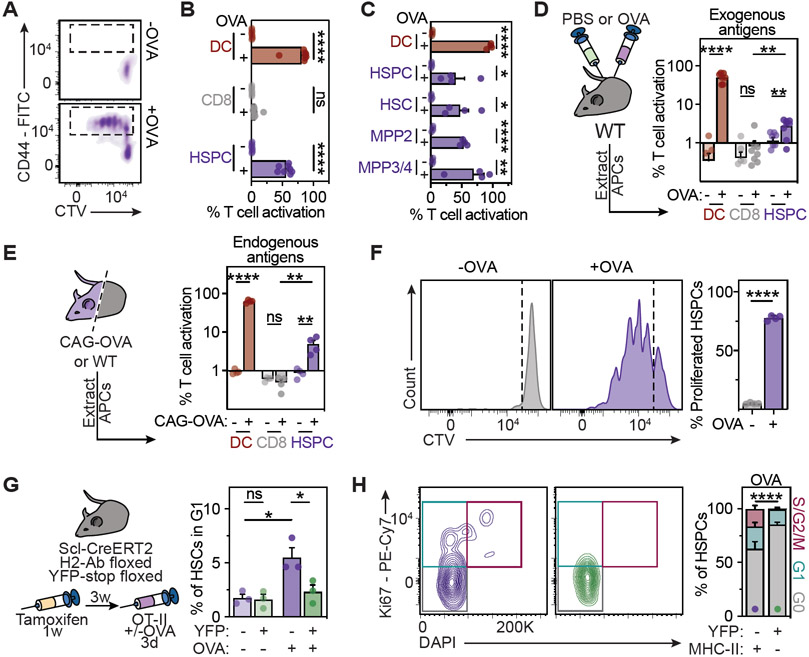
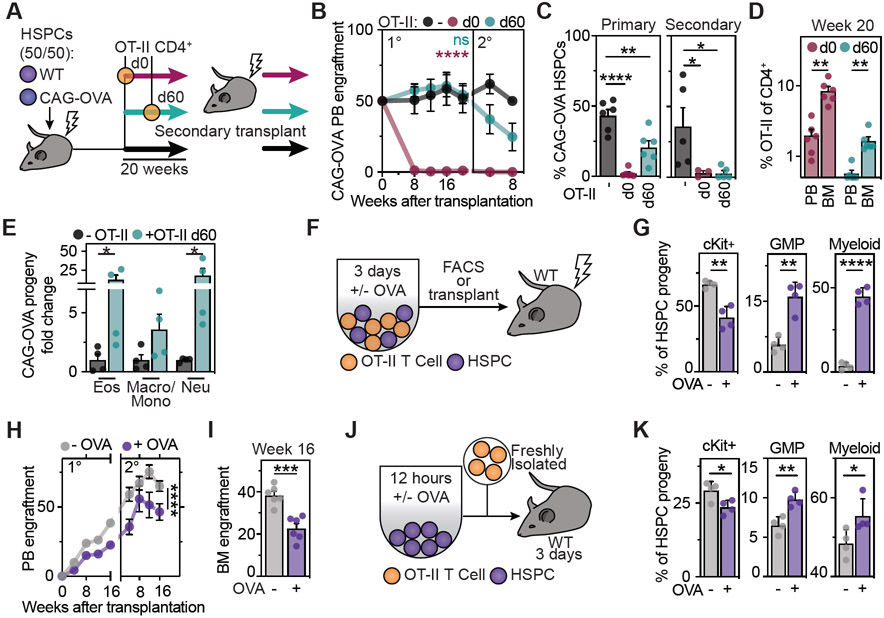
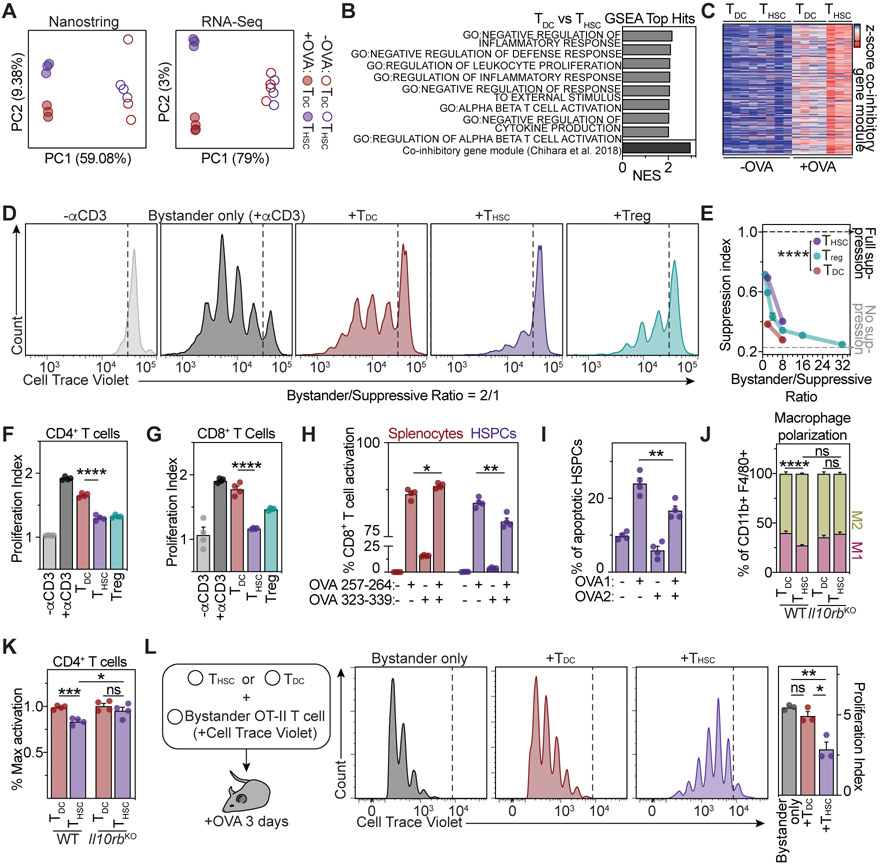
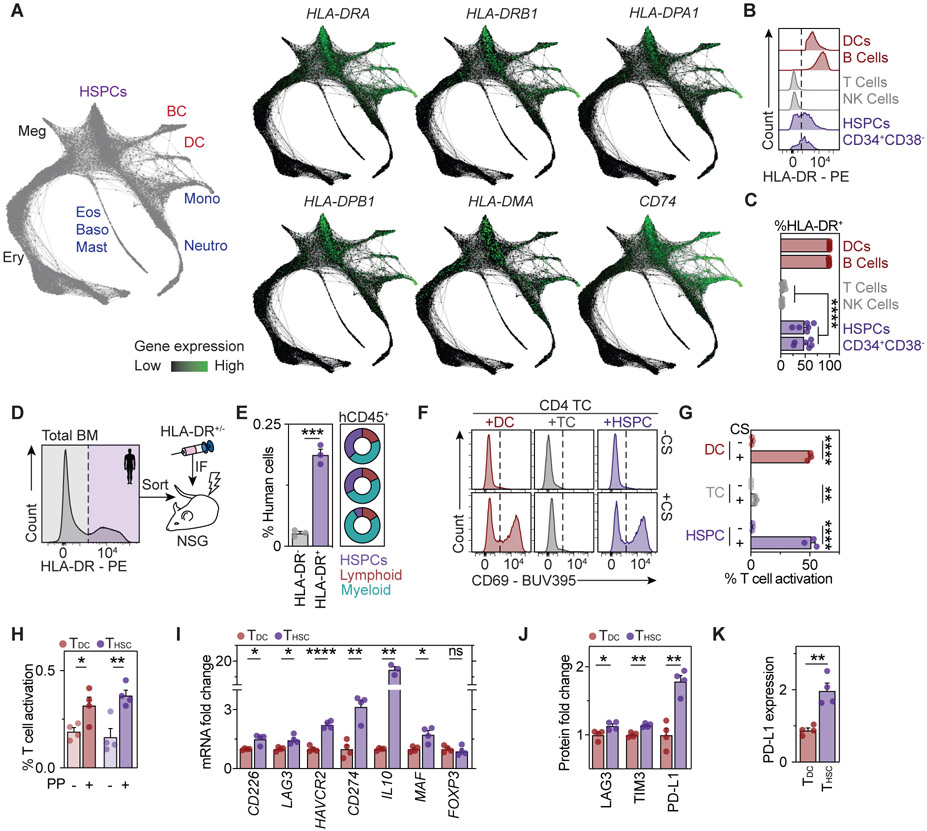
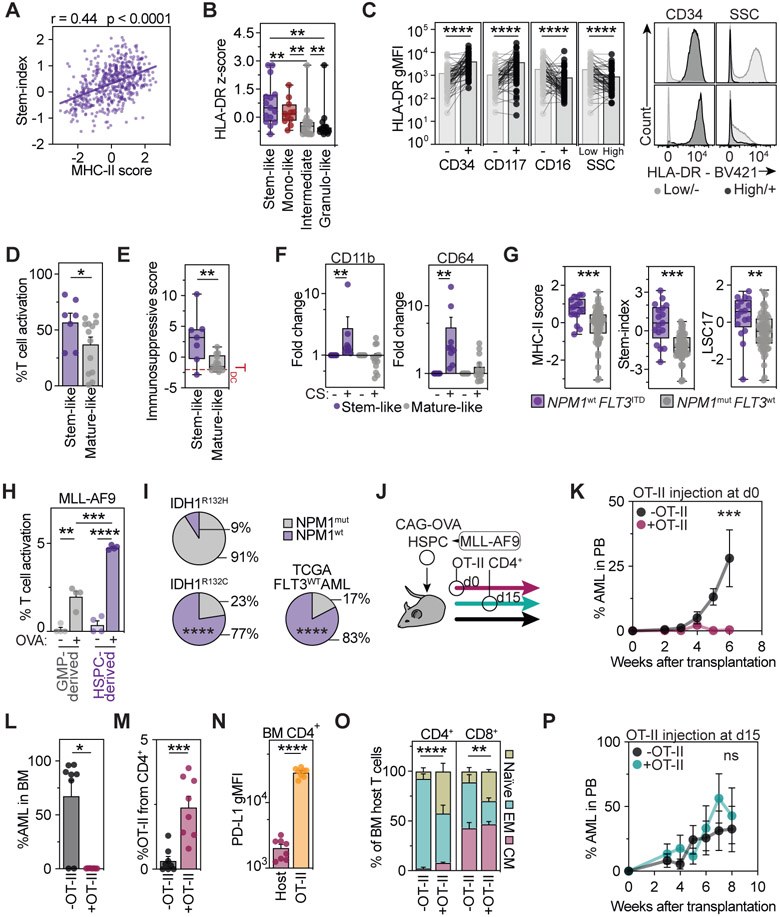
Hematopoietic stem and progenitor cells (HSPCs) are responsible for the production of blood and immune cells. Throughout life, HSPCs acquire oncogenic aberrations that can cause hematological cancers. Although molecular programs maintaining stem cell integrity have been identified, safety mechanisms eliminating malignant HSPCs from the stem cell pool remain poorly characterized. Here, we show that HSPCs constitutively present antigens via major histocompatibility complex class II. The presentation of immunogenic antigens, as occurring during malignant transformation, triggers bidirectional interactions between HSPCs and antigen-specific CD4+ T cells, causing stem cell proliferation, differentiation, and specific exhaustion of aberrant HSPCs. This immunosurveillance mechanism effectively eliminates transformed HSPCs from the hematopoietic system, thereby preventing leukemia onset. Together, our data reveal a bidirectional interaction between HSPCs and CD4+ T cells, demonstrating that HSPCs are not only passive receivers of immunological signals but also actively engage in adaptive immune responses to safeguard the integrity of the stem cell pool.

Keywords: CD4(+) T cells; acute myeloid leukemia; antigen presentation; hematopoietic stem cells; immune regulation; immunosurveillance; leukemia.


Conflict of interest statement

Declaration of interests V.K.K. is a cofounder, has ownership interest, and is on the SAB of Celsius Therapeutics and Tizona Therapeutics.

Figures

Figure 1.
Figure 1.. Mouse HSPCs express the MHC-II antigen presentation machinery.
See also Figure S1. (A) z-scores of MHC-II antigen presentation machinery genes in mouse HSCs and MPPs (LSK) and progenitors (LSK) derived from RNA-Seq data (Klimmeck et al., 2014), n=3. (B) Relative gene expression of MHC-II genes across bone marrow (BM) populations measured by qPCR, n=2-3. (C) Heatmap summarizing MHC-II surface measurements for BM and spleen (Sp) populations by flow cytometry at homeostasis or 24h post pI:C or LPS treatment. (D) Representative histograms (left) and quantification (right) of MHC-II surface expression as in (C), n=4-5. (E and F) Transplantation experiments of MHC-II+/− BM populations, n=4-6. (E) Peripheral blood (PB) chimerism, n=4-6. (F) BM chimerism at the endpoint of primary (left) and secondary (right) transplantation, n=4-6. Individual values are shown in A and C, means and SEM are depicted otherwise. No significance = ns, P<0.05 *, P<0.01 **, P<0.001 ***, P<0.0001 ****. Two-way ANOVA was performed in D as discovery test, followed by a paired two-tailed t-test. If not stated otherwise, unpaired two-tailed t-tests were performed as post-hoc tests. Two-way ANOVA was performed in E.
Figure 2.
Figure 2.. Mouse HSPCs present self-antigens via MHC-II.
See also Figure S1. (A) Ex vivo antigen presentation assay. Representative histograms (left) and quantification (right), n=4. (B and C) In vivo antigen presentation assay, n=6. (B) Heatmap summarizing the percentage of Eα presenting cells in C57BL/6xBALB/c mice and control C57BL/6 mice. (C) Quantification of selected populations in C57BL/6xBALB/c. (D-F) Mass spectrometry analyses of peptides recovered from MHC-II of indicated populations. (D) MHC-II-eluted peptide size distribution. (E) Gene set enrichment analysis (GSEA) of presented peptides related to their gene expression in HSPCs. (F) MHC-II-derived peptides in HSPCs that are transcribed (endogenous) or not transcribed (exogenous) within HSPCs based on a threshold of 100 RPKM. Individual values are shown in B and D, means and SEM are depicted otherwise. No significance = ns, P<0.05 *, P<0.01 **, P<0.001 ***, P<0.0001 ****. One- (A) or two-way ANOVA (C) were performed as discovery tests. Paired two-tailed t-test was performed in C. If not stated otherwise, unpaired two-tailed t-tests were performed as post-hoc tests.
Figure 3.
Figure 3.. MHC-II mediates an antigen-specific bidirectional interaction between HSPCs and CD4+ T cells.
See also Figure S2. (A and B) HSPCs activate naïve OT-II CD4+ T cells in co-culture assays, n=8. (A) Representative histograms of CD44 expression and cell trace violet (CTV). (B) Quantification of T cell activation. (C) T cell activation assays for different HSPC subpopulations (2.5x10³ cells) as in 3A, n=4. (D) In vivo antigen presentation assay for exogenous antigens. Experimental approach (left), quantification of T cell activation (right), n=8. (E) In vivo antigen presentation assay for endogenous antigens. Experimental approach (left), quantification of T cell activation (right), n=4. (F) Antigen presentation impacts on HSPC proliferation in co-culture assays with naïve OT-II CD4+ T cells (see methods). Representative plots (left) and quantification (right), n=4. (G and H) In vivo antigen-specific HSPC-T cell interaction promotes HSPC cell cycle entry in a Scl-CreERT2 H2-Ab floxed YFP-stop floxed mouse model. (G) Experimental scheme (left), and cell cycle analyses (right). (H) Representative plots (left) and cell cycle analysis (right) of YFP+MHC-II or YFPMHC-II+ HSPCs from Cre+ mice, n=5. Means and SEM are depicted. No significance = ns, P<0.05 *, P<0.01 **, P<0.001 ***, P<0.0001 ****. One- (B, C) or two-way ANOVA (D, E, G and H) were performed as discovery tests. Paired two-tailed t-test was performed in G. If not stated otherwise, unpaired two-tailed t-tests were performed as post-hoc tests.
Figure 4.
Figure 4.. Sustained presentation of immunogenic antigens drives differentiation and exhaustion of HSPCs.
See also Figure S2. (A-E) Sustained in vivo interactions of antigen presenting HSPCs and antigen-specific CD4+ T cells trigger HSPC differentiation and exhaustion. (A) Experimental scheme: Co-transplantations of CAG-OVA and wt HSPCs with or without OT-II CD4+ T cells. (B) Percentage of CAG-OVA progeny in the blood of recipient mice, n=4-6. (C) BM chimerism at the endpoints of primary (left) and secondary (right) transplantations, n=4-6. (D) Percentage of OT-II T cells of total CD4+ T cells in recipient mice (week 20), n=6. (E) Lineage-output upon HSPC-T cell interactions in vivo. Percentage of CAG-OVA HSPC derived progeny 20 weeks after transplantation, n=4. (F-I) Impact of antigen presentation on HSPC differentiation. (F) Experimental scheme. Co-cultures between HSPCs and OT-II T cells were analyzed by flow cytometry (G) or transplanted into lethally irradiated mice (H and I). (G) Indicated populations derived from transplanted HSPCs were quantified, n=4. (H) PB engraftment, n=6. (I) BM engraftment at week 16, n=6. (J and K) In vivo impact of antigen presentation on HSPCs. (J) Experimental scheme. OVA loaded HSPCs were co-transferred with naïve OT-II CD4+ T cells. (K) Indicated populations were quantified 3 days post transfer. Means and SEM are depicted. No significance = ns, P<0.05 *, P<0.01 **, P<0.001 ***, P<0.0001 ****. One-way (C, D, E) and two-way (B, H) ANOVA was performed. If not stated otherwise, unpaired two-tailed t-tests were performed as post-hoc tests.
Figure 5.
Figure 5.. HSPC-mediated antigen presentation induces a suppressive phenotype in CD4+ T cells.
See also Figure S3 and S4. (A) Principle component analyses (PCA) of Nanostring (left) and RNA-Seq (right) gene expression of OT-II CD4+ T cells activated by HSPCs (THSCs) or dendritic cells (TDCs), n=3-4. (B) Top THSC-enriched gene sets of gene set enrichment analyses (GSEA) of RNA-Seq data from (A), comparing THSCs and TDCs. (C) Heatmap representing z-scored expressions of co-inhibitory module genes (Chihara et al., 2018). (D-F and K) Ex vivo CD4+ T cell suppression assays. (D) Representative plots for the 1:2 suppressive/bystander naïve CD4+ T cell condition. (E) Suppression index for different bystander/suppressive ratios, n=4. (F) Proliferation index of responder CD4+ T cells for the 1:2 ratio, n=4. (G) Ex vivo CD8+ T cell suppression assay, n=4. (H and I) Ex vivo CD8+ T cell activation (H) and annexin V cytotoxicity assay (I), n=4. OVA1: ovalbumin 257-264, OVA2: ovalbumin 323-339. (J) Ex vivo macrophage polarization assay, n=4. (K) Role of IL-10 in THSC-mediated suppression. Activation of WT (left) or Il10rb−/− (right) bystander T cells in the presence of THSCs or TDCs in a 1:2 suppressive:bystander ratio., n=4. (L) In vivo suppression assay. Representative plots (left) and quantification of bystander T cell proliferation (right), n=3. Individual values are shown in A and C, means and SEM are depicted otherwise. No significance = ns, P<0.05 *, P<0.01 **, P<0.001 ***, P<0.0001 ****. One- (F, G, H, I, L) or two-way ANOVA (K) were performed as discovery test. Two-way ANOVA was performed in E and J. If not stated otherwise, unpaired two-tailed t-tests were performed as post-hoc tests.
Figure 6.
Figure 6.. Human HSPCs act as antigen presenting cells.
See also Figure S5. (A) SPRING plots of human HSPC differentiation trajectories from scRNA-RNAseq data (Pellin et al., 2019). Lineage annotation (left) and MHC-II gene expression (right). (B) Representative plots of HLA-DR expression in human BM aspirates, n=6. (C) Quantification of HLA-DR+ expression from 6B. (D) Experimental scheme for xenotransplantations. (E) Quantification of human CD45+ cells in the BM (left) and multilineage engraftment (right) in xenotransplantations. Donut plots depict myeloid, lymphoid and HSPC percentages for every donor, n=3. (F-H) Human CD4+ T cell activation assays using CytoStim (CS, F and G) or an MHC-II-restricted peptide pool (PP, H). Representative plots (F) and quantification of T cell activation (G and H), n=3-4. (I) qPCR analyses of CD4+ T cells activated by HSPCs (THSCs) or dendritic cells (DCs) (TDCs) in the presence of CytoStim as in 6F, n=4. (J and K) Surface protein expression in THSCs and TDCs, n=4. Means and SEM are depicted in all bar-plots. No significance = ns, P<0.05 *, P<0.01 **, P<0.001 ***, P<0.0001 ****. One-way ANOVA was performed in C, G, H, I and J as discovery test. Unpaired two-tailed t-tests were performed as post-hoc tests.
Figure 7.
Figure 7.. MHC-II-mediated neoantigen presentation of HSPCs protects from leukemia onset.
See also Figure S5. (A) Stemness correlates with MHC-II expression in AML. Sum of scaled HLA-DR (MHC-II) gene expression and stem cell scores for AMLs from (Pölönen et al., 2019), n=523. (B and C) AML patient samples were analyzed by flow cytometry and stratified into indicated groups. (B) HLA-DR surface expression in the different AML groups, n=63. (C) HLA-DR geometric mean fluorescence intensity within AML blasts positive or negative for representative stem or mature markers (left), n=63. Representative flow cytometry histograms (right). (D) T cell activation capability in AML cell lines stratified as stem-like or mature-like, n=23. (E) Immunosuppressive score in activated CD4+ T cells in the presence of the AML cell lines from 7D based on the z-scored expression of LAG3, PD-L1 and TIM3, n=23. (F) CD11b (left) and CD64 (right) expression in AML cell lines after co-culture with CD4+ T cell in the presence or absence of CS, n=23. (G) Sum of scaled MHC-II related genes (left) or stem cell scores (Ng et al., 2016) (right) in AML patients segregated based on NPM1 and FLT3 mutational state (Kohlmann et al., 2010), n=78. (H) Antigen presentation assays of HSC- and GMP-derived MLL-AF9 leukemias, n=4. (I) Proportion of NPM1wt or NPM1mut co-occurrence with immunogenic IDH1R132H (n=33), non-immunogenic IDH1R132C (n=31) and FLT3wt AMLs (n=144) (Ley et al., 2013; Falini et al., 2019). (J-P) Stem cell-derived leukemia antigen presentation impacts on disease onset. (J) Experimental scheme. CAG-OVA HSPCs were transformed with MLL-AF9 and co-transplanted with or without OT-II T cells at day 0 (K-O) or 2 weeks post transplantation (P). (K and P) AML cells over time in the peripheral blood, n=5-8. (L) AML cells in the BM at the endpoint, n=8. (M) OT-II CD4+ T cells in the BM at the endpoint, n=8. (N) PD-L1 expression in BM CD4+ T cells, n=8. (O) Relative frequencies of host CD4+ (left) and CD8+ (right) naïve, effector memory (EM) and central memory (CM) T cells in presence or absence of OT-II CD4+ T cells, n=8. Individual values are shown in A. Minimum to maximum are depicted in E and G, means and SEM are depicted otherwise. No significance = ns, P<0.05 *, P<0.01 **, P<0.001 ***, P<0.0001 ****. Two-way ANOVA (H) or Kruskal-Wallis (B and F) were performed as discovery tests. Linear regression analysis (A), Chi-squared test (I), two-way ANOVA (K, O, P), paired (C,F) unpaired Mann-Whitney test (B, D, E, G, L) was performed. If not stated otherwise, unpaired two-tailed t-tests were performed as post-hoc tests.

Comment in

References

    1. Ali N et al. (2017) ‘Regulatory T Cells in Skin Facilitate Epithelial Stem Cell Differentiation’, Cell. Elsevier Inc., 169(6), pp. 1119–1129.e11. doi: 10.1016/j.cell.2017.05.002. - DOI - PMC - PubMed
    1. Alshetaiwi H et al. (2020) ‘Defining the emergence of myeloid-derived suppressor cells in breast cancer using single-cell transcriptomics’, Science Immunology, 5(44), p. eaay6017. doi: 10.1126/sciimmunol.aay6017. - DOI - PMC - PubMed
    1. Arpaia N et al. (2015) ‘A Distinct Function of Regulatory T Cells in Tissue Protection’, Cell. Elsevier Inc., 162(5), pp. 1078–1089. doi: 10.1016/j.cell.2015.08.021. - DOI - PMC - PubMed
    1. Baldridge MT et al. (2010) ‘Quiescent haematopoietic stem cells are activated by IFN-γ in response to chronic infection’, Nature. Nature Publishing Group, 465(7299), pp. 793–797. doi: 10.1038/nature09135. - DOI - PMC - PubMed
    1. Barnden MJ et al. (1998) ‘Defective TCR expression in transgenic mice constructed using cDNA-based α- and β-chain genes under the control of heterologous regulatory elements’, Immunology and Cell Biology, 76(1), pp. 34–40. doi: 10.1046/j.1440-1711.1998.00709.x. - DOI - PubMed

Publication types