. 2022 May 5;29(5):810-825.e8.
doi: 10.1016/j.stem.2022.04.004.

Stem-cell-derived trophoblast organoids model human placental development and susceptibility to emerging pathogens

Affiliations

Stem-cell-derived trophoblast organoids model human placental development and susceptibility to emerging pathogens

Rowan M Karvas et al. Cell Stem Cell. .

Abstract

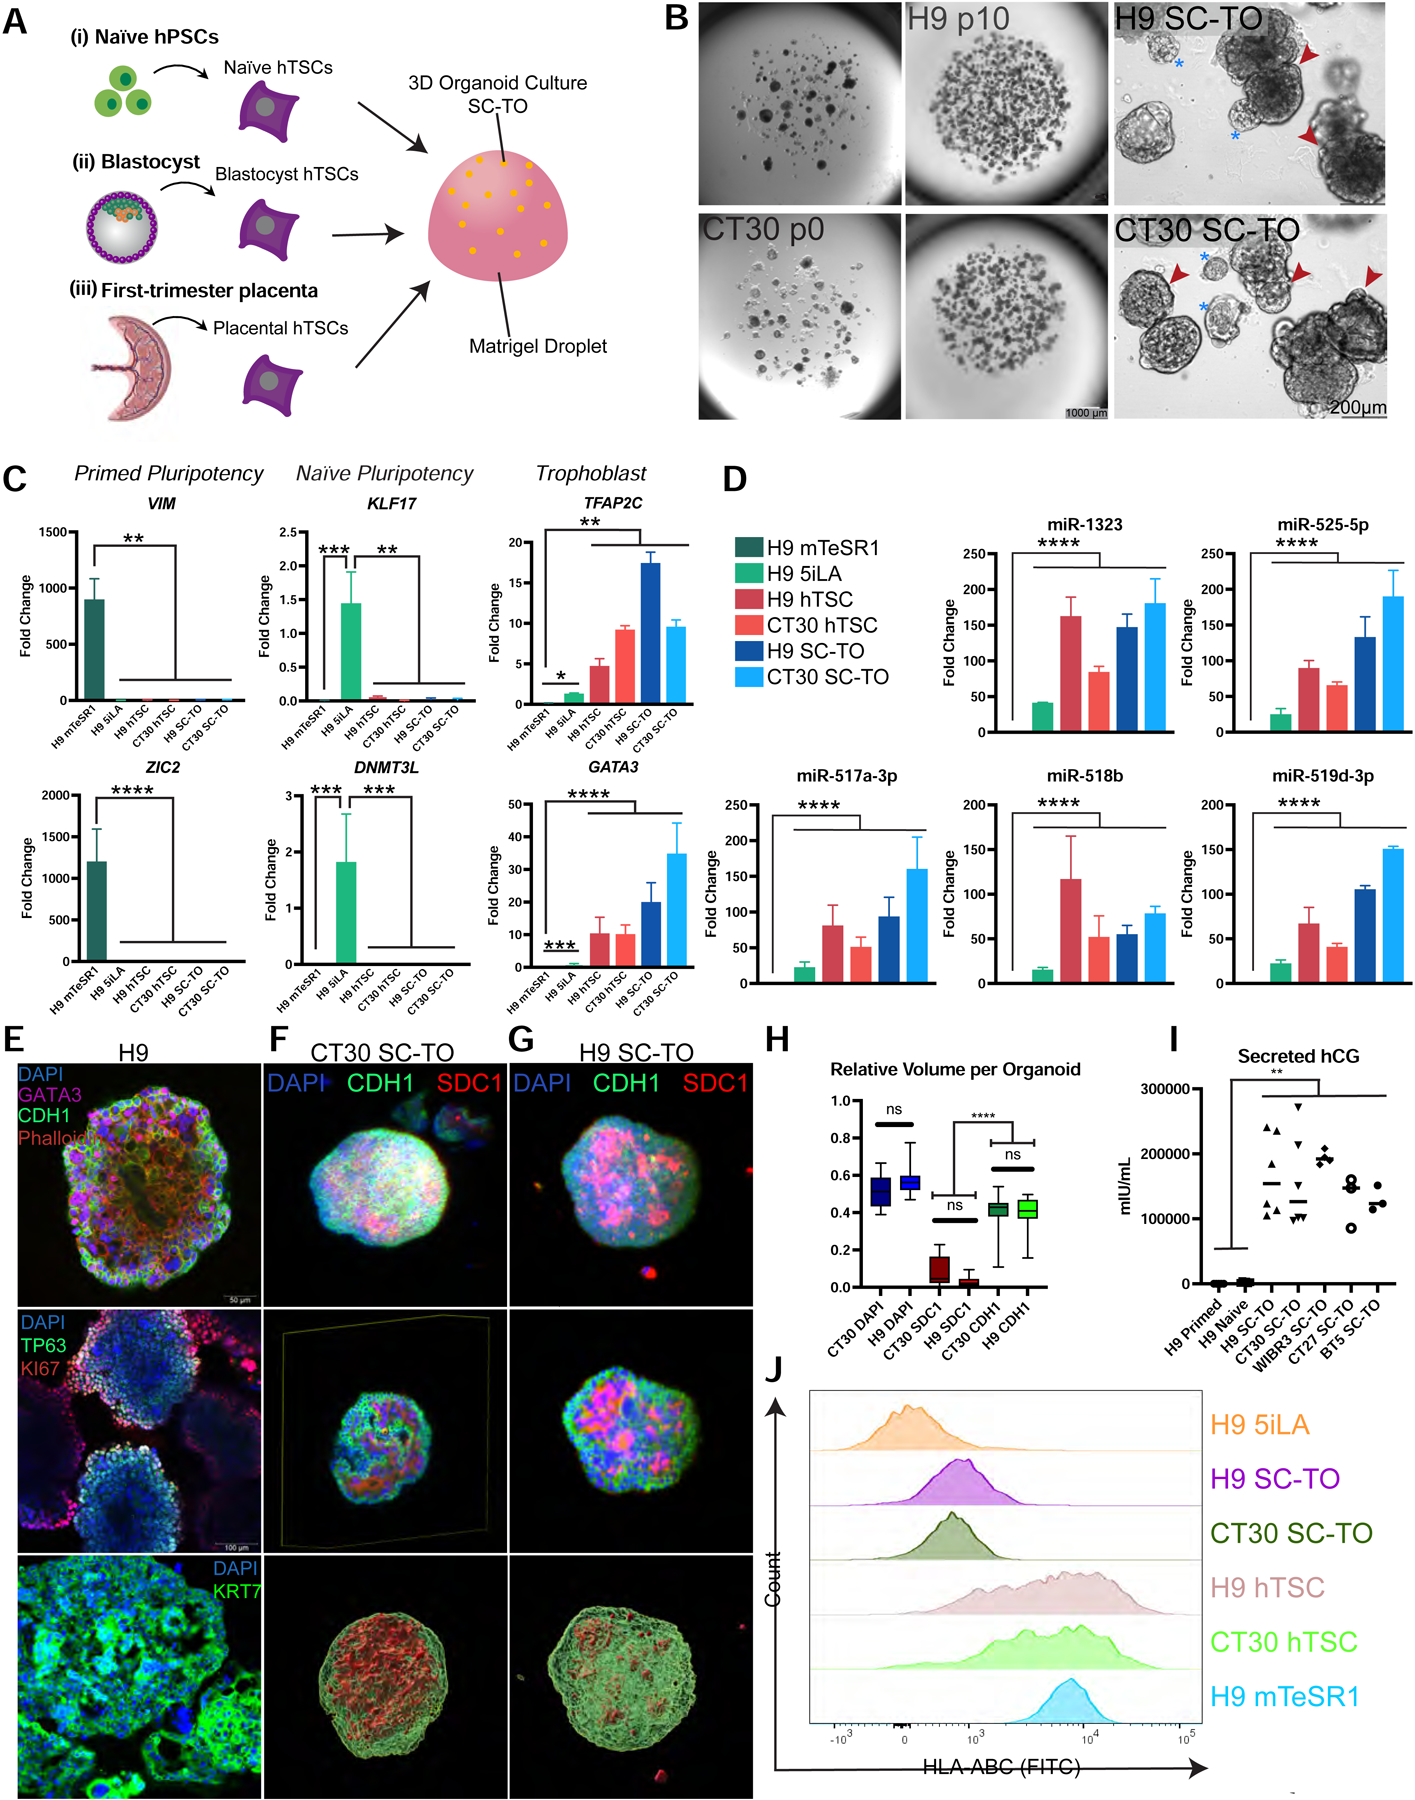
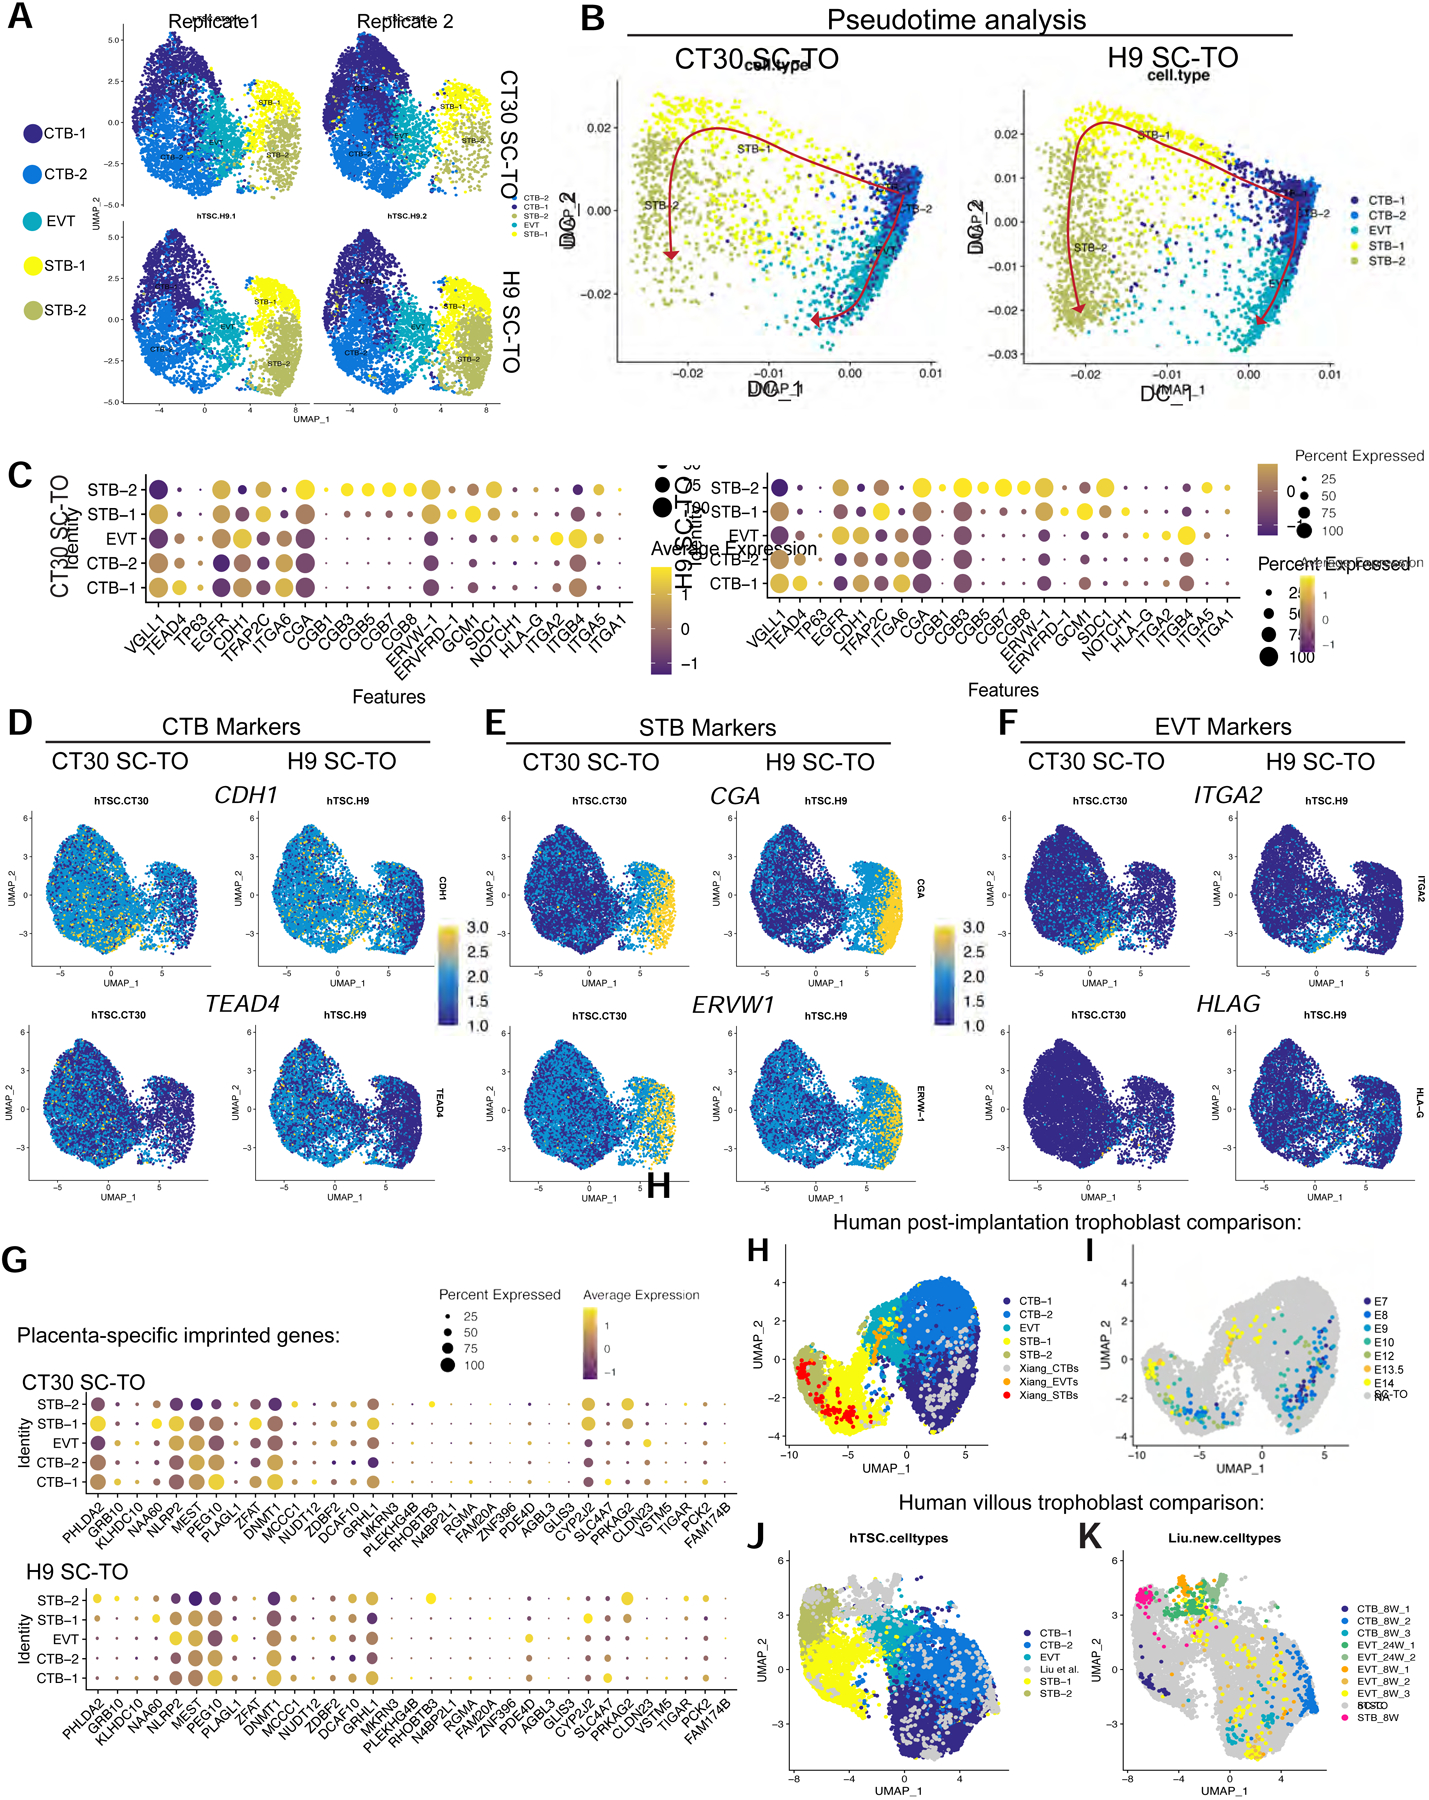
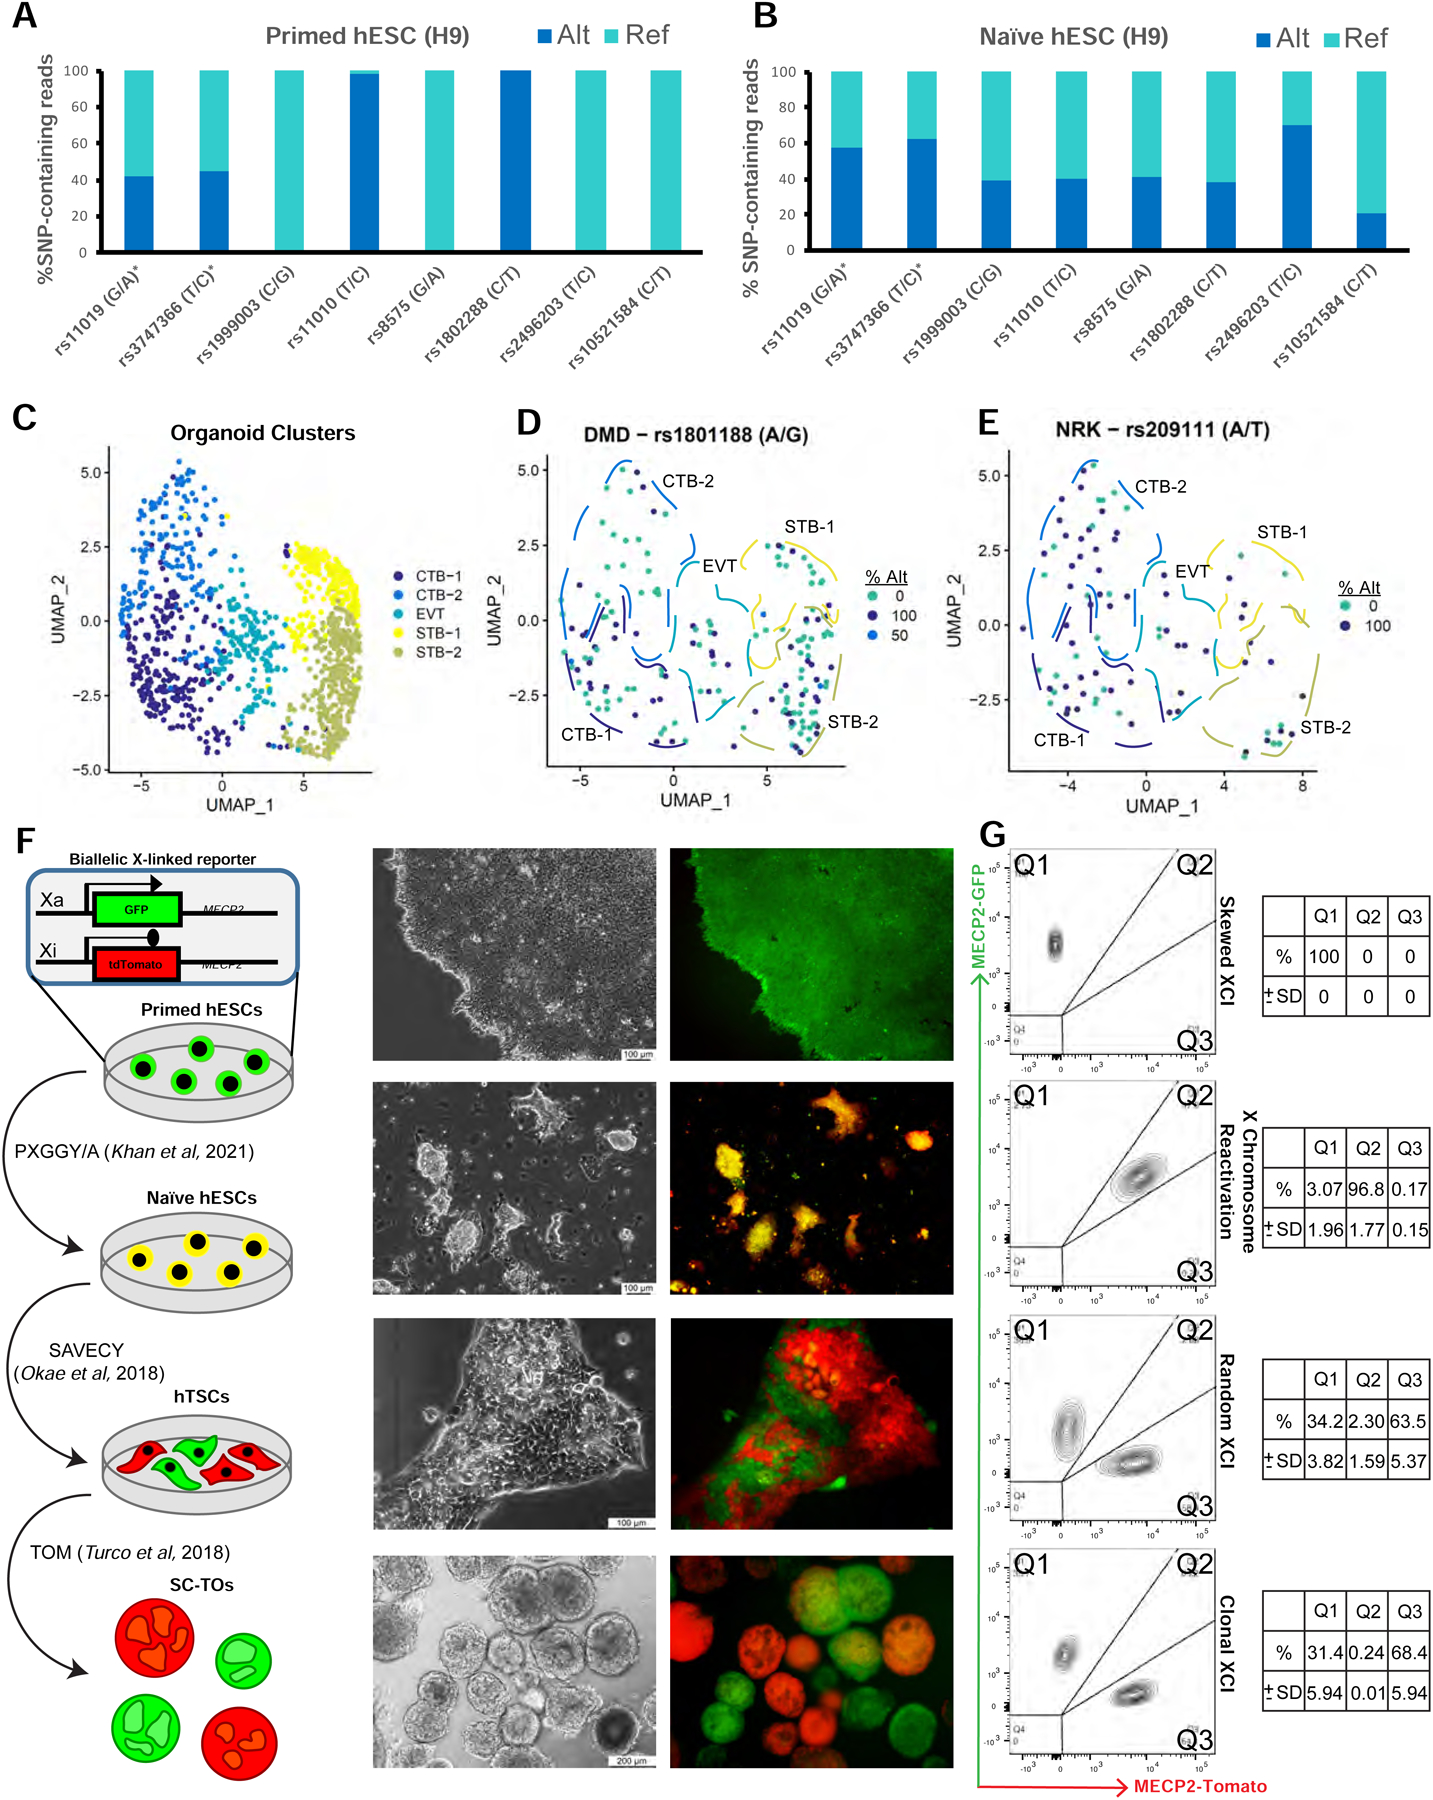
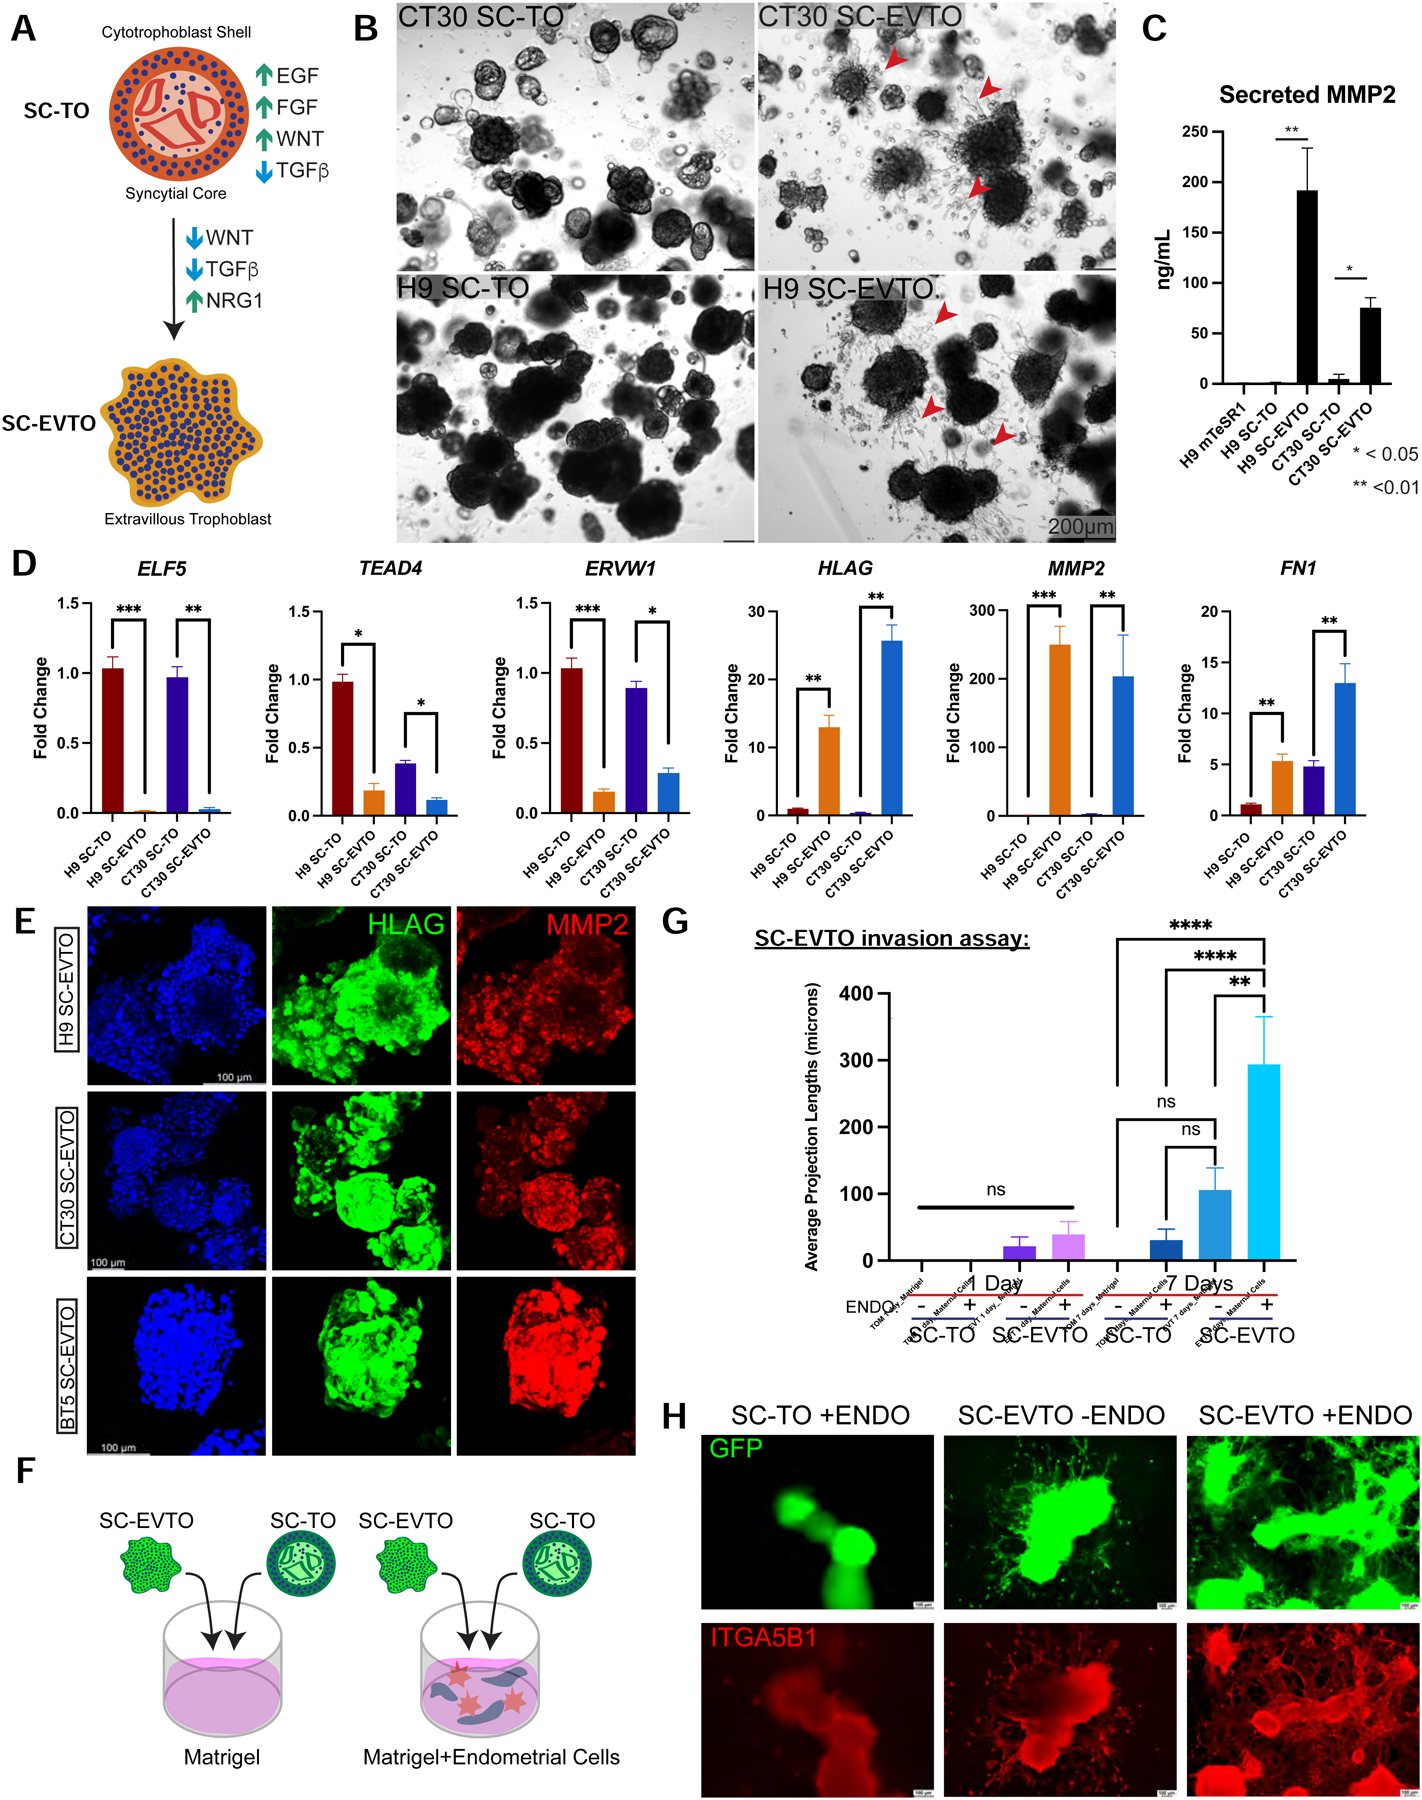
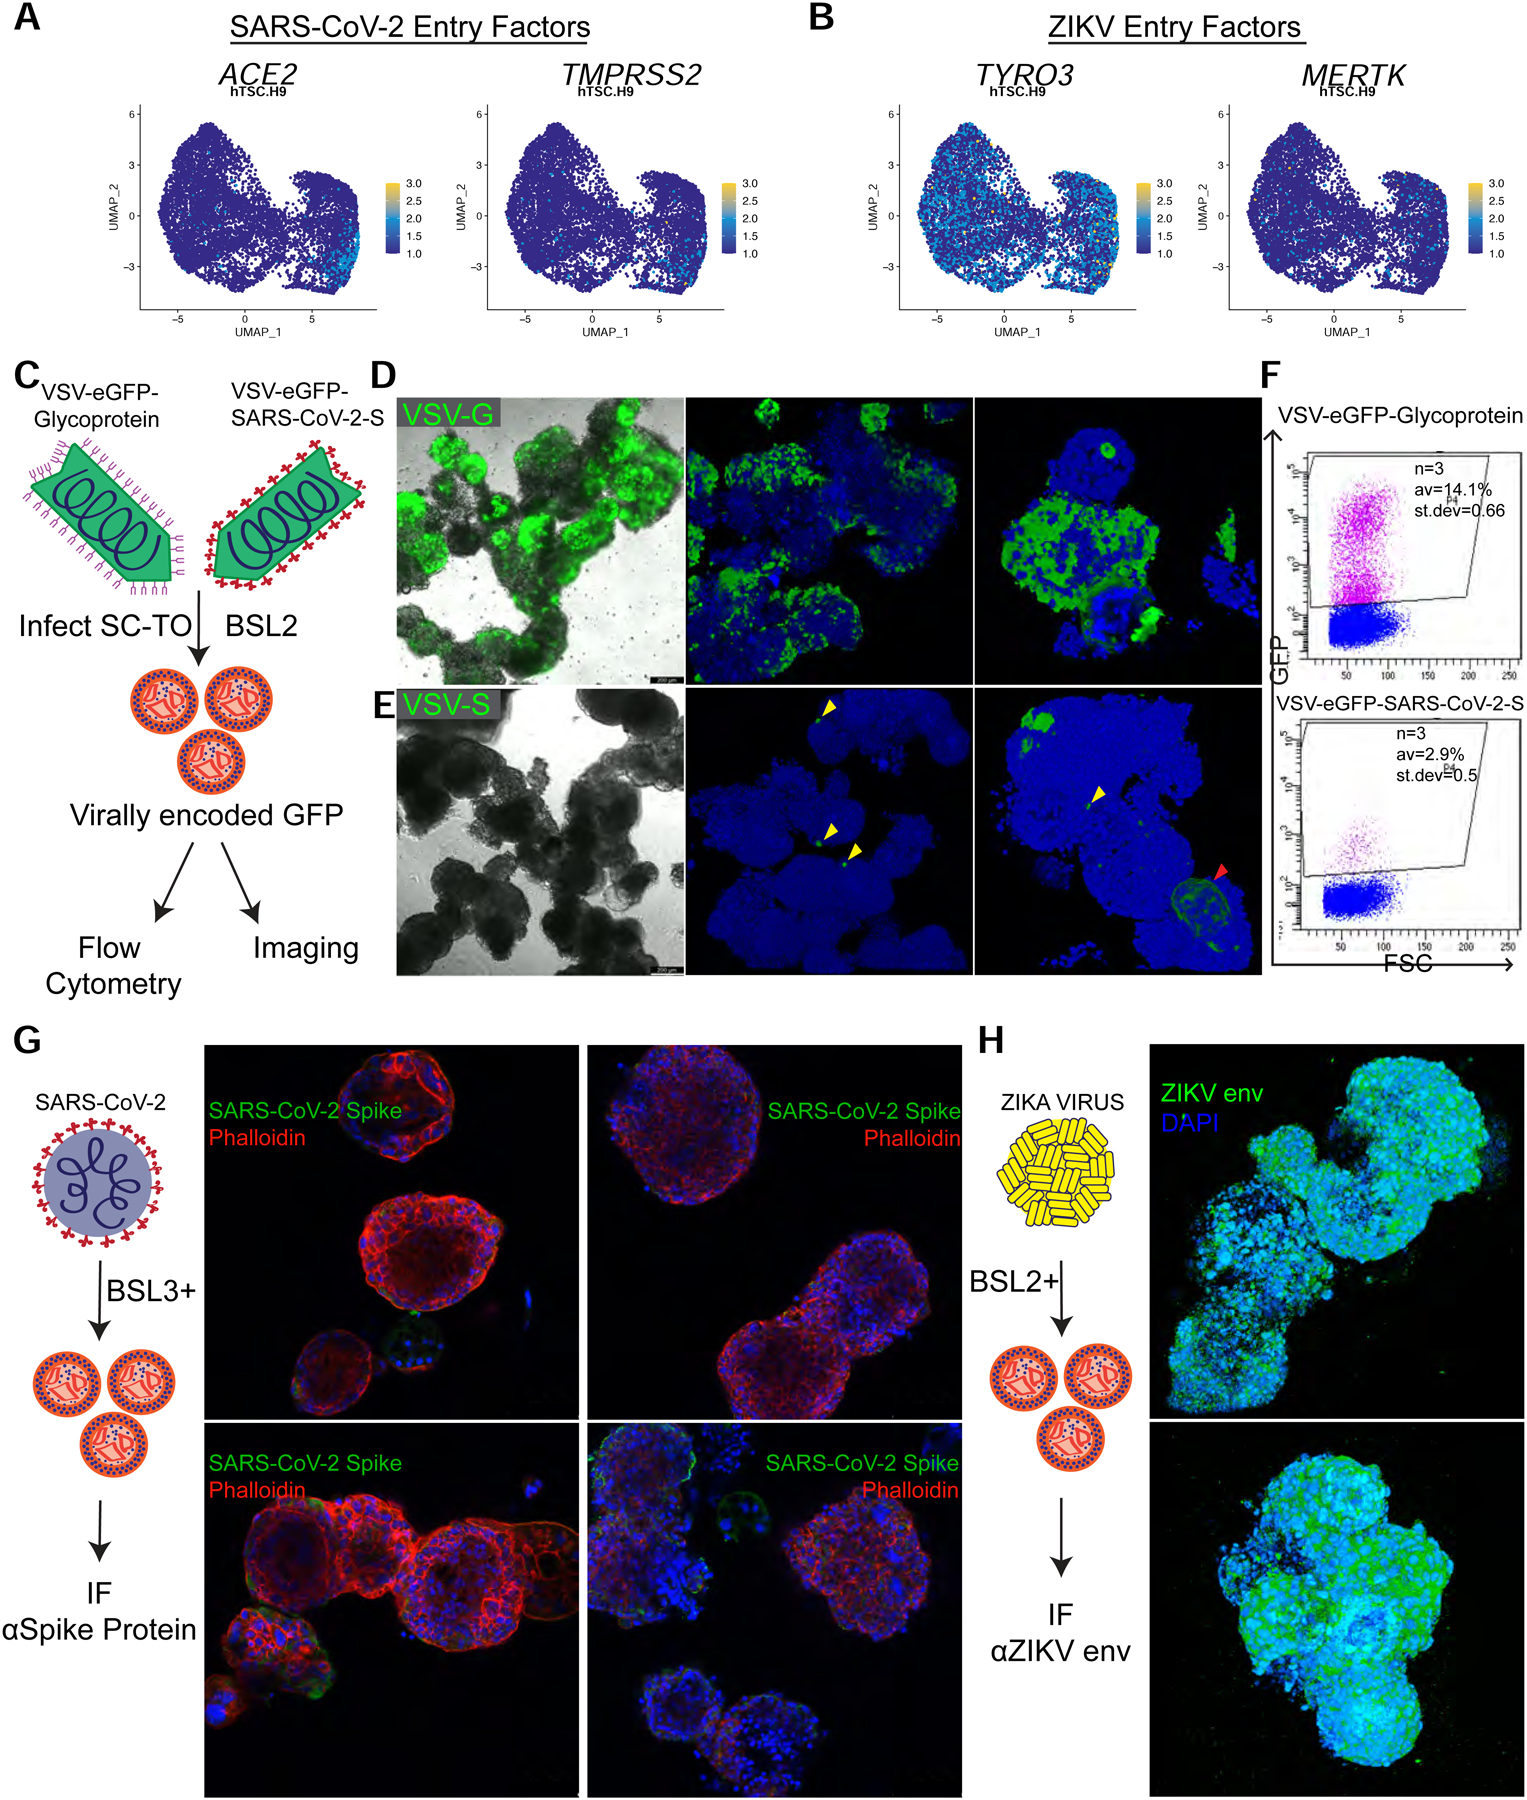
Trophoblast organoids derived from placental villi provide a 3D model system of human placental development, but access to first-trimester tissues is limited. Here, we report that trophoblast stem cells isolated from naive human pluripotent stem cells (hPSCs) can efficiently self-organize into 3D stem-cell-derived trophoblast organoids (SC-TOs) with a villous architecture similar to primary trophoblast organoids. Single-cell transcriptome analysis reveals the presence of distinct cytotrophoblast and syncytiotrophoblast clusters and a small cluster of extravillous trophoblasts, which closely correspond to trophoblast identities in the post-implantation embryo. These organoid cultures display clonal X chromosome inactivation patterns previously described in the human placenta. We further demonstrate that SC-TOs exhibit selective vulnerability to emerging pathogens (SARS-CoV-2 and Zika virus), which correlates with expression levels of their respective entry factors. The generation of trophoblast organoids from naive hPSCs provides an accessible 3D model system of the developing placenta and its susceptibility to emerging pathogens.

Keywords: SARS-CoV-2; X chromosome inactivation; Zika virus; cytotrophoblast; extravillous trophoblast; naive pluripotency; placental development; single-cell transcriptomics; syncytiotrophoblast; trophoblast organoids; trophoblast stem cells.


Conflict of interest statement

Declaration of interests I.U.M. serves on the Scientific Advisory Board of Luca Biologics. The Boon laboratory has received unrelated funding support in sponsored research agreements from AI Therapeutics, Green Light Biosciences Inc., and Nano targeting & Therapy BioPharma Inc. The Boon laboratory has received funding support from AbbVie Inc., for the commercial development of SARS-CoV-2 mAb. A.C.M.B. is a recipient of a licensing agreement with AbbVie Inc., for commercial development of SARS-CoV-2 mAb.

Figures

Figure 1:
Figure 1:. Characterization of 3D organoids derived from naïve and primary hTSCs.
A. Schematic representation of SC-TO derivation. Human trophoblast stem cells (hTSCs) were sourced from naïve human pluripotent stem cells (hPSCs) (Dong et al., 2020), human blastocyst outgrowths, or primary cytrophoblasts (CTBs) of first-trimester placentas (Okae et al., 2018). hTSCs were maintained in hTSC medium and transferred to 3D culture in a Matrigel droplet and maintained in trophoblast organoid medium (TOM) (Turco et al., 2018). B. Brightfield imaging of H9 and CT30 SC-TOs. Both SC-TO lines were maintained for 10 passages and exhibited a similar overall structure. Organoid morphology consists of opaque, largely CTB, with some interior STB (red arrows) and heavily syncytialized, clear cystic STB (blue asterisks). Stereoscopic images (left, middle columns) scale = 1 mm. Widefield images (right) scale = 200 μm. C. Quantitative gene expression analysis during derivation of SC-TOs from naïve hPSCs. Primed hPSCs expressed VIM and ZIC2, naïve hPSCs expressed DNMT3L and KLF17, and trophoblast cells in 2D hTSC culture and 3D SC-TOs expressed GATA3 and TFAP2C. Fold change is plotted relative to H9 5i/L/A. Error bars indicate mean ± SD of at least 2 biological replicates. *p value <0.05; **p<0.01; ***p<0.001; ****p<0.0001. D. Quantitative gene expression analysis for chromosome 19 microRNAs in hTSCs and SC-TOs compared to primed and naïve stem cells. Fold change is plotted relative to H9 mTeSR1. Error bars indicate mean ± SD of at least 2 biological replicates. ****p<0.0001. E. Immunofluorescence analysis of trophoblast markers in H9 SC-TOs. All images represent single sections of confocal imaging analysis for the following markers: CDH1, GATA3 (top); TP63 and MKI67 (middle); and KRT7 (bottom). F. Light sheet microscopic images of a representative CT30 SC-TO. Organoids were stained for epithelial CTB marker CDH1 and STB marker SDC1 followed by optical clearing. Bottom image shows 3D volume rendered in Amira software. G. Light sheet microscopic images of a representative H9 SC-TO. Organoids were stained for epithelial CTB marker CDH1 and STB marker SDC1 followed by optical clearing. Bottom image shows 3D volume rendered in Amira software. H. Quantification of signals from whole 3D organoids. CT30: n = 19 SC-TOs, H9: n = 14 SC-TOs. The volumes measured were DAPI, SDC1, and CDH1. No significant differences were observed between H9 and CT30 SC-TO for any of the examined proteins. I. hCG ELISA analysis of secreted hCG levels in cell culture media of primed hPSCs (negative control), naïve hPSCs, and SC-TOs. This experiment was performed on SC-TOs generated from five independent hTSC lines. Paired t test: ** p value < 0.01. J. Flow cytometry analysis for HLA-ABC (W6/32) in H9 5i/L/A naïve hPSCs (negative control), H9 mTeSR1 primed hPSCs (positive control), H9 hTSCs and SC-TOs, and CT30 hTSCs and SC-TOs. See also Figure S1, and Table S3.
Figure 2:
Figure 2:. Single cell transcriptome profiles of SC-TOs derived from naïve and primary hTSCs.
A. Cellular composition of SC-TOs revealed by single cell RNA-sequencing (scRNA-seq). Uniform Manifold Approximation and Projection (UMAP) subclusters include CTB-1 and CTB-2, STB-1 and STB-2, and a small primitive EVT population. These studies were performed on two replicates of SC-TOs generated from two independent genetic backgrounds: H9 naïve hTSCs and CT30 primary hTSCs. B. In silico analysis of SC-TO differentiation patterns. Pseudotime analyses indicate the relatedness of subclusters between CT30 and H9 SC-TOs, allowing inference of two predominant differentiation trajectories, both of which emerge from CTB-1 (red arrows). C. Dotplots indicating expression of trophoblast progenitor and lineage markers in five distinct clusters as shown in Fig. 2A. Average gene expression levels and the percentage of cells that express each gene are presented with differential color intensities and circle sizes, respectively. D. UMAP plots indicating expression of the CTB markers CDH1 and TEAD4 in H9 and CT30 SC-TOs. E. UMAP plots indicating expression of the STB markers CGA and ERVW-1 in H9 and CT30 SC-TOs. F. UMAP plots indicating expression of the EVT markers ITGA2 and HLAG in H9 and CT30 SC-TOs. G. Dotplots indicating expression of placenta-specific imprinted genes in H9 and CT30 SC-TOs. Average gene expression levels and the percentage of cells that express each gene are presented with differential color intensities and circle sizes, respectively. H. Integration of SC-TO UMAP data with scRNA-seq analysis of human post-implantation stage trophoblasts (Xiang et al., 2020). These data represent combined scRNA-seq data from two independent SC-TO lines (H9 and CT30). I. Similar to Fig. 2H except that trophoblast subpopulations from Xiang et al. are highlighted and separated by embryonic day (E7–14). J. Integration of SC-TO UMAP data with scRNA-seq analysis containing trophoblast cells from primary human placental tissues (Liu et al., 2018). SC-TO clusters are highlighted in colors. K. Similar to Fig. 2J except that primary placental samples from Liu et al. are highlighted in colors. See also Figure S2, S3 and Table S1–2.
Figure 3:
Figure 3:. X chromosome inactivation (XCI) dynamics during trophoblast organoid derivation from naïve hPSCs.
A-B. Allele-specific gene expression analysis using SNPs located within transcribed regions of X-linked genes in primed H9 hESCs in mTeSR1 (A) and naïve hESCs that were derived in 5i/L/A (B). Allelic frequencies were analyzed for those SNPs covered by at least 10 reads in naïve hESCs. Asterisks mark genes reported to escape X inactivation (Balaton et al., 2015). C. UMAP plot denotes the identities of H9 SC-TO clusters in 10X single cell transcriptome data, which were used to calculate allelic frequencies of X-linked genes in Fig. 3D–E and Fig. S3A. D. UMAP plot indicating allele-specific expression of DMD in SC-TOs derived from H9 naïve hESCs. Cells expressing the reference allele are indicated in teal, cells expressing the alternative allele are indicated in navy, and the few cells expressing both alleles are indicated in blue. E. UMAP plot indicating allele-specific expression of NRK in SC-TOs derived from H9 naïve hESCs. Cells expressing the reference allele are indicated in teal and cells expressing the alternative allele are indicated in navy. F. Schematic (left) and representative phase and fluorescence images (right) of XCI dynamics during SC-TO derivation from naïve hESCs, as revealed using WIBR3 hESCs carrying a dual fluorescent reporter in both alleles of the X-linked MECP2 locus. PXGGY/A: alternative naïve hPSC induction medium (Khan et al., 2021); SAVECY: hTSC medium (Okae et al., 2018); TOM: trophoblast organoid medium (Turco et al., 2018). G. Flow cytometry analysis for MECP2-GFP and MECP2-tdTomato on samples shown in Fig. 3F. FACS plots are representative of 2 independent biological replicates. Tables (right) indicate mean percentage of cells within each quarter and standard deviation. See also Figure S4.
Figure 4:
Figure 4:. Differentiation of SC-TOs into specialized 3D EVT organoids (SC-EVTOs).
A. Schematic representation of signaling requirements to maintain SC-TOs or induce differentiation towards specialized 3D SC-EVTOs. B. Phase contrast view of SC-TOs maintained in trophoblast organoid medium (TOM) (Turco et al., 2018), which promotes a smooth and spherical structure. Both CT30 and H9 SC-TOs differentiated into 3D SC-EVTOs exhibit migratory EVTs, as indicated by red arrows. The scale bar depicts 200 μm. C. ELISA analysis of secreted MMP2 from SC-TO lines exposed to EVT-promoting media. These studies represent two biological replicate experiments (H9 and CT30 SC-TOs). Error bars indicate mean ± 1 SE of three technical replicates. *p-value<0.05; **p-value<0.01. D. Quantitative gene expression analysis of general trophoblast markers ELF5 and TEAD4, the STB differentiation marker ERVW1, and EVT differentiation markers HLAG, MMP2, and FN1 upon differentiation of H9 and CT30 SC-TOs into SC-EVTOs. Fold change is plotted relative to H9 SC-TO. Error bars indicate mean ± 1 SD of 2–3 biological replicates. E. Maximal projection images of SC-EVTOs demonstrate overlapping HLAG and MMP2 expression. These data represent differentiation experiments performed with three independent SC-TO lines (H9, CT30, and BT5). F. Schematic of the SC-TO/SC-EVTO invasion assay to test interactions with immortalized human endometrial fibroblasts and glandular epithelial cells embedded in a 3D Matrigel matrix. H9 SC-TOs were lentivirally labeled with a constitutive GFP vector to enable quantification of invasive projections. G. Quantification of SC-TO/SC-EVTO invasive projections between days 1 and 7 of co-culture with or without human endometrial cells. H. Representative images of SC-TO/SC-EVTO invasion assay in the presence (+ENDO) or absence (−ENDO) of human endometrial cells. The most pronounced invasive projections were observed using SC-EVTOs in the presence of endometrial cells. GFP constitutively marks SC-TOs/SC-EVTOs. ITGA5B1 staining indicates invasive EVTs. Scale bar = 100μm. See also Supplemental Movies 1 and 2 and Table S3.
Figure 5:
Figure 5:. Modeling placental vulnerability to SARS-CoV-2 and ZIKV infection in SC-TOs.
A. UMAP plots indicating expression of the SARS-CoV-2 entry factors ACE2 and TMPRSS2. These data represent combined scRNA-seq data from two H9 SC-TO replicates. B. UMAP plots indicating expression of the ZIKV entry factors TYRO3 and MERTK. These data represent combined scRNA-seq data from two H9 SC-TO replicates. C. Schematic of VSV-eGFP-Glycoprotein (VSV-G) and VSV-eGFP-SARS-CoV-2-Spike (VSV-S) infections of SC-TOs. The presence of virally encoded GFP was assayed by flow cytometry and fluorescent microscopy. D. Infection of H9 SC-TOs with VSV-G showed widespread infection. These data are representative of two biological replicates. The scale bar depicts 200 μm. E. VSV-S infection of SC-TOs demonstrated more limited infection compare to VSV-G. Yellow arrows indicate the sparse CTBs infected while the red arrow identifies the GFP-positive multinucleated STB. These data are representative of two biological replicates. The scale bar depicts 200 μm. F. Flow cytometry analysis for virally encoded GFP in dissociated H9 SC-TOs following infection with VSV-S or VSV-G. G. SC-TOs were infected with a clinical isolate of live SARS-CoV-2 (MOI = 3). Single plane confocal IF imaging for the SARS-CoV-2 Spike protein revealed no significant difference between infected vs. uninfected SC-TOs. Furthermore, morphological signs of infection were absent. These experiments were performed on two independent SC-TO lines (H9 and CT30). The scale bar depicts 100 μm. H. H9 SC-TOs were infected with the Brazilian strain of ZIKV and assessed by IF for the capsid envelope protein. 3D view of SC-TO (top) or SC-EVTO (bottom) showed widespread infection among all organoid cell types. The scale bar depicts 200 μm. See also Figure S5.

Comment in

Similar articles

Cited by

References

    1. Aagaard KM, Lahon A, Suter MA, Arya RP, Seferovic MD, Vogt MB, Hu M, Stossi F, Mancini MA, Harris RA, et al. (2017). Primary Human Placental Trophoblasts are Permissive for Zika Virus (ZIKV) Replication. Sci Rep 7, 41389. - PMC - PubMed
    1. Amita M, Adachi K, Alexenko AP, Sinha S, Schust DJ, Schulz LC, Roberts RM, and Ezashi T (2013). Complete and unidirectional conversion of human embryonic stem cells to trophoblast by BMP4. Proc Natl Acad Sci U S A 110, E1212–1221. - PMC - PubMed
    1. An C, Feng G, Zhang J, Cao S, Wang Y, Wang N, Lu F, Zhou Q, and Wang H (2020). Overcoming Autocrine FGF Signaling-Induced Heterogeneity in Naive Human ESCs Enables Modeling of Random X Chromosome Inactivation. Cell Stem Cell 27, 482–497 e484. - PubMed
    1. Andergassen D, Smith ZD, Kretzmer H, Rinn JL, and Meissner A (2021). Diverse epigenetic mechanisms maintain parental imprints within the embryonic and extraembryonic lineages. Dev Cell 56, 2995–3005 e2994. - PMC - PubMed
    1. Angerer P, Haghverdi L, Buttner M, Theis FJ, Marr C, and Buettner F (2016). destiny: diffusion maps for large-scale single-cell data in R. Bioinformatics 32, 1241–1243. - PubMed

Publication types