. 2022 May 5;29(5):826-839.e9.
doi: 10.1016/j.stem.2022.04.001.

p57Kip2 imposes the reserve stem cell state of gastric chief cells

Affiliations

p57Kip2 imposes the reserve stem cell state of gastric chief cells

Ji-Hyun Lee et al. Cell Stem Cell. .

Abstract

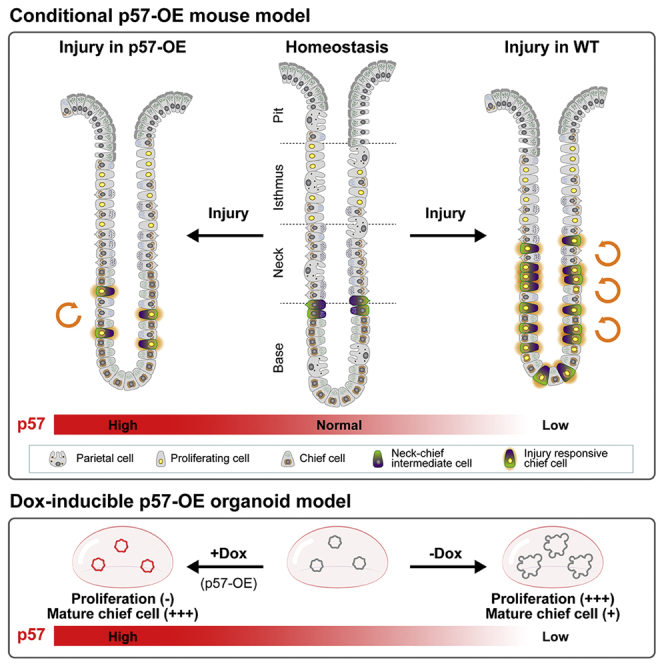
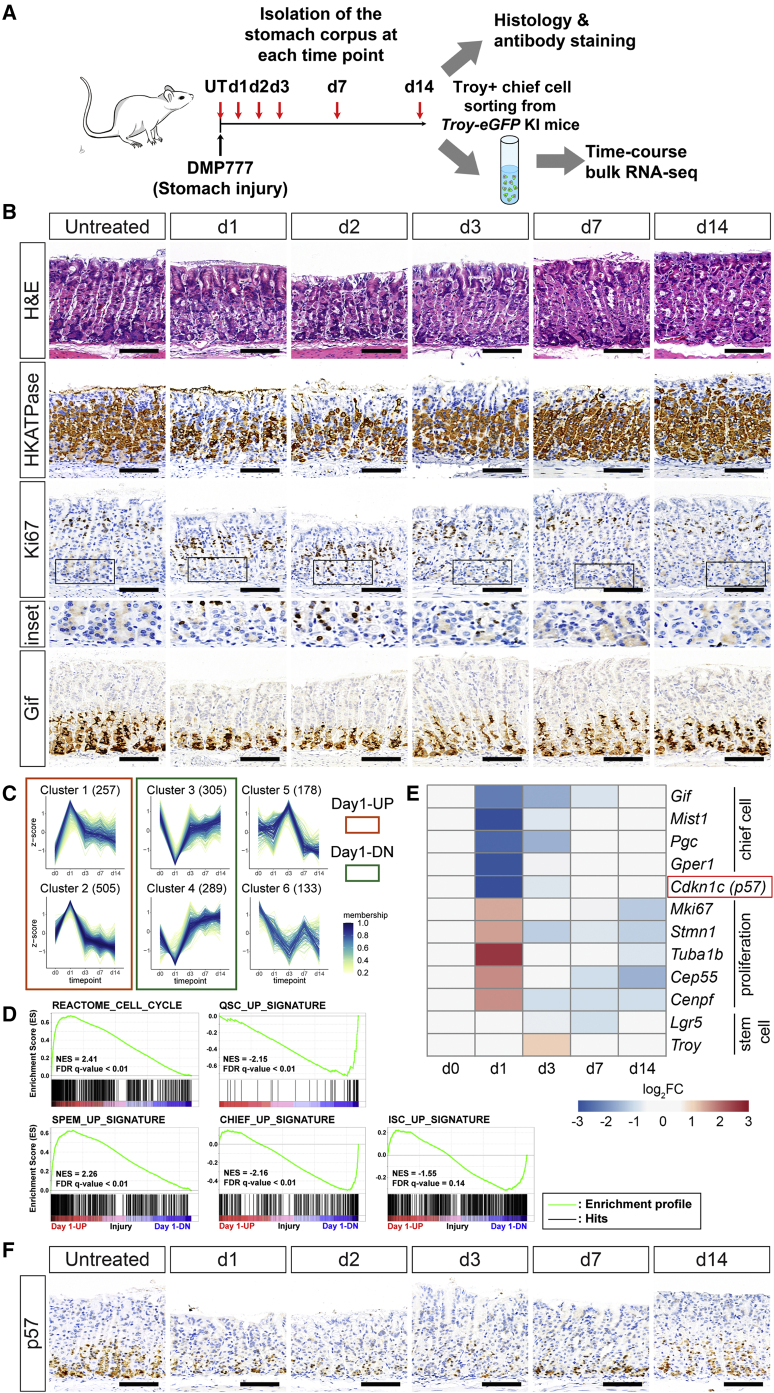
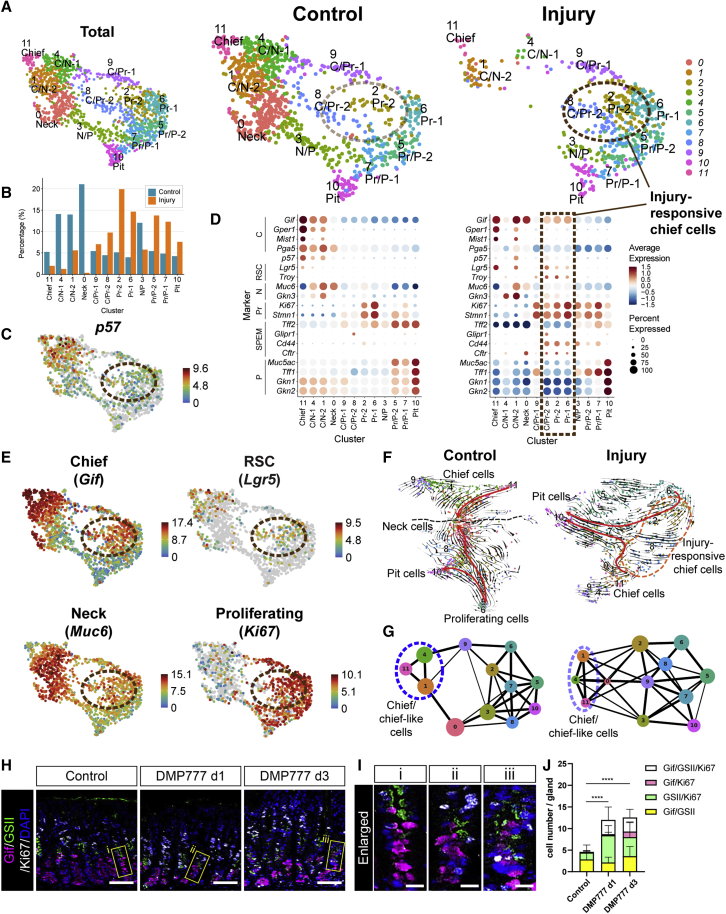
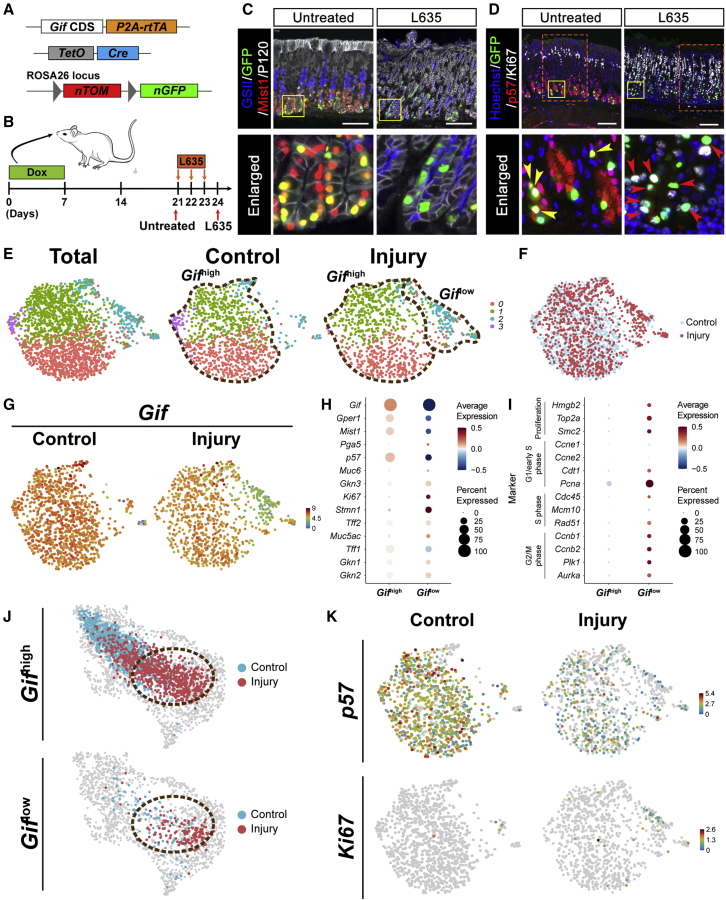
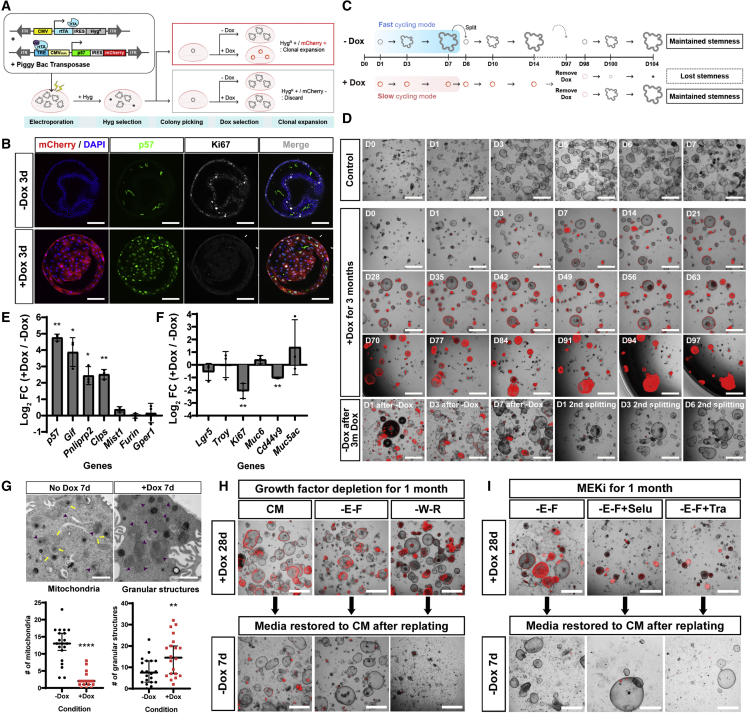
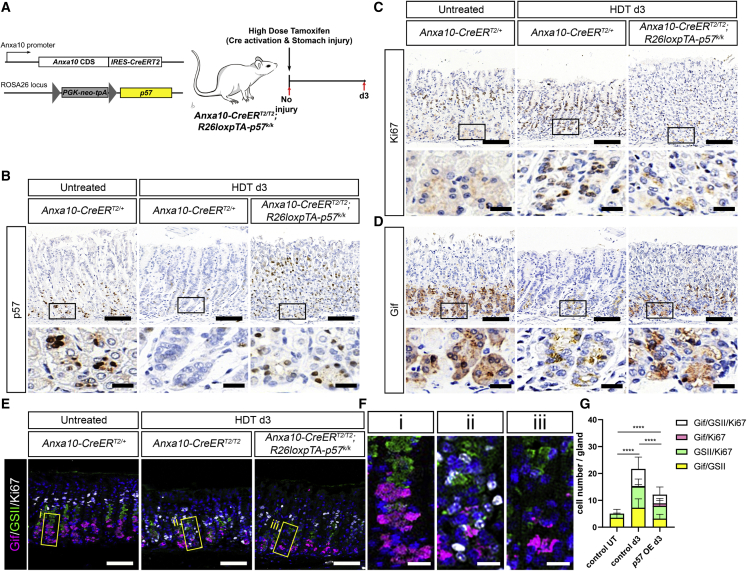
Adult stem cells constantly react to local changes to ensure tissue homeostasis. In the main body of the stomach, chief cells produce digestive enzymes; however, upon injury, they undergo rapid proliferation for prompt tissue regeneration. Here, we identified p57Kip2 (p57) as a molecular switch for the reserve stem cell state of chief cells in mice. During homeostasis, p57 is constantly expressed in chief cells but rapidly diminishes after injury, followed by robust proliferation. Both single-cell RNA sequencing and dox-induced lineage tracing confirmed the sequential loss of p57 and activation of proliferation within the chief cell lineage. In corpus organoids, p57 overexpression induced a long-term reserve stem cell state, accompanied by altered niche requirements and a mature chief cell/secretory phenotype. Following the constitutive expression of p57 in vivo, chief cells showed an impaired injury response. Thus, p57 is a gatekeeper that imposes the reserve stem cell state of chief cells in homeostasis.

Keywords: Gif; Lgr5; Troy; base stem cells; gastric chief cells; p57; reserve stem cells; scRNA-seq; stem cell quiescence; stomach.


Conflict of interest statement

Declaration of interests The authors declare no competing interests.

Figures

None
Graphical abstract
Figure 1
Figure 1
Time course bulk RNA-seq of Troy+ chief cells after injury shows a rapid change in transcriptome including downregulation of p57, a candidate for chief cell activation (A) Experimental scheme for time course analysis of the corpus epithelium and bulk-RNA seq of Troy+ cells (GFP positive) upon damage. UT, untreated. (B) Immunohistochemistry of the stomach corpus epithelium upon DMP-777-induced injury, representative of 2–4 mice used per time point. Scale bars, 100 μm. (C) Expression profiles of 6 clusters from the time course bulk RNA-seq. Membership values indicate the degree to which data points belong to a cluster. The number of genes of each cluster is indicated in the brackets. (D) GSEA of gene signatures associated with the cell cycle, SPEM, quiescent stem cells (QSCs), chief cells, and intestinal stem cells (ISCs). NES, normalized enrichment score. (E) Heatmap of the marker genes and a candidate (red rectangle) molecular switch for activation of reserve stem cells. Expression of the stemness genes was stable during the injury response. (F) Expression pattern of p57 upon DMP-777-induced injury. Scale bars, 100 μm. See also Figure S1 and Tables S1 and S2.
Figure 2
Figure 2
Single-cell transcriptomic analysis identifies a specific injury-responsive chief cell population that appears after injury of the stomach epithelium (A) UMAP plots of scRNA-seq from Pgc+ cells in both conditions (Total, left), uninjured (Control, middle), and 1 day after DMP-777-induced corpus injury (Injury, right). Twelve clusters are annotated as follows. 0, Neck; 1, C/N-2; 2, Pr-2; 3, N/P; 4, C/N-1; 5, Pr/P-2; 6, Pr-1; 7, Pr/P-1; 8, C/Pr-2; 9, C/Pr-1; 10, Pit; 11, Chief. Full names are provided in the results section. Brown-dotted circles show where the injury-responsive chief cell population is mapped in control (faint brown) and injury (vivid brown) conditions. (B) Percentage of cells in each cluster per condition. (C) UMAP plot of p57 expression. (D) Dot plots for expression of marker genes of each cell type in control (left) and injury (right) conditions. The box indicates the injury-responsive chief cell population. (E) UMAP plots showing marker gene expression of chief cells, RSCs, neck cells, and proliferating cells. Brown-dotted circles indicate the injury-responsive chief cell population. (F) t-distributed stochastic neighbor embedding (t-SNE) plots showing RNA velocity inferred by scVelo in control and injury conditions. Injury-responsive chief cells are located in the orange-dotted area. (G) PAGA graph showing all the edges connecting cell clusters (nodes) in control and injury conditions. The width of the edges quantifies the connectivity between clusters. Blue-dotted circles indicate chief or chief-like cells in control (vivid) and injury (faint). Topological modularities (Q) are 0.14 and 0.06 in the control and injury samples, respectively. (H) Triple staining of markers for chief cells (Gif, magenta), neck cells (GSII, green), proliferating cells (Ki67, white) in control, at 1 dpi and at 3 dpi. Nuclei were counterstained with DAPI (blue). Scale bars, 100 μm. (I) Insets of figure (H). Scale bars, 20 μm. (J) Quantification of injury-responsive cells (Gif+/GS-II+, Gif+/Ki67+, GS-II+/Ki67+, and Gif+/GS-II+/Ki67+). Twenty glands from 2–3 mice per condition were analyzed. Data are represented as mean ± SD. ∗∗∗∗p < 0.0001 calculated by one-way ANOVA for total injury-responsive cell number. See also Figure S2.
Figure 3
Figure 3
Lineage tracing and scRNA-seq by Gif+ chief cells identify injury-responsive chief cells (A) Diagram of the Gif-Cre-nTnG allele used in this study. (B) Experimental scheme of the L635 treatment study in Gif-Cre-nTnG mice. Dox was administered for 1 week and off for 2 weeks to label chief cells with GFP. The mice were then left untreated or treated with 3 doses of L635. (C and D) Paraffin sections of Gif-Cre-nTnG mouse stomachs untreated or treated with 3 doses of L635 were immunolabeled with antibodies against (C) GFP (green), Mist1 (chief cells, red), GSII-lectin (neck cells, blue), and P120 (epithelial cell membrane, white) or (D) GFP (green), p57 (red), and Ki67 (proliferating cells, white). GFP+Mist1+ cells indicate chief cells and GFP+GSII+ cells indicate injury-responsive chief cells. Arrowheads indicate GFP+p57+ double-positive cells (yellow) and GFP+Ki67+p57-proliferating injury-responsive chief cells (red), respectively. Nuclei were counterstained with hoechst (blue) in (D). Yellow boxes indicate enlarged areas. Orange-dotted boxes indicate enlarged areas shown in Figure S3C. Scale bars, 100 μm. (E) UMAP plots of scRNA-seq from Gif lineage cells (GFP+TdTom) of Gif-Cre-nTnG mice in both conditions (Total, left), uninjured (Control, middle), and 2 days after DMP-777-induced corpus injury (Injury, right). Gifhigh and Giflow populations are marked by brown-dotted lines. (F) UMAP plots for control (light blue) and injury (red) cells. (G) UMAP plots of Gif expression in control (left) and injury (right). (H) Dot plot for expression of marker genes of each cell type in Gifhigh and Giflow cell populations. (I) Dot plot for expression of marker genes of proliferation or cell cycle in Gifhigh and Giflow cell populations. (J) Projection of Gifhigh and Giflow cells on the UMAP plot for Pgc+ scRNA-seq. The cells in control and injury are denoted as light blue and red, respectively. Brown-dotted circles indicate the injury-responsive chief cell population. (K) UMAP plots of p57 and Ki67 expressions in control (left) and injury (right). See also Figure S3.
Figure 4
Figure 4
p57 overexpression in gastric organoids triggers long-term growth arrest and enforces a secretory phenotype (A) Scheme of electroporation generating Dox-inducible p57-OE gastric organoids. (B) Immunolabeling with p57 and Ki67 antibodies in Dox-inducible p57-OE organoids without (−Dox 3d) or with Dox treatment (+Dox 3d). Scale bars, 100 μm. (C) Experimental scheme of long-term Dox treatment. Stemness maintenance can be assessed by checking organoid regrowth following Dox withdrawal after long-term Dox treatment. (D) Induction of long-term growth arrest for 3 months in gastric organoids by p57 expression. Merged images of brightfield and mCherry. The orientation of the organoids changed after D70 as the Matrigel was detached. Organoid regrowth was monitored until the second passage after Dox withdrawal. Several bubbles generated during seeding are visible in “D1 after −Dox.” Scale bars, 1 mm. (E and F) qRT-PCR of chief cell markers (E) and other markers (F) showing log2-fold change (log2 FC) of gene expression in p57-OE organoids (+Dox) compared with no Dox control after 2 weeks of Dox treatment. Tbp was used as a reference gene, and the data were generated from three biological replicates. Statistical significances were determined by unpaired multiple t test. p < 0.05, ∗∗p < 0.01. (G) Upper images: TEM images of the Dox-inducible p57-OE organoids cultured with (+Dox) or without (−Dox) Dox treatment for 1 week. Yellow arrows indicate mitochondria and purple arrowheads indicate secretory granules. Scale bars, 1 μm. Lower graphs: quantification of the number of mitochondria and granules. Twenty cells of each condition were analyzed. Lines indicate median with 95% confidence interval. Statistical significances were determined by unpaired Welch’s t test. ∗∗p < 0.01, ∗∗∗∗p < 0.0001. (H) Niche requirements of the p57-OE organoids. p57-OE organoids induced by pretreatment with Dox for 1 week were cultured in each condition together with Dox for 1 month. Organoid growth was examined in complete medium without Dox after replating. CM, complete medium; -E-F, WRNG medium; -W-R, EFNG medium. Scale bars, 1 mm. (I) p57-OE organoids induced by Dox treatment were cultured in each condition for 1 month. Organoid growth was examined in complete medium without Dox after replating. -E-F, WRNG medium; -E-F+Selu, WRNG medium with selumetinib (100 nM); -E-F+Tra, WRNG medium with trametinib (1 nM). Scale bars, 1 mm. See also Figure S4.
Figure 5
Figure 5
p57 overexpression in stomach epithelium prevents activation of chief cells after injury (A) Scheme of the in vivo experiment. (B–D) (B) p57, (C) Ki67, and (D) Gif staining in control epithelium without injury (left), control at 3 dpi with HDT (middle), and p57-OE epithelium at 3 dpi with HDT (right). Rectangles indicate insets showing base region. Scale bars, 100 μm (upper figures) and 20 μm (lower figures). (E) Triple staining with markers for chief cells (Gif, magenta), neck cells (GSII, green), and proliferating cells (Ki67, white) in the conditions as outlined above. Scale bars, 100 μm. (F) Insets of figure (E). Scale bars, 20 μm. (G) Quantification of injury-responsive cells (Gif+/GS-II+, Gif+/Ki67+, GS-II+/Ki67+, and Gif+/GS-II+/Ki67+). Control UT, Anxa10-CreERT2/+ untreated; control d3, Anxa10-CreERT2/T2 HDT d3; p57 OE d3, Anxa10-CreERT2/T2; R26loxpTA-p57k/k HDT d3. In total, 16–20 glands from 2–3 mice per condition were analyzed. ∗∗∗∗p < 0.0001 calculated by one-way ANOVA for total injury-responsive cell number. See also Figure S5.

Similar articles

Cited by

References

    1. Alexa A., Rahnenfuhrer J. topGO: Enrichment Analysis for Gene Ontology. R package version 2.36.0. https://bioconductor.org/packages/topGO/
    1. Anders S., Pyl P.T., Huber W. HTSeq—a Python framework to work with high-throughput sequencing data. Bioinformatics. 2015;31:166–169. - PMC - PubMed
    1. Andrews S. FastQC: a quality control tool for high throughput sequence data. http://www.bioinformatics.babraham.ac.uk/projects/fastqc
    1. Arnold K., Sarkar A., Yram M.A., Polo J.M., Bronson R., SenGupta S., Seandel M., Geijsen N., Hochedlinger K. Sox2+ adult stem and progenitor cells are important for tissue regeneration and survival of mice. Cell Stem Cell. 2011;9:317–329. - PMC - PubMed
    1. Ayyaz A., Kumar S., Sangiorgi B., Ghoshal B., Gosio J., Ouladan S., Fink M., Barutcu S., Trcka D., Shen J., et al. Single-cell transcriptomes of the regenerating intestine reveal a revival stem cell. Nature. 2019;569:121–125. - PubMed

Publication types

Substances